
記住我


HFOs are generated by differentiating Matrigel-embedded hPSC aggregates via CHIR99021- (CHIR) and IWP2-mediated biphasic WNT pathway modulation30,31. The protocol induces an inner core of anterior foregut endoderm (AFE) and endothelial cells (ECs), an endocardial layer that separates the inner core from a myocardial layer (consisting of CMs), which is enclosed by an outer layer composed of CMs, septum transversum-like cells and posterior foregut endoderm (PFE); the whole structure is surrounded by mesenchymal cells (MES). Heart-forming organoids acquire a specific spatial multi-tissue organization, resembling anatomical aspects of cardiac and foregut development of the native embryo28.
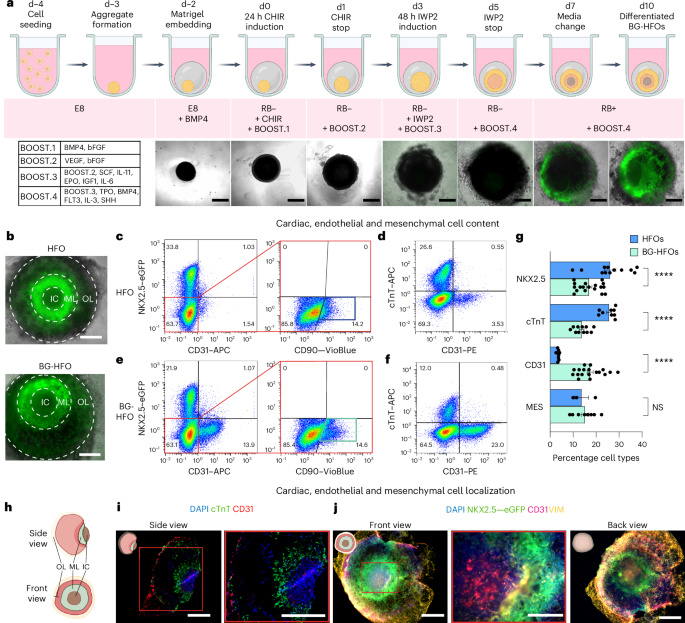
To form BG-HFOs, the HFO protocol (schematic in Fig. 1a) was modified by supplementing growth factors and cytokines as previously established for hPSC differentiation to HPCs19,21,32. Specifically, pre-mesodermal priming by BMP4 on ‘day minus two’ (d−2) was followed by the addition of bFGF on d0, VEGF on d1 and a defined combination of additional factors from d3 onwards for haemato-endothelial differentiation in a stage-, factor- and dose-dependent manner (BOOST.1–4; Fig. 1a).
Fig. 1: BG-HFOs display cardiac, endothelial and mesenchymal composition.
a, Top: Protocol schematic for BG-HFO formation. Bottom left: Following Matrigel embedding, hPSC aggregates are differentiated using CHIR and IWP2 as well as specific time- and dose-dependent supplementation of haemato-endothelial-driving growth factors defined as BOOST.1–4. Bottom right: Overlay of light and fluorescence microscopy images depicting the time-dependent development of hES3 NKX2.5–eGFP-derived BG-HFOs from d−2 (embedding in Matrigel) until d10. b, Front view (see schematic in h) of a canonical hES3 NKX2.5–eGFP-derived HFO (top) and a BG-HFO (bottom), both forming three layers, that is, inner core, myocardial layer and outer layer. c,e, Representative flow cytometry plots of four or five homogenized HFOs (c) and BG-GFOs (e) to identify mesenchymal cells via the NXK2.5–eGFP transgene and staining for the endothelial cell marker CD31 as well as the fibroblast marker CD90. d,f, Representative flow cytometry plots of four or five homogenized HFOs (d) and BG-HFOs (f) gated on CD31 and the cardiac marker cTnT. c–f, The percentage of cells in the different quadrants is indicated. g, Proportions of cells expressing the markers NKX2.5–eGFP, cTnT and CD31 as well as mesenchymal cell content (NKX2.5–eGFP−CD31−CD90+ cells). Independent groups of four or five pooled HFOs (NKX2.5–eGFP, n = 12; cTnT, n = 9; CD31, n = 9; MES, n = 3) or BG-HFOs (NKX2.5–eGFP, n = 18; cTnT, n = 11; CD31, n = 19; MES, n = 8) from 14 independent experiments; data are presented as the mean ± s.e.m. One-way analysis of variance (ANOVA) with Bonferroni’s multiple comparison test; ****P < 0.0001; NS, not significant (P > 0.9999). h, Schematic showing the structure of a BG-HFO. i, Cryosections of a BG-HFO stained for cTnT and CD31 as well as with the nuclear marker 4,6-diamidino-2-phenylindole (DAPI). j, Whole-mount images of a BG-HFO immunofluorescently stained with DAPI, anti-VIM and anti-CD31. i,j, The pictograms (top left of images) depict the orientation of the organoids in the images. Right: Magnified views of the regions in the red boxes are shown. a,b,i,j, Scale bars, 500 µm. IC, inner core; ML, myocardial layer; and OL, outer layer.
The NKX2.5–eGFP hESC reporter line enables visualization of the typical HFO pattern (NKX2.5–eGFP− inner core, NKX2.5–eGFP+ myocardial layer and partially NKX2.5–eGFP+ outer layer) from d7 onwards (Fig. 1a(bottom),b). Notably, BG-HFOs display a NKX2.5–eGFP pattern equivalent to HFOs in the front view on d10–14 (endpoint analysis; Fig. 1b,h). BG-HFO formation was highly robust between experiments as well as different Matrigel lots and was reproduced with an independent hPSC line (hiPSC HSC_ADCF_SeV-iPS220, ref. 33; Extended Data Fig. 1a–c).
Flow cytometry quantification of CMs (NKX2.5–eGFP+cardiac troponin-T (cTnT)+), ECs (CD31+) and MES (NKX2.5–eGFP−CD31−CD90+) revealed substantial differences in the composition of BG-HFOs versus HFOs (Fig. 1c–g and Extended Data Fig. 1d). The relative proportion of CMs was significantly reduced in BG-HFOs, whereas the EC content was about sixfold increased, representing almost 20% of cells in BG-HFOs; the MES content remained similar between the models (Fig. 1c–g). Equivalent results were obtained with HSC_ADCF_SeV-iPS220-derived BG-HFOs (Extended Data Fig. 1e,f). Alternative matrices (Cultrex and Extragel) resulted in failed BG-HFO formation, underpinning a Matrigel dependence (Extended Data Fig. 1g).
Calcium imaging and fluorescence microscopy revealed distinct contraction patterns in BG-HFOs, that is, synchronous myocardial layer contraction (Supplementary Videos 1 and 2), circular beating (Supplementary Videos 3 and 4) and wave-like propagation (Supplementary Videos 5 and 6) equivalent to HFOs28. In addition, beats per minute analysis showed similar values between the two models (Extended Data Fig. 2a).
Equivalent to HFOs, patch clamping of BG-HFO-derived NKX2.5–eGFP+ CMs revealed some atypical action potential patterns and a minor population of atrial-like cells (6%); the majority (75%) of cells were classified as immature ventricular-like (Extended Data Fig. 2b–e) due to the low upstroke velocity (Extended Data Fig. 2f–i), consistent with previous work28,30,34. The maximal diastolic potential to resting membrane potential ratio, action potential duration at 50% of repolarization action potential amplitudes and upstroke velocities of ventricular-like cells were comparable between this organoid model and our previous study on HFOs (Extended Data Fig. 2f–i), suggesting similar CM phenotypes.
Investigation of the proposed three-dimensional structure of BG-HFOs (Fig. 1h) in more detail by immunofluorescence analysis revealed that the inner core is enveloped by a cTnT+ myocardial layer and CD31+ ECs are present in the inner core (Fig. 1i), similar to HFOs28. Notably, although the outer layer of HFOs is mainly composed of CMs and PFE28, the outer layer of BG-HFOs contains mainly CMs and ECs but no PFE (Fig. 1i). Whole-mount immunofluorescence staining of BG-HFOs confirmed the presence of ECs in the inner core and the outer layer (Fig. 1j and Extended Data Fig. 3a). Similar to HFOs, vimentin-expressing (VIM+) MES were found in the outermost BG-HFO layer but only in the latter model were MES also found in the inner core (Fig. 1j and Extended Data Fig. 3b). No AFE was detected in BG-HFOs. Remarkably, in the outer layer of BG-HFOs, ECs form a dense branching endothelial network (Extended Data Fig. 3c).
Together, the HFO-typical AFE is replaced by ECs and MES in BG-HFOs. Moreover, whereas the outer layer of HFOs consists of PFE and CMs28, the endoderm is replaced by mesodermal derivatives, particularly ECs, in BG-HFOs (Extended Data Fig. 3a,d).
BG-HFOs present endothelial subtypes and haematopoietic cellsEndothelium can be subdivided into vascular and HE35; vascular endothelium specifies into a venous (VE) or arterial (AE) subtype lining veins or arteries, respectively4,8,36, whereas HE is a heterogeneous population generating haematopoietic cells of the different waves37,38,39.
All ECs are characterized by the expression of CD31 and CD34, whereas CD73 is expressed at high levels preferentially, but not exclusively, in VE36. Flow cytometry revealed CD73+CD31+CD34+ cells in BG-HFOs, representing mostly VE (approximately 8% of all cells), and CD73−CD31+CD34+ cells, a heterogeneous population of putative AE and HE (approximately 4%; Fig. 2a)36,37. Only VE-like endothelium was observed in HFOs (Fig. 2b). Moreover, BG-HFOs showed significantly more CD144+ and CD34+ ECs (Fig. 2c–f), consistent with elevated CD31 expression (Fig. 1g). Immunofluorescence staining for CD144 and cTnT corroborated the localization of ECs in the inner core and outer layer of BG-HFOs, and CD144+ cells co-expressed CD31, as expected (Extended Data Fig. 4a,b).
Fig. 2: BG-HFOs display the presence of HE, VE, AE and HPCs.
a, Representative flow cytometry plots of four or five homogenized BG-HFOs to identify the different endothelial subtypes, that is, AE/HE (CD73−CD31+CD34+) and VE (CD73+CD31+CD34+) endothelium. b, Proportion of AE/HE and VE in HFOs and BG-HFOs, determined using flow cytometry analysis. Independent groups of four or five pooled HFOs (AE/HE and VE, n = 3) and BG-HFOs (AE/HE and VE, n = 6) from four independent experiments were analysed; AE/HE, P = 0.0028. c,e, Representative flow cytometry plots of four or five homogenized HFOs and BG-HFOs to identify CD34+ endothelial and CD43+ haematopoietic cells (c) as well as CD144+ endothelial and CD45+ haematopoietic cells (e). a,c,e, The percentage of cells in the different quadrants is indicated. d,f, Proportion of CD34+ and CD43+ (d), and CD144+ and CD45+ (f) cells in HFOs and BG-HFOs determined from c and e, respectively. Independent groups of four or five pooled HFOs (CD34, CD43, CD144 and CD45, n = 12) and BG-HFOs (CD34 and CD43, n = 18; CD144 and CD45, n = 19) from 14 independent experiments were analysed. d, CD34, P = 0.0166. f, CD45, P = 0.0021. g, Outer layer of endothelial and haematopoietic cells. Front and back views of an hES3 NKX2.5–eGFP-derived BG-HFO following whole-mount immunofluorescence staining with DAPI, anti-CD31 and anti-CD45. Higher magnification images of the smaller red and orange boxes are outlined in the respective colours. h, Magnified view of the outer layer of the BG-HFO in g showing HPCs. i, Cryosection of a BG-HFO stained with DAPI, anti-CD31 and anti-CD43. Merged (top right) and separate channel (bottom) images of the region in the red box at higher magnification are provided. h,i, The arrows point to cells co-expressing CD31 and CD45, representing HPCs. j, Schematic of the cell composition of a BG-HFO. b,d,f, Data are presented as the mean ± s.e.m. One-way ANOVA with Bonferroni’s multiple comparison test; *P ≤ 0.05; **P ≤ 0.01; ****P ≤ 0.0001. g,i, The pictograms (top left in images) depict the orientation of the organoids in the images. g–i, Scale bars, 500 µm (main images in g,i) and 200 µm (h and magnified views in g,i).
In contrast to HFOs, BG-HFOs contain approximately 10% CD43+ (Fig. 2c,d) and 4% CD45+ cells (Fig. 2e,f), typical markers of HPCs and mature haematopoietic derivatives.
Using immunofluorescence staining, round CD45+ haematopoietic cells and CD45+CD31+ HPCs were localized in direct proximity to CD31+ or CD144+ endothelium in the outer layer (Fig. 2g,h and Extended Data Fig. 4c); cryosections and whole-mount immunofluorescence staining further corroborated the presence of round CD43+ haematopoietic cells and CD43+CD31+ HPCs mainly in the outer layer of BG-HFOs (Fig. 2i and Extended Data Fig. 4d).
Notably, monocytes and macrophages (CD14+)—some of which showed typical cytoplasmic extroflections of myeloid cells—were detected in the outer layer and the surrounding Matrigel (Extended Data Fig. 4e). Cells positive for the myeloid/lymphoid marker CD4 were also identified in d14 and d24 BG-HFOs using flow cytometry (Extended Data Fig. 4f).
The importance of supplemented factors (BMP4 and bFGF) at the early stages of differentiation (d−2 and d0) and the impact of some factors in the BOOST.3 and BOOST.4 mixture was investigated. Specifically, we tested the following: VEGF addition only (Cond.1), depletion of BMP4 and bFGF on d−2 and d0 (Cond.2) and removal of specific factors (Cond.3) based on published haematopoietic protocols18,19,21,23,24,40,41 (Extended Data Fig. 5a). Despite minor changes in the CM and EC content between Cond.1, Cond.2 and Cond.3 compared with BG-HFOs, the haematopoietic cell content (CD43+ and CD45+) was significantly lower in all modified conditions (Extended Data Fig. 5b).
To better localize the HE in BG-HFOs, we performed immunofluorescence staining of the transcription factor aldehyde dehydrogenase 1 family member A1 (ALDH1A1)—expressed in HE and emerging HSCs in the embryonic AGM region24,42—and found ALDH1A1 and CD31 co-expression indicative of HE predominantly in the outer layer (Extended Data Fig. 6a,b). Immunofluorescence staining of runt-related transcription factor 1 (RUNX1)—another established transcription factor in HE and HSC/HPC development—revealed clusters of positive cells in the outer layer (Extended Data Fig. 6c); on consecutive cryosections the RUNX1+ cluster co-expressed CD31, further corroborating the localization of HE in the outer layer (Extended Data Fig. 6d). Neither ALDH1A1+CD31+ nor RUNX1+CD31+ cells were detected in the inner core of BG-HFOs; only cells single-positive for CD31 representing other EC types, presumably VE, were detected.
Together, in contrast to HFOs, BG-HFOs include different subtypes of endothelium—that is, AE and HE (AE/HE), and VE—as well as HPCs. Whereas the CD31+ and CD144+ ECs pervade the whole organoid, the presence of ALDH1A1+CD31+ and RUNX1+CD31+ HE as well as CD45+ and CD43+ cells is exclusive to the outer layer and thus in a morphologically distinct area of BG-HFOs (Fig. 2j).
Confirmation of various tissues in BG-HFOs via scRNA-seqSingle-cell RNA sequencing (scRNA-seq) of two BG-HFOs showed equally positioned cell populations demonstrating robustness of tissue formation in individual organoids (Fig. 3a). Merging of sample data and clustering using Seurat functions and the Leiden algorithm revealed nineteen clusters, some of which were unified based on gene expression similarities to form thirteen major clusters (Fig. 3b). Each cluster was classified based on the expression of marker genes, confirming lineages suggested by immunofluorescence staining and flow cytometry.
Fig. 3: Presence of different endothelial subtypes, CMs and haematopoietic derivatives revealed by scRNA-seq.
a, Uniform manifold approximation and projection (UMAP) plot of cells from two d14 BG-HFO samples colour-coded according to sample identity (10,000 cells for each sample). b, UMAP plot with cells colour-coded according to the graph-based clustering. Clusters were annotated based on differential expression of key genes. c, Feature plot of selected genes across all BG-HFO clusters are shown in the composite UMAP plots. The red colour gradient represents the level of expression of the indicated key genes. Regions outlined in black define the different clusters based on key genes expression.
Cluster-specific expression of key lineage markers is highlighted in Fig. 3c. Three endothelial clusters were identified, all of which express the general EC genes, such as CDH5 (CD144) and PECAM1 (CD31), together representing approximately 25% of all cells. Two major endothelial clusters were characterized by the expression of AE and VE genes, comprising approximately 16% of all cells. The VE cluster displayed higher expression of the venous genes NR2F2 (COUP-TFII) and NT5E (CD73), whereas the AE cluster was specified by the arterial markers DLL4, CXCR4, GJA4, SOX17 and MECOM15,42 (Figs. 3c and 4a).
Fig. 4: Identification of haemato-endothelial populations in BG-HFOs and a comparison between HFOs and BG-HFOs using scRNA-seq.
a, Haemato-endothelial dot plot showing genes that are differentially expressed between the AE, VE and HSCs/HPCs. The dimension of the dots represents the percentage of cells expressing the specific gene, and the red colour gradient represents the level of expression. b, Schematic of the haemato-endothelial markers representing the multiple haemato-endothelial populations present in the BG-HFOs and markers used to identify them at gene (scRNA-seq) and protein expression (immunofluorescence staining, flow cytometry on BG-HFOs and functional analyses outcomes) levels. HCs, haematopoietic cells; My, myeloid derivatives; Ly, lymphoid derivatives. c, BG-HFO UMAP plot (reference dataset) and pie diagram with cells colour-coded according to the annotated cell types. Clusters were annotated based on differential expression of key genes. The names and cell percentages of each cluster are reported. d, T-Distributed stochastic neighbour embedding (t-SNE) plot and pie diagram of the HFOs query dataset28 with transferred cell-type annotation from the reference dataset (BG-HFOs) and original cell-type annotation from previous work28 (grey shaded). The names and cell percentages of each cluster are reported. APOP, apoptotic cells, UNAS, unassigned cells. e, Compositional analysis of HFOs and BG-HFOs. Cell-type identification based on expression of marker genes (BG-HFOs) and reference mapping (HFOs). Subsets of HFO-specific cell types were identified based on previous work28.
Cardiac-related clusters included CMs (approximately 11%), endocardial-like cells (ELCs; approximately 1%) and proepicardium/septum transversum (PE/ST; approximately 19%). Cardiomyocytes and ELC cells were characterized by the common expression of NKX2.5, MYH6, MYL3, NPPA, TNNC1 and ACTC1; ELCs displayed additional expression of endothelial genes including CDH5 and PECAM1 (ref. 43; Fig. 3c and Extended Data Fig. 7a). The mesenchyme-derived PE/ST cluster was identified by the expression of WT1, TBX18 and mesenchymal markers; part of this cluster expresses TOP2A and MKI67, indicating proliferation. A cluster expressing prevalently mesenchymal genes (MES; approximately 10% of all cells), including LUM and PRRX1, was also observed (Fig. 3c and Extended Data Fig. 7b).
Only a minor cluster expressing the PFE-related genes AFP and HNF4A was observed (approximately 1%)28,44 and no AFE was detectable, confirming the almost entire loss of endodermal tissue in BG-HFOs.
Four major haematopoiesis-related clusters were identified. A cluster of megakaryocytes (Mk, 13%) expressing PF4, TMEM40 and PPBP was detected. Megakaryocytes are developmentally close to erythroid derivatives; the erythroid cluster (Ery, 7%) indeed shared expression of some genes with the megakaryocyte cluster (NFE2 and GATA1; Extended Data Fig. 7c). The erythroid cluster, however, could be distinguished by high expression levels of GYPA, the fetal globin genes HB2A and HBG1 as well as the embryonic globin genes HBZ and HBE1 (Fig. 3c and Extended Data Fig. 7d).
A cluster of myeloid cells represented by monocytes/macrophages (Mo/Mø; 5%) was identified by the expression of early monocyte-related genes such as PTPRC, ITGAM and CD14, and macrophage-related maturation genes including HLA-DRA, C1QA and CD4 (Fig. 3c). Notably, in the latter cluster, expression in a few cells of the B cell marker CD19 indicates the putative presence of cells with lymphoid potential (Extended Data Fig. 7e).
Identification of HPCs based on gene expression patterns is challenging due to ambiguous markers and the multitude of simultaneous intermediates known to exist along the native haematopoietic differentiation4,8,11. However, it was possible to identify an HPC cluster in BG-HFOs (4%) by co-expression of factors related to HSC/HPC development (including SPN (CD43), PTPRC (CD45), CD44, MYB, RUNX1, GATA2 and TAL115,19,42,45 as well as the proliferation-associated markers MKI67 and TOP2A), potentially reflecting the highly proliferative phenotype of HPCs in vivo. Genes recently identified by Calvanese and colleagues42 to be enriched in HSCs (ALDH1A1, MLLT3, MYCN, GFI1, KCNK17, RAB27B and ITGA2B) were, to some degree, also expressed in the HPC cluster, whereas genes such as HOXA9, MECOM, HLF and SPINK2 were missing, indicating an absence of proper HSCs42 (Figs. 3c and 4a).
Annotation of our results in the ‘BlueprintEncodeData’ database confirmed the presence of common myeloid progenitors, granulocyte–macrophage progenitors and megakaryocyte–erythroid progenitors in the HPC cluster; in addition, a few cells annotated as common lymphoid progenitors were detected in the Mo/Mø cluster (Extended Data Fig. 7f).
Importantly, we detected some BCL11A- and CD7-expressing cells in both the Mo/Mø and HPC clusters, which suggests the presence of early progenitors with putative lymphoid potential (Extended Data Fig. 7g).
A minor cluster co-expressing the mentioned AE genes, the HE/haematopoietic-related genes RUNX1 and SPN, and embryonic-fetal globin genes may represent very immature haematopoietic cells46, potential early primitive progenitors (EPP; 2%, Fig. 3c).
Together, the scRNA-seq analysis confirmed derivatives of heart anlagen (CMs and ELCs), derivatives of the mesenchyme (PE/ST and MES) and endothelial subtypes (AE and VE) in BG-HFOs, revealed more details on haematopoietic derivatives—including HPCs and erythro-myeloid cells (megakaryocytes, erythroids and Mo\Mø)—and indicated the presence of cells expressing early lymphoid progenitor genes.
Haemato-endothelial-related markers observed by scRNA-seq, immunofluorescence staining, flow cytometry and functional assays were collected in a lineage tree in Fig. 4b.
Comparison of scRNA-seq data of BG-HFOs and HFOs28 further elucidated analogies and differences between both models. The comparison confirmed high similarities in the gene expression signature of the CM clusters (Fig. 4c–e), corroborating both the flow cytometry analysis (Fig. 1c–g) and the functional assessment (Extended Data Fig. 2a–i). Notably, the PE/ST cluster is expanded in BG-HFOs compared with HFOs, in contrast to the reduced amount of CMs.
The MES cluster of HFOs and BG-HFOs presented a similar expression of key mesenchymal genes such as PRRX1, LUM and TWIST1, although the overall expression patterns were not similar enough for the annotation, possibly reflecting different mesenchymal subtypes (Fig. 4c–e). Furthermore, the gene expression signature of the minor PFE cluster in BG-HFOs was comparable to the larger PFE cluster in HFOs.
The EC cluster in HFOs displayed gene expression similarities to the EC cluster in BG-HFOs but not the AE cluster (Fig. 4c–e). As expected, neither the AE nor the haematopoietic clusters (Mk, Ery, Mo/Mø, EPPs and HPCs) were detected in HFOs; vice versa, the AFE and hPSC clusters in HFOs28 were not detectable in BG-HFOs (Fig. 4c–e).
For insights into cell–cell communication (CCC), which is pivotal in tissue development, a ligand–receptor analysis framework (LIANA) was used to infer ligand–receptor interactions47. Following the selection of AE, CM, HPC, EPP, MES and PE/ST clusters, the top 30 ligand (source)–receptor (target) interactions were visualized (Extended Data Fig. 8a,b). The most frequent interactions (aggregate_rank ≤ 0.01) were observed in BG-HFOs between CM and AE, CM and PE/ST, PE/ST and AE, and MES and AE (Extended Data Fig. 8a).
Designating the cluster source (ligand provider; magnitude rank < 0.01) and the cluster target (receptor-expressing; magnitude rank < 0.01), we performed gene-set enrichment analysis using Enrichr and the Gene Ontology Biological Process 2023 database48,
留言 (0)