
記住我
Alzheimer’s disease (AD) is regarded as one of the most dominant forms of central nervous system neurodegeneration that evolves from clinically normal aging to mild cognitive impairment, followed by progressive neurocognitive dysfunction that culminates with dementia (Tahami Monfared et al., 2022). The neuroanatomical substrate of AD includes a gradual buildup of aggregated and fibrillar brain deposits of Amyloid β (Aβ) and hyperphosphorylated Tau (pau) (de la Monte, 2023). These abnormalities, which are widely considered neurotoxic and pivotal pathogenic factors in AD progression, have been exploited by non-invasive neuroimaging (Roman and Pascual, 2012; Ewers et al., 2011) and cerebrospinal fluid (CSF) diagnostic assays (Wallin et al., 1999; Olsson et al., 2016; Wurtman, 2015; Schaffer et al., 2015), and they have been aggressively targeted for disease remediation (de la Monte, 2023). However, the fundamental hypothesis that Aβ and pTau lesions cause rather than result from AD is not well supported by data showing closely related or identical pathologies in brains with “normal aging,” various forms of neurodegeneration, or incident pathologies such as head trauma, ischemia, metabolic, and neuroinflammatory diseases (de la Monte, 2023; Cunnane et al., 2020; de la Monte, 2014). Furthermore, lesion-targeted therapeutics to retard or remediate the clinical course or neuropathological features of neurodegeneration have repeatedly failed (Plascencia-Villa and Perry, 2023).
Growing evidence highlighting mechanistic roles of dysregulated brain metabolism as critical to AD pathogenesis has broadened our perspective and opened opportunities to address mediators of neurodegeneration that extend beyond Aβ and pTau (de la Monte, 2023). Despite evidence that AD includes a wide range of pathological processes that impact all cell types and extend into most brain regions, there is a dearth of knowledge corresponding to the entire spectrum of disease, particularly the non-Aβ and non-pTau abnormalities such as white matter atrophy and degeneration, glial, microvascular, and microglial pathologies, and dysregulation of energy metabolism (de la Monte, 2023; Bloom, 2014). Of note is that all these non-Aβ and non-pTau abnormalities were recognized for years but cast aside due to intensive research on the cloning and molecular characterization of Aβ and pTau.
Interest in the role of brain metabolic dysregulation as a mediator of AD and other neurodegenerative diseases was kindled by studies demonstrating impairments in brain glucose uptake and utilization, signal transduction through the insulin and insulin-like growth factor (IGF) networks, astrocyte, microvascular, and mitochondrial functions, and the regulation of neuroinflammatory mediators (Cunnane et al., 2020). The contributions of insulin/IGF-1 deficiency and resistance were further spotlighted by epidemiologic links between AD and systemic disorders of insulin resistance including Type 2 diabetes mellitus, obesity, and metabolic fatty liver disease (de la Monte, 2014; de la Monte and Wands, 2005; Hoyer, 1998; de la Monte, 2012a; de la Monte, 2012c; de la Monte, 2012b; de la Monte, 2017; de la Monte, 2019; de la Monte et al., 2009a). Understanding how insulin and IGF regulate brain energy metabolism, neuronal plasticity, oligodendrocyte functions including myelin maintenance, anti-oxidant, cell survival, and homeostatic mechanisms, and cytoskeletal functions could facilitate predicting the effects of trophic factor withdrawal and receptor resistances, and enhance appreciation of the molecular pathologic parallels between AD and diabetes mellitus (de la Monte and Grammas, 2019). Finally, brain insulin resistance has been linked to astrocyte and microglia dysfunctions that promote tau hyperphosphorylation and reduce Aβ degradation, causing neurotoxic paired-helical filament (PHF) and Aβ lesions to accumulate, exacerbate neuroinflammation, and drive the cascade of neurodegeneration (de la Monte, 2023; Chen et al., 2023).
Studies on the roles of dysregulated and compromised insulin and IGF-1 networks in AD, both humans and experimental models, revealed that neurodegeneration is associated with disease severity-related reductions in the expression of both the trophic factors and receptors (Rivera et al., 2005; Robbins et al., 2020; Steen et al., 2005; Talbot et al., 2012). Due to the combined features reminiscent of both Type 1 diabetes mellitus and Type 2 diabetes mellitus, the term “Type 3 Diabetes” was coined to provide a conceptual framework regarding the dominant mechanisms of neurodegeneration (de la Monte, 2014; Steen et al., 2005). Investigations in many laboratories showed that with the functional reductions in trophic factors and corresponding receptors, signals transmitted downstream through the insulin receptor substrate (IRS) docking proteins (de la Monte, 2014; Hoyer, 1998; de la Monte, 2012a; de la Monte, 2012b; de la Monte, 2017; de la Monte, 2019; de la Monte et al., 2009a; Chen et al., 2023; Steen et al., 2005; Talbot et al., 2012; Akhtar and Sah, 2020; Gabbouj et al., 2019; Hoyer, 2004; Lester-Coll et al., 2006; Salkovic-Petrisic et al., 2006; Sędzikowska and Szablewski, 2021), phosphatidylinositol-3-kinase (PI3K), Akt, and glycogen synthase kinase 3β (GSK-3β) were consistent abnormalities (Gabbouj et al., 2019). The inhibition of Akt has relevance to AD-associated deficits in brain energy metabolism, growth, cell survival, and neuronal plasticity. GSK-3β activation associated with inhibition of PI3K-Akt is a key driver of pro-oxidant and pro-stress pathways, neuroinflammation, Tau phosphorylation, and anti-cell survival, together leading to increased Aβ aggregation and PHF pathology (Salkovic-Petrisic et al., 2006; Beurel et al., 2015; Han et al., 2016; Phiel et al., 2003; Toral-Rios et al., 2020). Signaling through the Akt serine/threonine kinase is of particular interest because of its stimulatory support of growth, metabolism, and cell survival in neurons and oligodendrocytes (Hers et al., 2011), and the fact that inhibition of Akt impairs oligodendrocyte functions, including myelination (Figlia et al., 2018; Narayanan et al., 2009). Ultimately, the functional integrity of neurons and oligodendrocytes is integrally linked to the mechanistic target of rapamycin (mTOR) networks that are responsive to cellular nutrition, growth factor stimulation, e.g., insulin/IGF-1, and energy levels (Rosner et al., 2008; Tian et al., 2019) and regulates many functions including memory, cognition, and synaptic plasticity, glial functions, cellular homeostasis and myelination (Bockaert and Marin, 2015; Ishizuka et al., 2008; Lee, 2015), all of which are relevant to AD (de la Monte, 2023).
mTOR signaling is effectuated via its molecular complexes, mTORC1 and mTORC2, in which mTOR interacts with Raptor, TSC, mLST8, PRAS40, and DEPTOR (mTORC1) (Tian et al., 2019; Rosner et al., 2010), or Rictor, Protor-1/2, mammalian stress-activated MAP kinase-interacting protein 1 (mSIN1), mLST8 and DEPTOR (mTORC2) (Tian et al., 2019; Bockaert and Marin, 2015). The selectivity and specificity of mTORC1 and mTORC2 are conferred in part by differences in their subcellular localizations that enable substrate activation or inhibition (Graber et al., 2013). Serine phosphorylation of mTOR marks its activated state (Graber et al., 2013; Copp et al., 2009), but its specificity for downstream targets is dictated by site-dependent phosphorylation. Ser-2448 phosphorylated mTOR binds to Raptor, resulting in mTORC1 kinase activation of p70S6K (Rosner et al., 2010), whereas Ser-2481 phosphorylation (Copp et al., 2009) promotes mTOR’s interaction with Rictor and activation of mTORC2 kinase (Copp et al., 2009; Chiang and Abraham, 2005). p70S6K phosphorylates and activates ribosomal protein S6 (RPS6) (Arif et al., 2019). Activated RPS6 has functional roles in regulating growth, neuronal activity, and synaptic plasticity (Biever et al., 2015). Therefore, the active (phosphorylated) forms of p70S6K and RPS6 reflect mTORC1 activation (Copp et al., 2009; Chiang and Abraham, 2005).
Insulin/IGF-1 activation of mTOR/mTORC1/2 has broad cellular effects that promote functions including growth, nutrient metabolism, proliferation, RNA translation (Lee, 2015), lipogenesis, and lipid storage (Yoon, 2017). The functional outcomes of mTORC1/2 stimulation promote mitochondrial function, re-organization of the actin cytoskeleton, cell motility, cell migration, and metabolism of lipids and proteins and reduce autophagy (Rosner et al., 2010; Bartolome et al., 2014). Within the nervous system, the regulatory effects of mTOR/mTORC1/2 mediate critical neuronal functions needed for cognition and behavior, including development, plasticity, and memory (Graber et al., 2013). Akt’s pivotal role in phosphorylating and activating mTORC2 (Rosner et al., 2008; Rosner et al., 2010) is needed to modulate cell growth, neuronal synaptic plasticity (Ishizuka et al., 2008), glial cell development, white matter and peripheral nerve myelination, and complex processes involved in cognition, behavior, and the establishment of memory (Bockaert and Marin, 2015; Lee, 2015).
In AD, there is now strong evidence that metabolic dysregulation linked to impairments in CNS signaling through insulin/IGF-1 pathways needed to drive PI3K-Akt, mimic the molecular and biochemical pathologies described for diabetes mellitus and similar insulin-resistance disease states (Akhtar and Sah, 2020). Impairments in mTOR signaling, as downstream mediators of neurodegeneration (Akhtar and Sah, 2020; Hoeffer and Klann, 2010; de la Monte et al., 2017), have been implicated based on the corresponding deficits in energy metabolism, mitochondrial function, cell growth and survival, synaptic plasticity, and dysregulated autophagy. Correspondingly, in human brains with AD and experimental models with AD-type neurodegeneration, mTORC1 and mTORC2, their related enzymatic activities (Lee et al., 2017), and their downstream targets (de la Monte et al., 2017) are all inhibited. Eukaryotic factors of initiation (EIFs) utilize ds RNA-dependent protein kinase (PKR), which shuts down protein synthesis and is up-regulated in AD human and experimental models. Under those conditions in AD cellular and animal models, mTOR’s regulatory effects on translation are down-regulated (Morel et al., 2009). In contrast, short-term in vitro models of AD exhibit mTORC1 inhibition of autophagy and de novo protein synthesis (Lee et al., 2017) suggesting the outcomes of mTORC signaling are modulated by disease duration and pathogenic factors.
This study characterizes insulin/IGF-1 receptor-Akt-mTOR-mTORC1/2 signaling networks in an established experimental model of sporadic AD. The model was generated by intracerebroventricular injection of streptozotocin (ic-STZ) which produces cognitive and motor deficits with brain atrophy and increased expression of AD biomarkers (Lester-Coll et al., 2006; Salkovic-Petrisic et al., 2006; de la Monte et al., 2017; Moreira-Silva et al., 2019; Tong et al., 2016a). We anticipated that the new information generated would increase understanding of how long-term impairments in insulin and/or IGF-activated pathways contribute to the diverse neuropathological processes that occur in AD and possibly uncover endogenous adaptive processes that support remaining functions despite chronicity of neurodegeneration.
2 Materials and methods 2.1 MaterialsStreptozotocin (STZ) was purchased from MilliporeSigma (Burlington, MA, USA). Table 1 lists the epitope-specific commercial primary antibodies used in duplex enzyme-linked immunosorbent assays (ELISAs), along with the antibody Research Resource Identifier (RRID) numbers, vendor sources, and experimental conditions. ThermoFisher Scientific (Bedford, MA, USA) was the commercial source for the Bicinchoninic acid (BCA) reagents, ELISA plates (MaxiSorp 96-well), secondary horseradish peroxidase (HRP)-conjugated antibodies, and blocking solution (Superblock TBS) for masking non-specific binding sites. The soluble fluorophores, Amplex Ultra Red and 4-methylumbelliferyl phosphate (4-MUP), were purchased from Life Technologies (Carlsbad, CA, USA). Vector Laboratories Inc. (Newark, CA, USA) was the source for Protein Biotin Protein Labeling Kit and Alkaline Phosphatase-conjugated Streptavidin. The 5-Plex MILLIPLEX MAP Rat Cytokine and the 11-Plex MILLIPLEX MAP Akt/mTOR Total and Phosphoprotein Magnetic Bead Panels were purchased from Millipore (Burlington, MA, USA). All other experimental reagents were purchased from Sigma-Aldrich Co. (St. Louis, MO, USA), Calbiochem/Millipore Sigma (Burlington, MA, USA), and Pierce Chemical (Dallas, TX, USA).
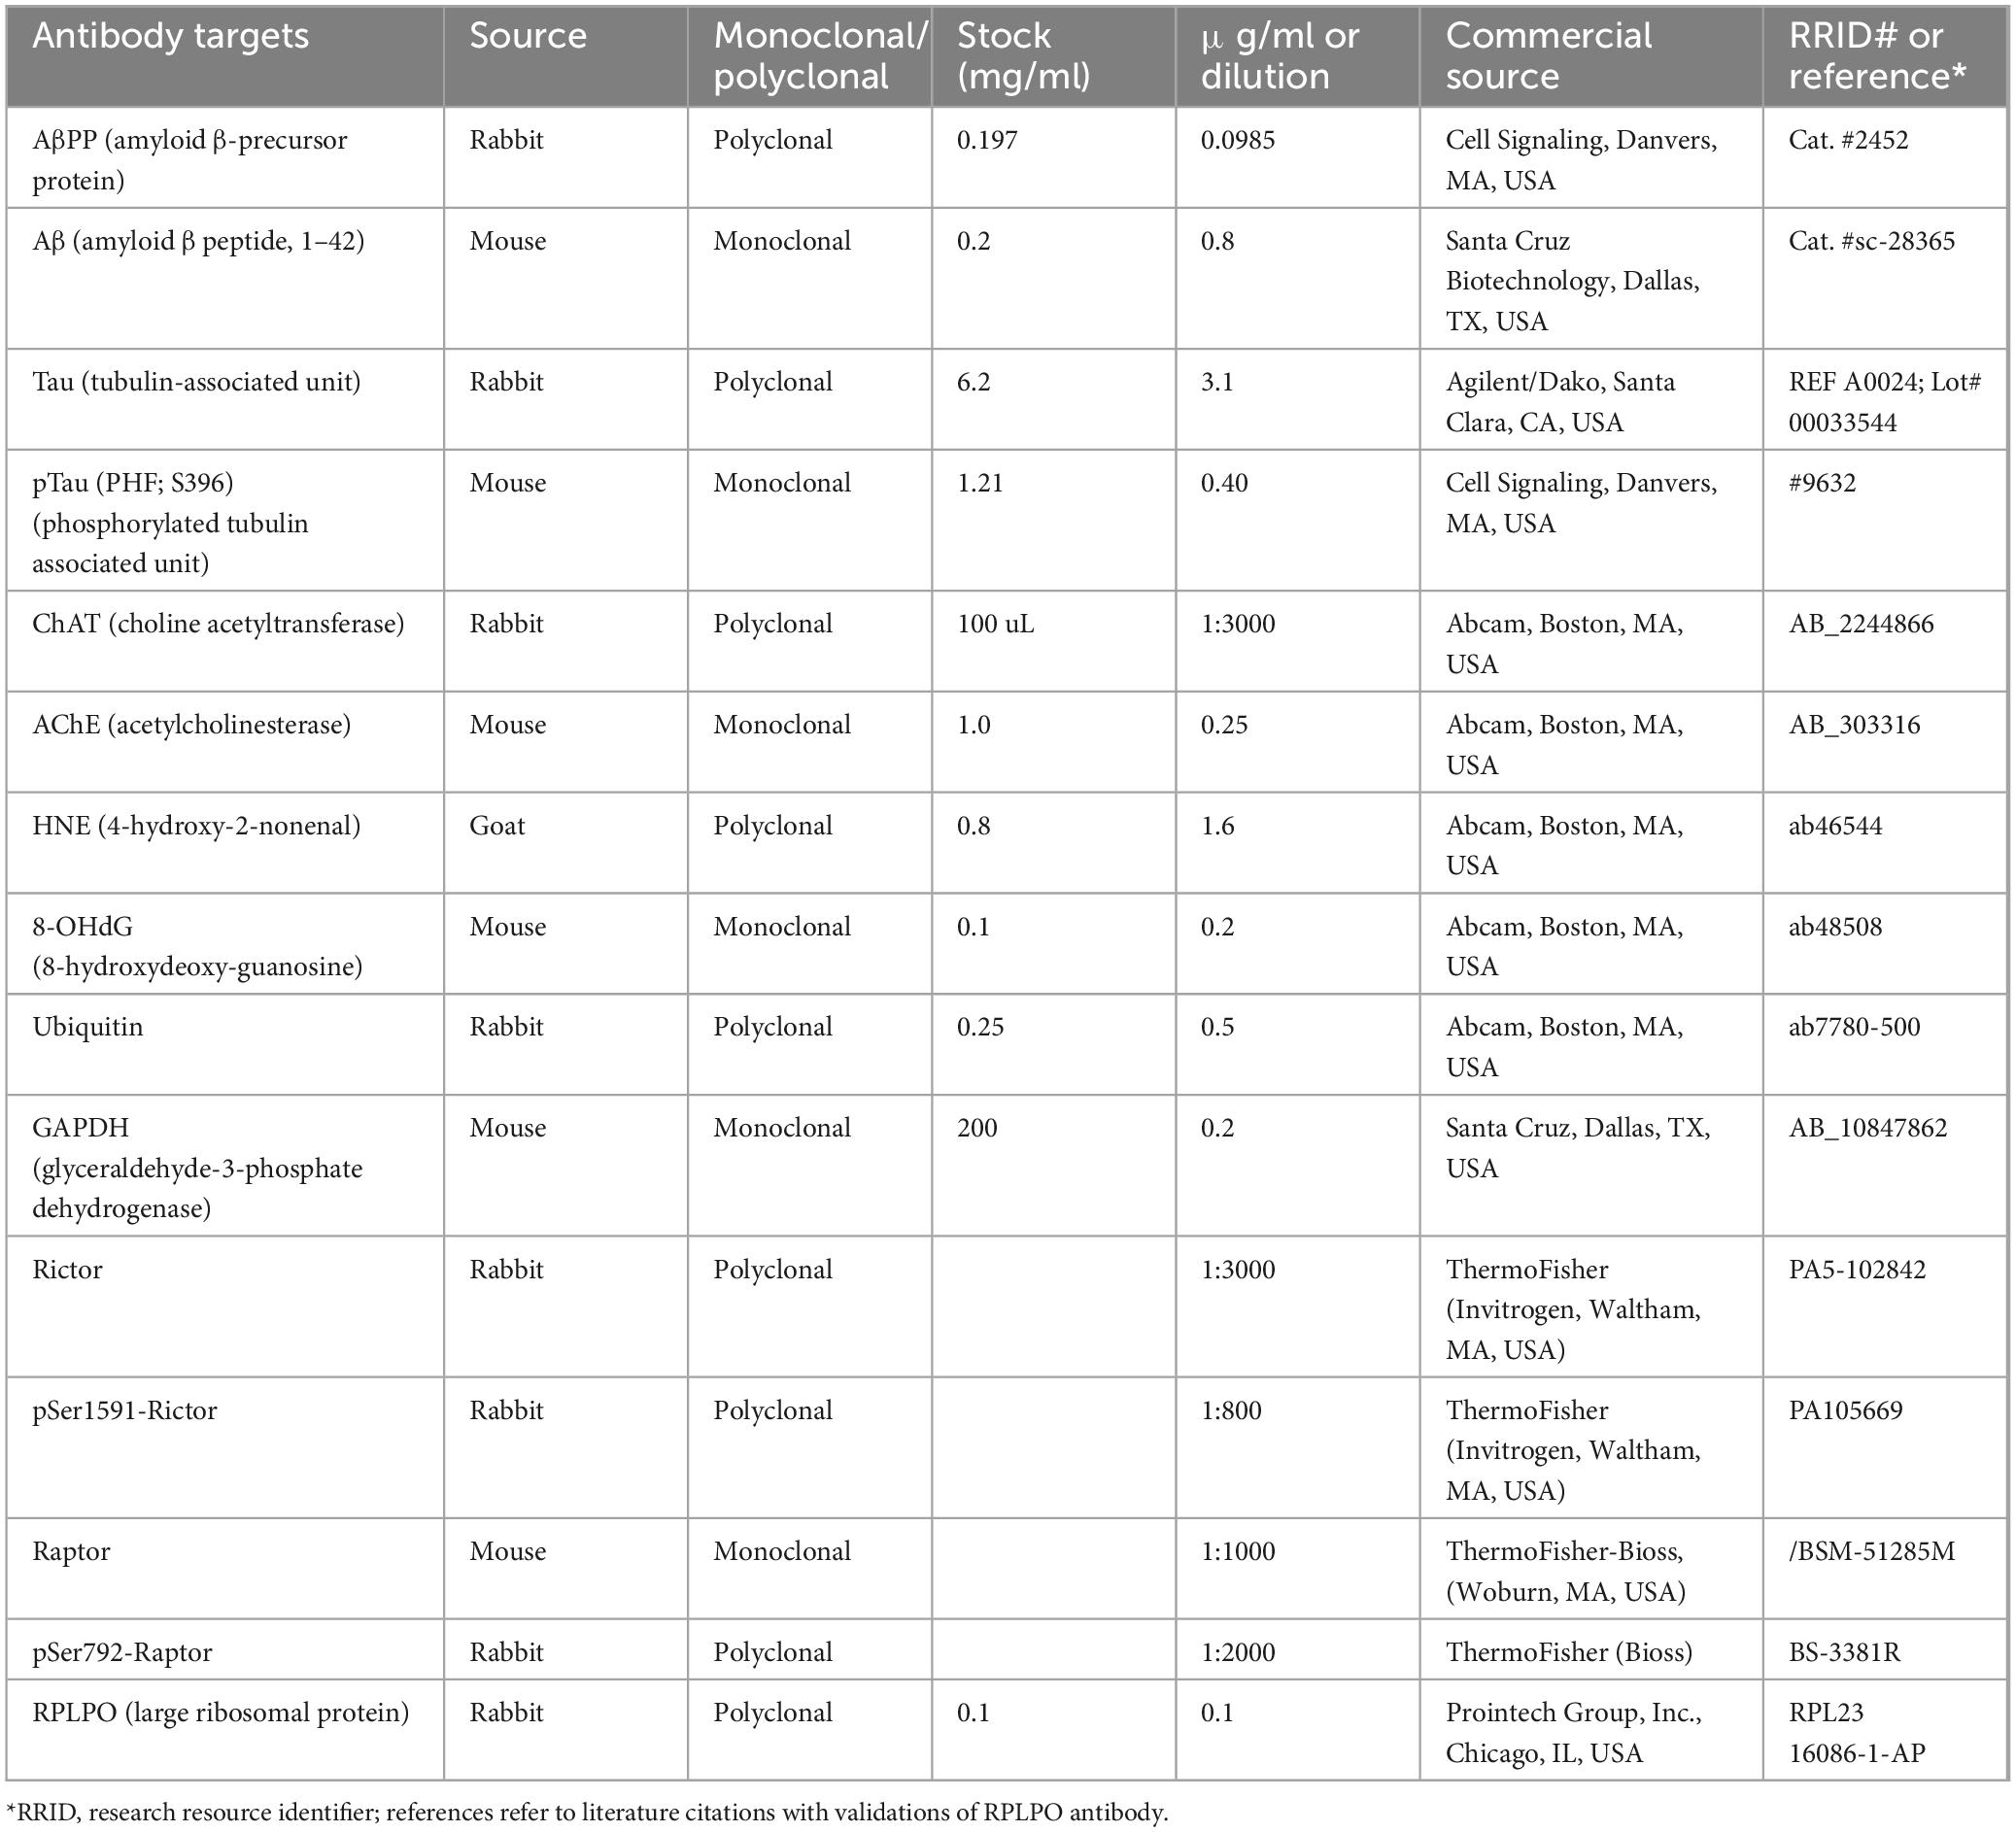
Table 1. Commercial antibodies and sources.
2.2 Model for in vivo experimentsLong Evans postnatal day 3 (P3) rat pups from Charles River Laboratories (Wilmington, MA, USA) were administered STZ (0.8 mg/kg) or saline (control) by intracerebroventricular (ic) injection as previously reported (Hoyer, 1998; Lester-Coll et al., 2006; de la Monte et al., 2017). On P17, the rats were rotarod tested with 10 progressive speed (2 to 10 rpm) trials in which the latencies to fall were recorded with an automated photocell (Rotamex-5, Columbus Instruments, Columbus, OH, USA). However, to prevent fatigue, the trials were terminated after 45 s and the rats were rested for 10 min between trials. The area-under-curve latencies-to-fall calculated based on the 10 rotarod testing speeds, were used for inter-group comparisons. Morris Water Maze (MWM) testing of spatial learning was performed from P24 through P27. Performance was tracked using Ethovision 8.5 (Noldus, Leesburg, VA, USA) as described (Lester-Coll et al., 2006). The latency tied to locating and landing on the hidden platform was the main performance index used for the inter-group comparisons. To avoid exercise fatigue, the maximum trial duration was capped at 120 s and the rats were rested for at least 5 min between trials. The calculated area-under-curve for recorded latencies over the 4 consecutive days of 3 daily trials per rat were used for inter-group comparisons. Previous studies demonstrated that ic-STZ does not significantly impact swimming speed and that performance differences were due to increased errors and path complexities (Tong et al., 2016b) (Supplementary Figure 1).
The rats were monitored daily for weight gain, feeding, behavior, and general health. The experiments were terminated using isoflurane. The freshly harvested temporal lobes were processed for subsequent analyses. For histopathologic studies, a coronal plane 3-mm slice through the cerebral hemispheres, including temporal lobes and infundibulum, was immersion-fixed in formalin and paraffin-embedded. Dewaxed, rehydrated histological sections (5 μm thick) were histochemically stained with Luxol fast blue, hematoxylin, and eosin (LHE) to reveal neuronal and glial cytomorphology and white matter fibers. The remaining unfixed temporal lobe (TL) tissue was rapidly frozen on dry ice and stored at −80°C. The analytical studies targeted the TL because the temporal cortex is a major target of AD neurodegeneration accompanied by expression of the signature biomarkers, neuroinflammation, and altered integrity of insulin/IGF signaling through the Akt-mTOR pathways (Longato et al., 2012).
The Institutional Animal Care and Use Committee (IACUC) at Lifespan Medical Center approved the use of rats in this research (Committee #500324; approved 02/29/2024). All procedures were done in accordance with guidelines published in the National Institutes of Health (NIH) Guide for the Care and Use of Laboratory Animals.
2.3 Tissue homogenization for biochemical studiesFresh frozen TL tissue samples (50 mg each) from 8 control (4 male and 4 female) and 11 ic-STZ (5 male and 6 female) rats per group were homogenized in weak lysis buffer [50 mM Tris (pH 7.5), 150 mM NaCl, 5 mM EDTA (pH8.0), 50 mM NaF, 0.1% Triton X-100] containing protease inhibitor cocktail (1 mM PMSF, 0.1 TPCK, 2 μg/ml pepstatin A, 1 μg/ml leupeptin, 1 mM NaF, 1 mM Na4P2O7) and 10 mM Na3VO4 as a phosphatase inhibitor. A TissueLyser II instrument (Qiagen, Germantown, MD, USA) equipped with 5 mm stainless steel beads was used for tissue homogenization. After centrifuging the samples at 14,000 × g for 15 min at 4°C, the supernatants were collected for storage at −80°C and later used in immunoassays. Aliquots were used to measure protein concentration with the BCA.
2.4 Duplex ELISADuplex ELISAs measured immunoreactivity to Tau (tubulin associated unit), pTau (phospho tau-NFT), amyloid-β-precursor protein (AβPP), the Aβ 1-42 cleavage fragment of AβPP (Aβ), choline acetyltransferase (ChAT), acetylcholinesterase (AChE), glucose-6-phosphate dehydrogenase (GAPDH), ubiquitin (UBQ), 4-hydroxynonenal (4-HNE), 8-hydroxy-2′-deoxyguanosine (8-OHdG), rapamycin-insensitive companion of mammalian target of rapamycin (Rictor), phospho-Rictor (p Ser1591Rictor), regulatory-associated protein of mTOR (Raptor), and phospho-Raptor (p Ser792Raptor). In brief, triplicate 50ng protein aliquots in 50 μl bicarbonate binding buffer were adsorbed to the bottom surfaces of ELISA plates (96-well) at 4°C overnight. Non-specific sites were masked with Superblock (TBS). Primary antibodies (0.2–5.0 μg/mL) were incubated overnight at 4°C with platform rotation. Species-specific horseradish peroxidase (HRP)-conjugated secondary antibodies and Amplex UltraRed soluble fluorophore detected immunoreactivity. Fluorescence intensity was measured in a SpectraMax M5 microplate reader (Ex530nm/Em590nm). Large ribosomal protein (RPLPO) served as a loading control (Longato et al., 2012; Tong et al., 2017; de la Monte et al., 2023a). RPLPO was detected in the same samples with biotinylated antibody, streptavidin-conjugated alkaline phosphatase, and 4-MUP fluorophore (Ex360 nm/Em450 nm). Relative levels of immunoreactivity derived from the calculated ratios of target protein to RPLPO immunoreactivities were used for intergroup statistical comparisons.
2.5 Multiplex ELISAsThe mTOR signaling pathway was evaluated with 11-Plex MILLIPLEX Akt/mTOR Total and Phosphoprotein Magnetic Bead Kits (MilliporeSigma, Burlington, MA, USA) (Table 2). Neuroinflammatory responses were examined using the 5-plex MILLIPLEX MAP Rat Cytokine/Chemokine Magnetic Bead Panel that included antibodies to interleukin-1β (IL-1β), IL-2, IL-6, Interferon-gamma (IFN-γ), and tumor necrosis factor-alpha (TNF-α). Multiplex ELISAs were performed according to the manufacturer’s protocol. However, the reactions were optimized by using 12.5 μg protein/sample in the 11-Plex Akt/mTOR assays and 150 μg protein/sample for the 5-plex Cytokine/Chemokine ELISA. Following incubation with antibody-bound beads, immunoreactivity in the captured antigens was detected with biotinylated secondary antibodies and phycoerythrin-conjugated streptavidin and measured in a MAGPIX with xPONENT software. Standard curves were generated for each analyte.
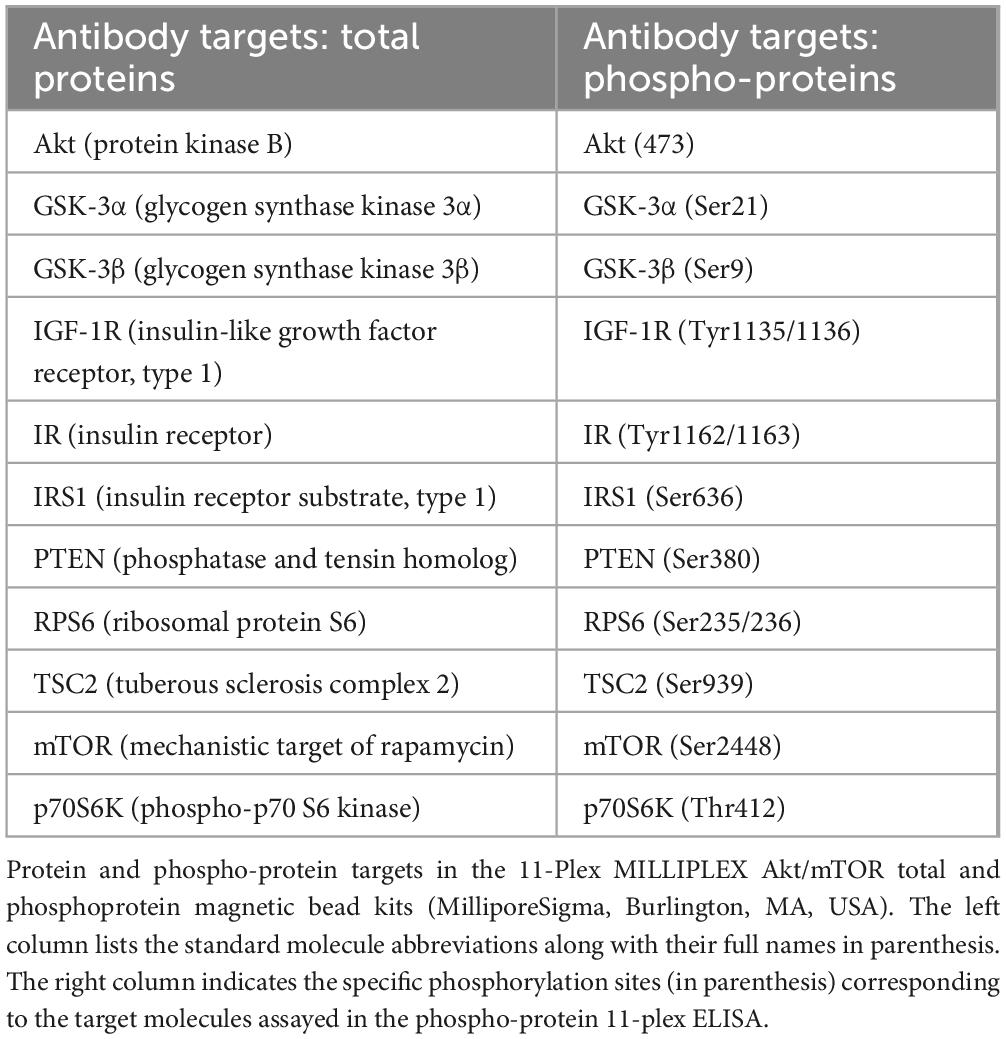
Table 2. Commercial multiplex ELISA platforms.
2.6 Statistical analysesAll experiments and assays included 8–10 rats per group. Biochemical and molecular assays were performed in triplicate and repeated twice. The samples were coded for blind assay performance and analysis. Statistical analyses of ic-STZ effects were performed, and graphs were generated with GraphPad Prism 10.2 software (Boston, MA, USA). Area-under-curve analysis determined the effects of ic-STZ on Rotarod and Morris Water Maze test performance. Student t-tests with corrections for multiple comparisons assessed the effects of ic-STZ on temporal lobe expression of AD biomarkers, stress molecules, cytokines, and Akt-mTOR pathway molecules. Boxplots depict the means (horizontal bars), 95% confidence interval limits (upper and lower box boundaries), and range (upper and lower stems). Software generated statistically significant (p ≤ 0.05) and trend-wise (0.05 < p < 0.10) differences are displayed within the graph panels. The “trend-wise p-values” are noted only as potentially bordering on significance. However, they are nonsignificant (Nead et al., 2018) and therefore must be regarded with caution.
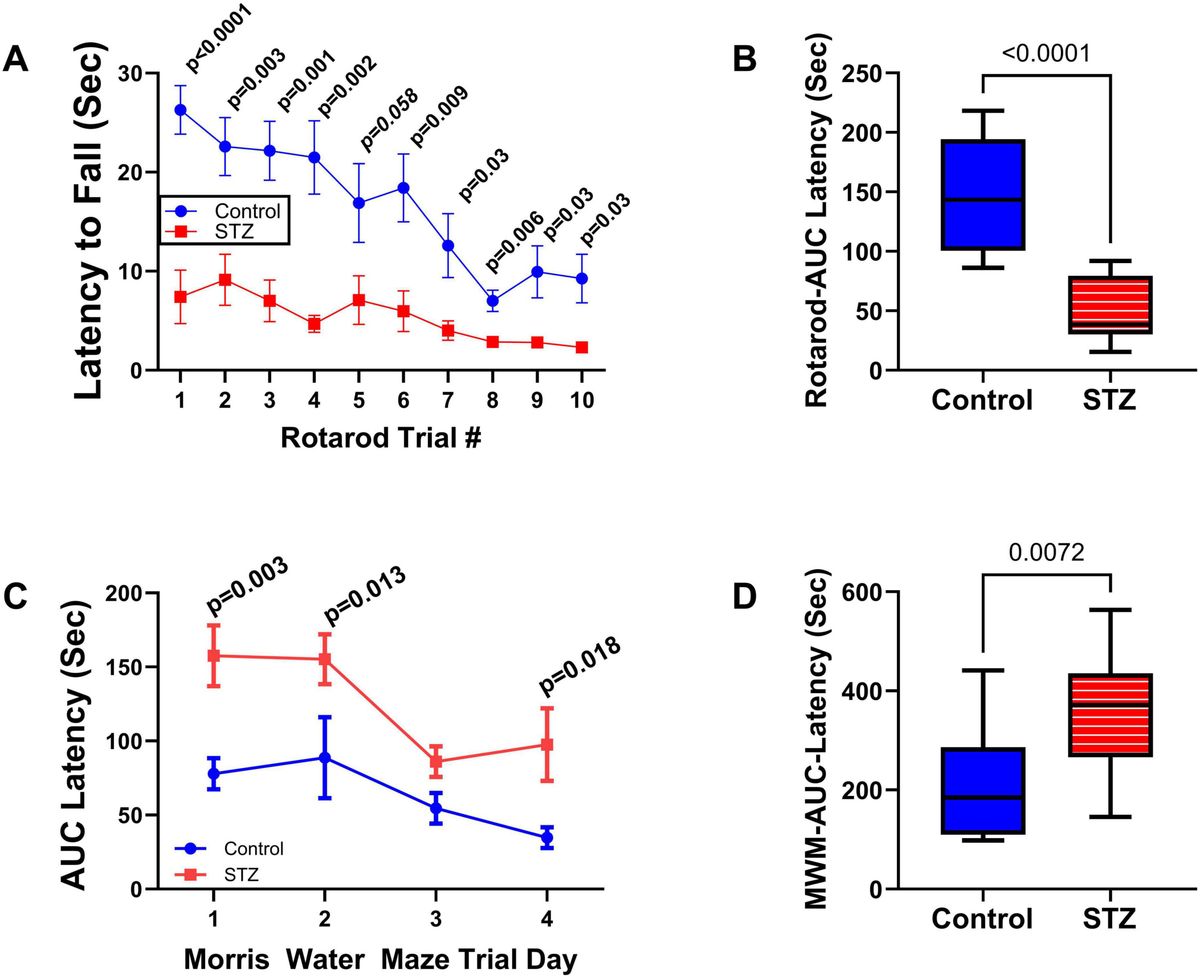
3 ResultsNeurobehavioral tests: In previous studies, we conducted neurobehavioral rotarod and Morris water maze (MWM) tests to evaluate motor and spatial learning and memory impairments in the ic-STZ model (Tong et al., 2016a; Tong et al., 2016b). Correspondingly, in the present study, the ic-STZ treatments significantly impaired performance on both the rotarod and MWM tests (Figure 1). Concerning the rotarod test, the ic-STZ-treated rats exhibited significantly shorter mean latencies to fall from the rotating rod in all 10 trials (Figure 1A). Area-under-curve analysis demonstrated significantly worse overall performance due to the nearly 60% reduction in the mean latency-to-fall in the ic-STZ-treated group (Figure 1B). On all 4 MWM trial days, the mean AUC latency to locate and land on the platform was longer for the ic-STZ treated rats, with significant differences from controls on Trial Days 1, 2, and 4 (Figure 1C). In addition, the overall mean AUC latency was significantly greater for the ic-STZ group (p = 0.0072) (Figure 1D). There were no significant male versus female within-group differences in rotarod or MWM test performances. The observed ic-STZ impairments in rotarod and MWM performance correspond with previous observations in this model (Tong et al., 2016a).
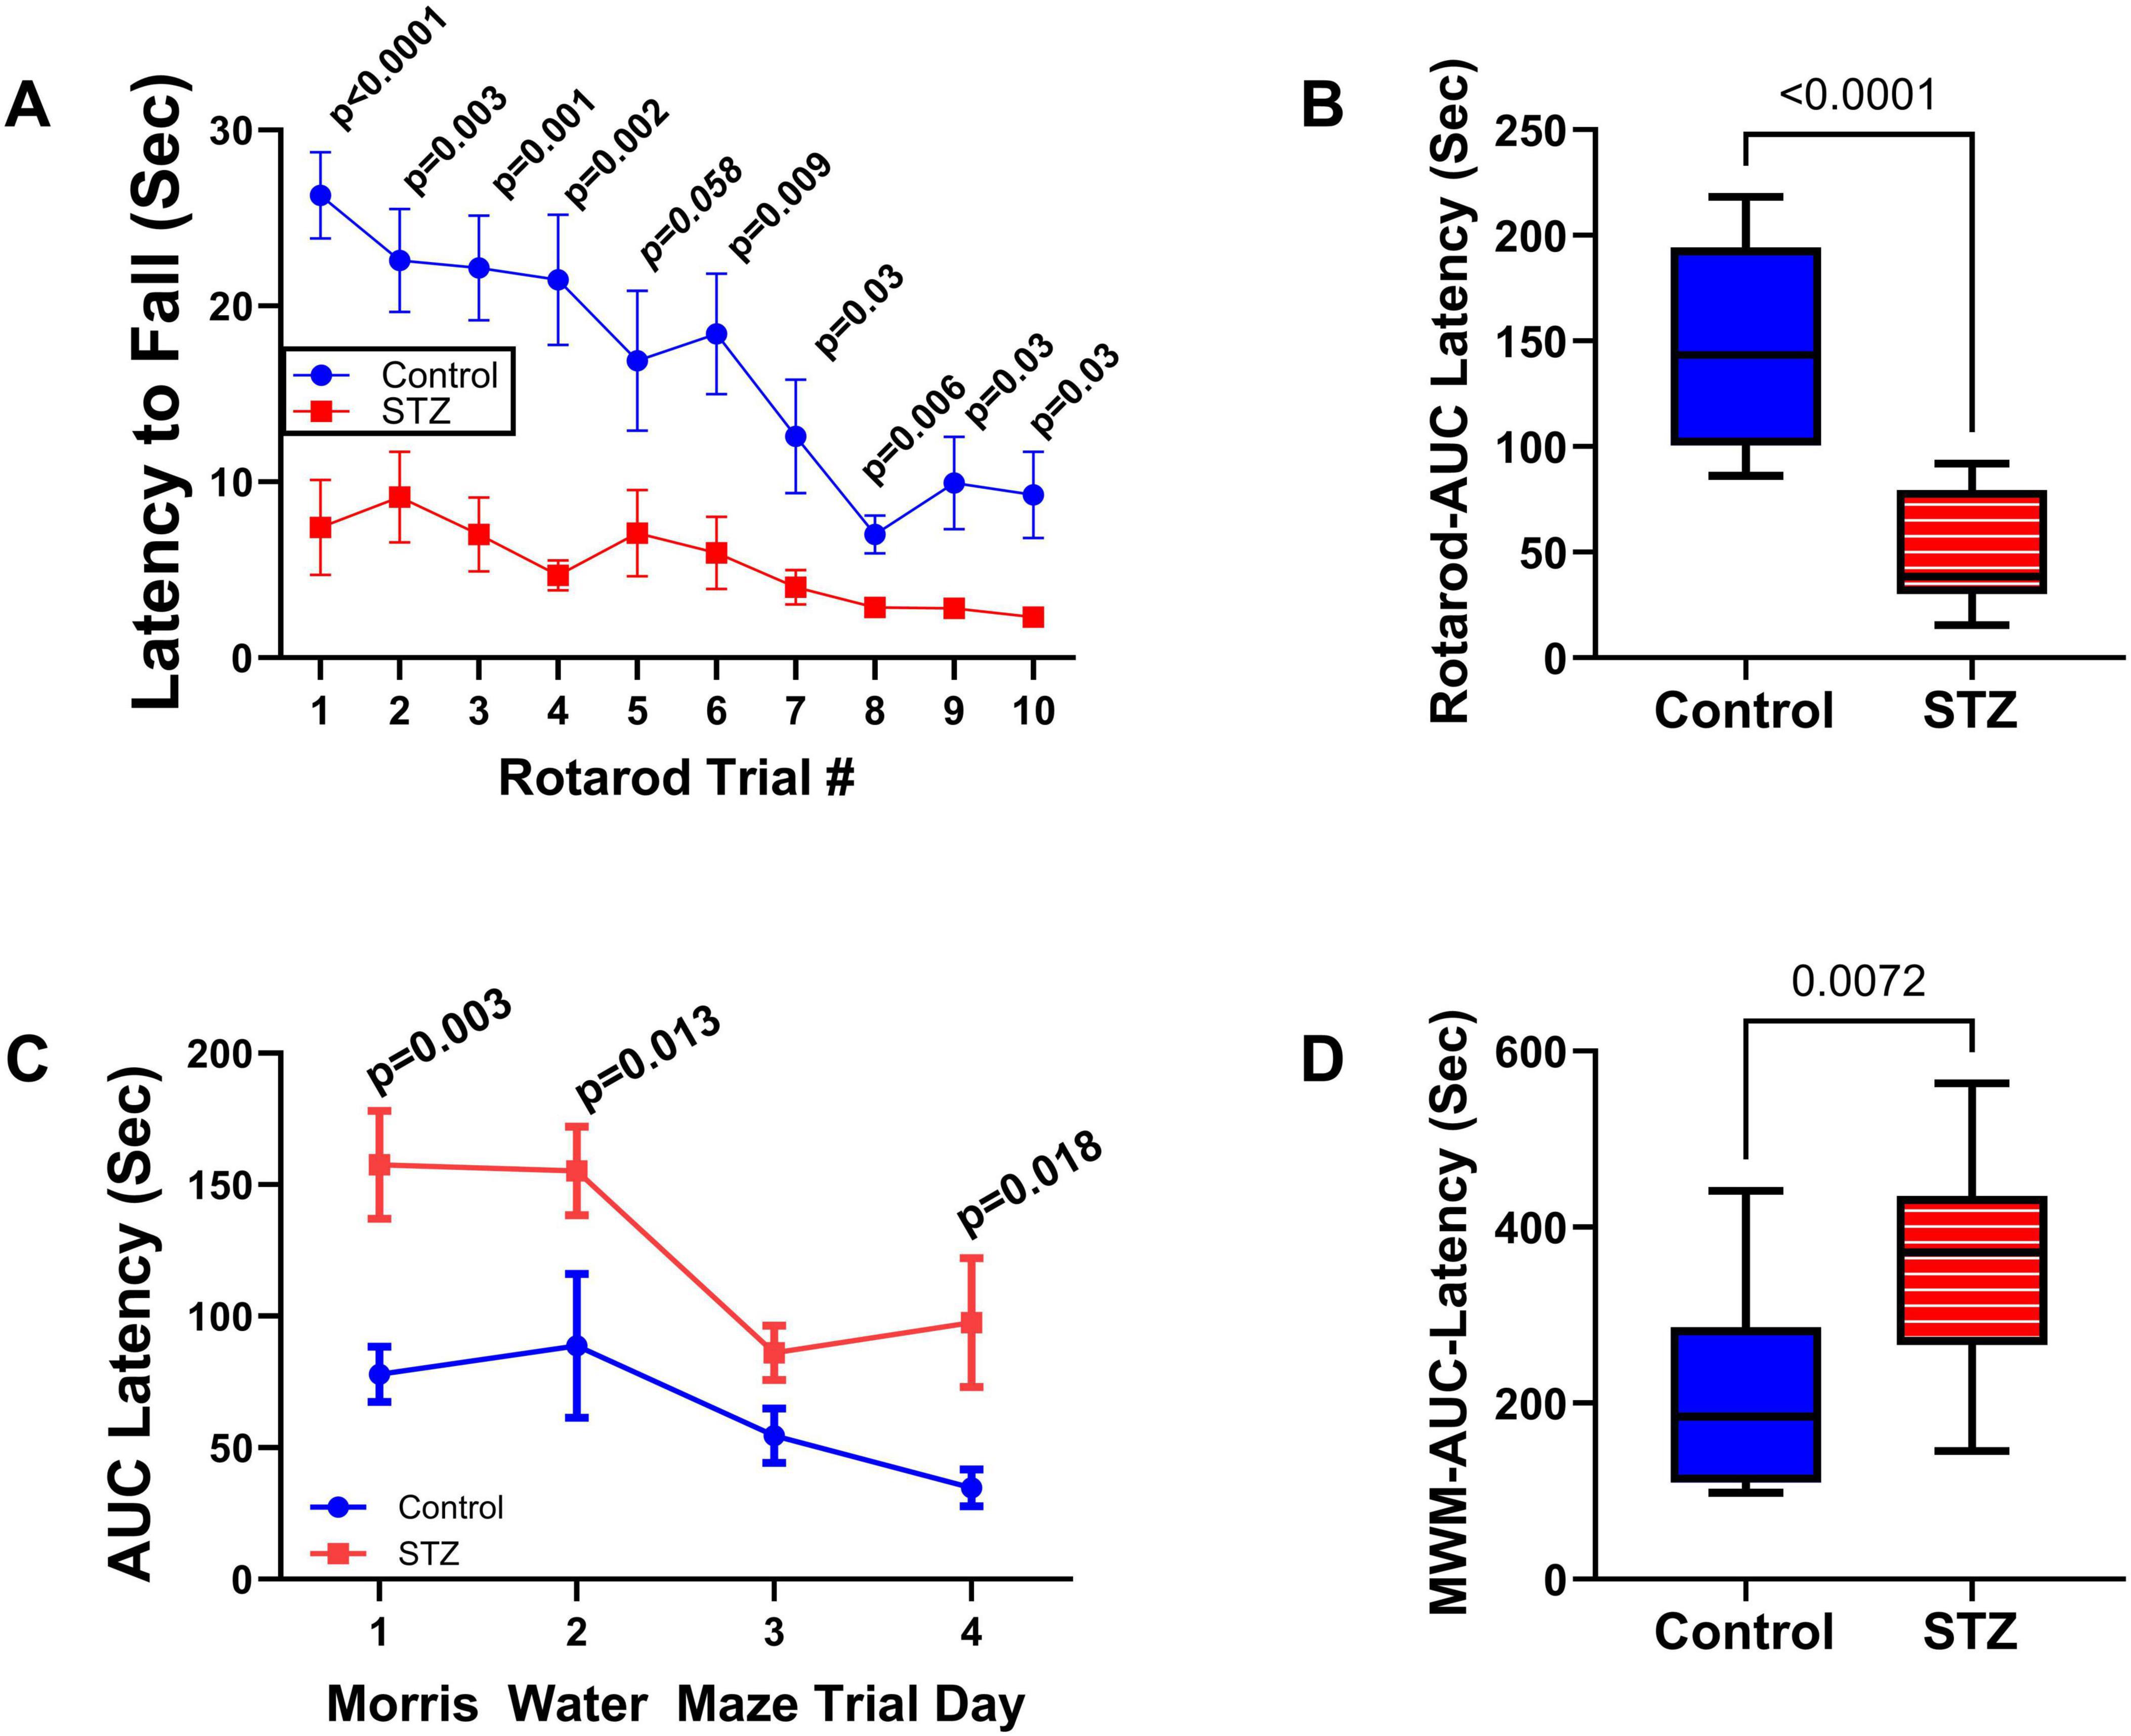
Figure 1. Functional neurobehavioral impairments caused by ic-STZ. Control (n = 8) and ic-STZ-treated (n = 11) Long Evans rats were subjected to rotarod and Morris water maze (MWM) tests. For rotarod tests, the rats were administered 10 consecutive trials of progressively increasing speed. The latency-to-fall was recorded automatically. (A) The graph depicts the mean (± SD) latencies per trial. Results were analyzed by two-way ANOVA with post-hoc Tukey tests. (B) Area-under-curve (AUC) was calculated over the 10 trials for each rat. The inter-group comparison was made by t-test. (C) Morris water maze results correspond to the latencies required for the rats to reach and land on the platform. The AUCs were calculated based on the 3 daily trials. Each inter-group Trial Day performance (mean ± SD of the AUC) was compared by t-test. (D) The AUCs calculated for performance over the 4 trial days per rat were compared to reflect the overall effects of ic-STZ on spatial learning and memory.
Effects of ic-STZ on body, brain, and liver weights, and blood glucose: Through P27, rats in the control and ic-STZ groups had similar body weights and exhibited good health. At the time of rotarod testing, the mean (± SD) of body weight was 55 ± 2.96 for controls and 49.7 ± 8.09 for the ic-STZ group (Not significant by t-test analysis; p = 0.10). At the time of MWM testing, the mean (± SD) of body weight was 73.3 ± 4.96 for the control group and 68.3 ± 9.2 for the ic-STZ group (Not significant by t-test analysis; p = 0.18). However, subsequent responses to the ic-STZ treatments were manifested by significant alterations in the body, brain, and liver weights (Figure 2). Corresponding with the consequences of dysregulated metabolism, the mean body (Figure 2A) and liver (Figure 2C) weights were significantly increased, whereas brain weight was reduced (Figure 2B) by ic-STZ. In contrast, blood glucose was not significantly altered by ic-STZ (Figure 2D). These findings correspond with previous observations in this model (Lester-Coll et al., 2006; Tong et al., 2016b).
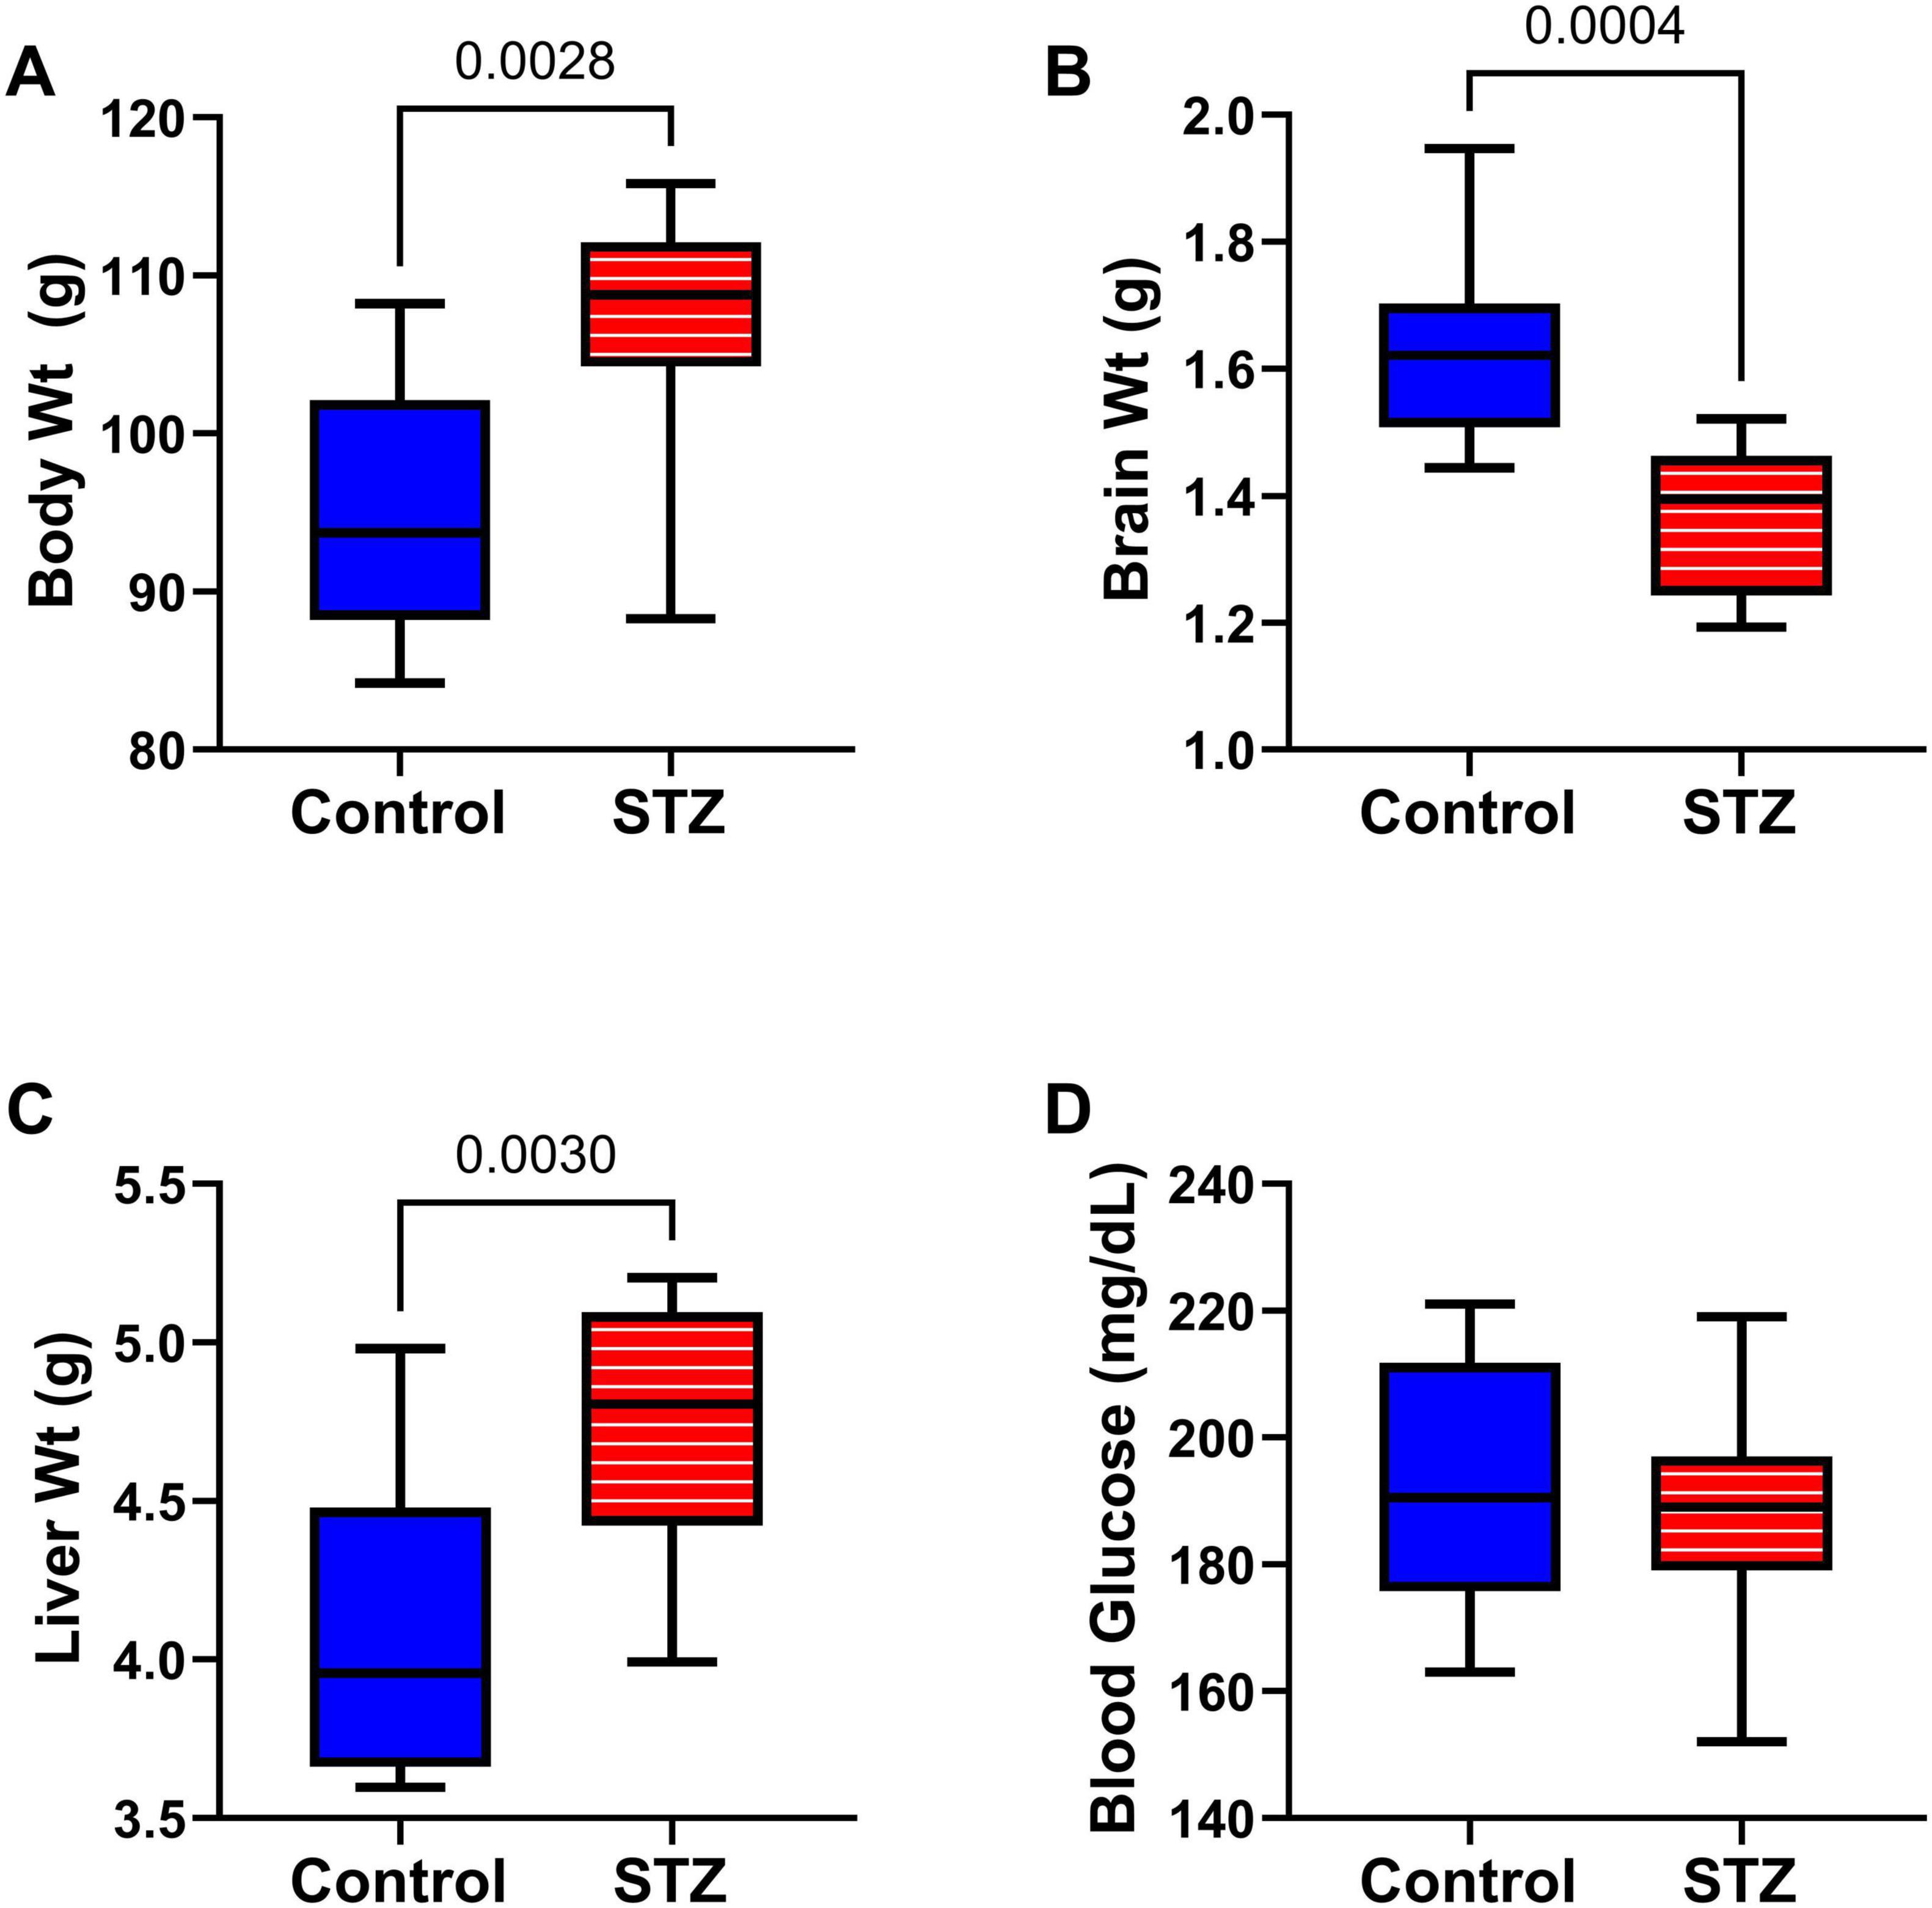
Figure 2. Alterations in body, brain, and liver weight following ic-STZ. Terminal (A) body, (B) brain, and (C) liver weights and (D) blood glucose levels were measured upon sacrifice on P30. Inter-group comparisons (n = 8 control and 11 ic-STZ samples/group) were made by repeated measures t-tests.
Neuropathological changes in the ic-STZ model: Paraffin-embedded histological sections of temporal lobe including the hippocampal formation demonstrated that ic-STZ caused atrophy (thinning) of the cortical ribbon with contraction of the neuropil rendering an appearance of increased cellular crowding. Cortical atrophy was accompanied by enlargement of the ventricle, and abundant neurons with shrinkage and condensation or apoptosis (Figures 3B, D, F). These appearances contrasted with the uniformly distributed round-to-oval neuronal nuclei with prominent nucleoli in the control temporal cortex (Figures 3A, C, E). Sections through the hippocampal formation, including Ammon’s horn and the overlying cortex, revealed an overall larger hippocampus and white matter with more conspicuous and intense Luxol Fast blue staining in control versus ic-STZ samples (Figures 4A, B). Higher magnification images of the CA1 hippocampal region revealed a uniform linear organization of intact neurons in controls (Figure 4C) and thinning with abundant hyperchromatic (darkened) shrunken neurons in the ic-STZ cases (Figure 4D). Pallor of white matter staining in the ic-STZ temporal lobes was associated with reduced intensity of Luxol fast blue staining, less abundant glial cells (mainly oligodendrocyte), and vacuolation of tissue reflecting fiber loss (Figure 4F) relative to the uniform blue staining with abundant glial nuclei and minimal vacuolation in control samples (Figure 4E).
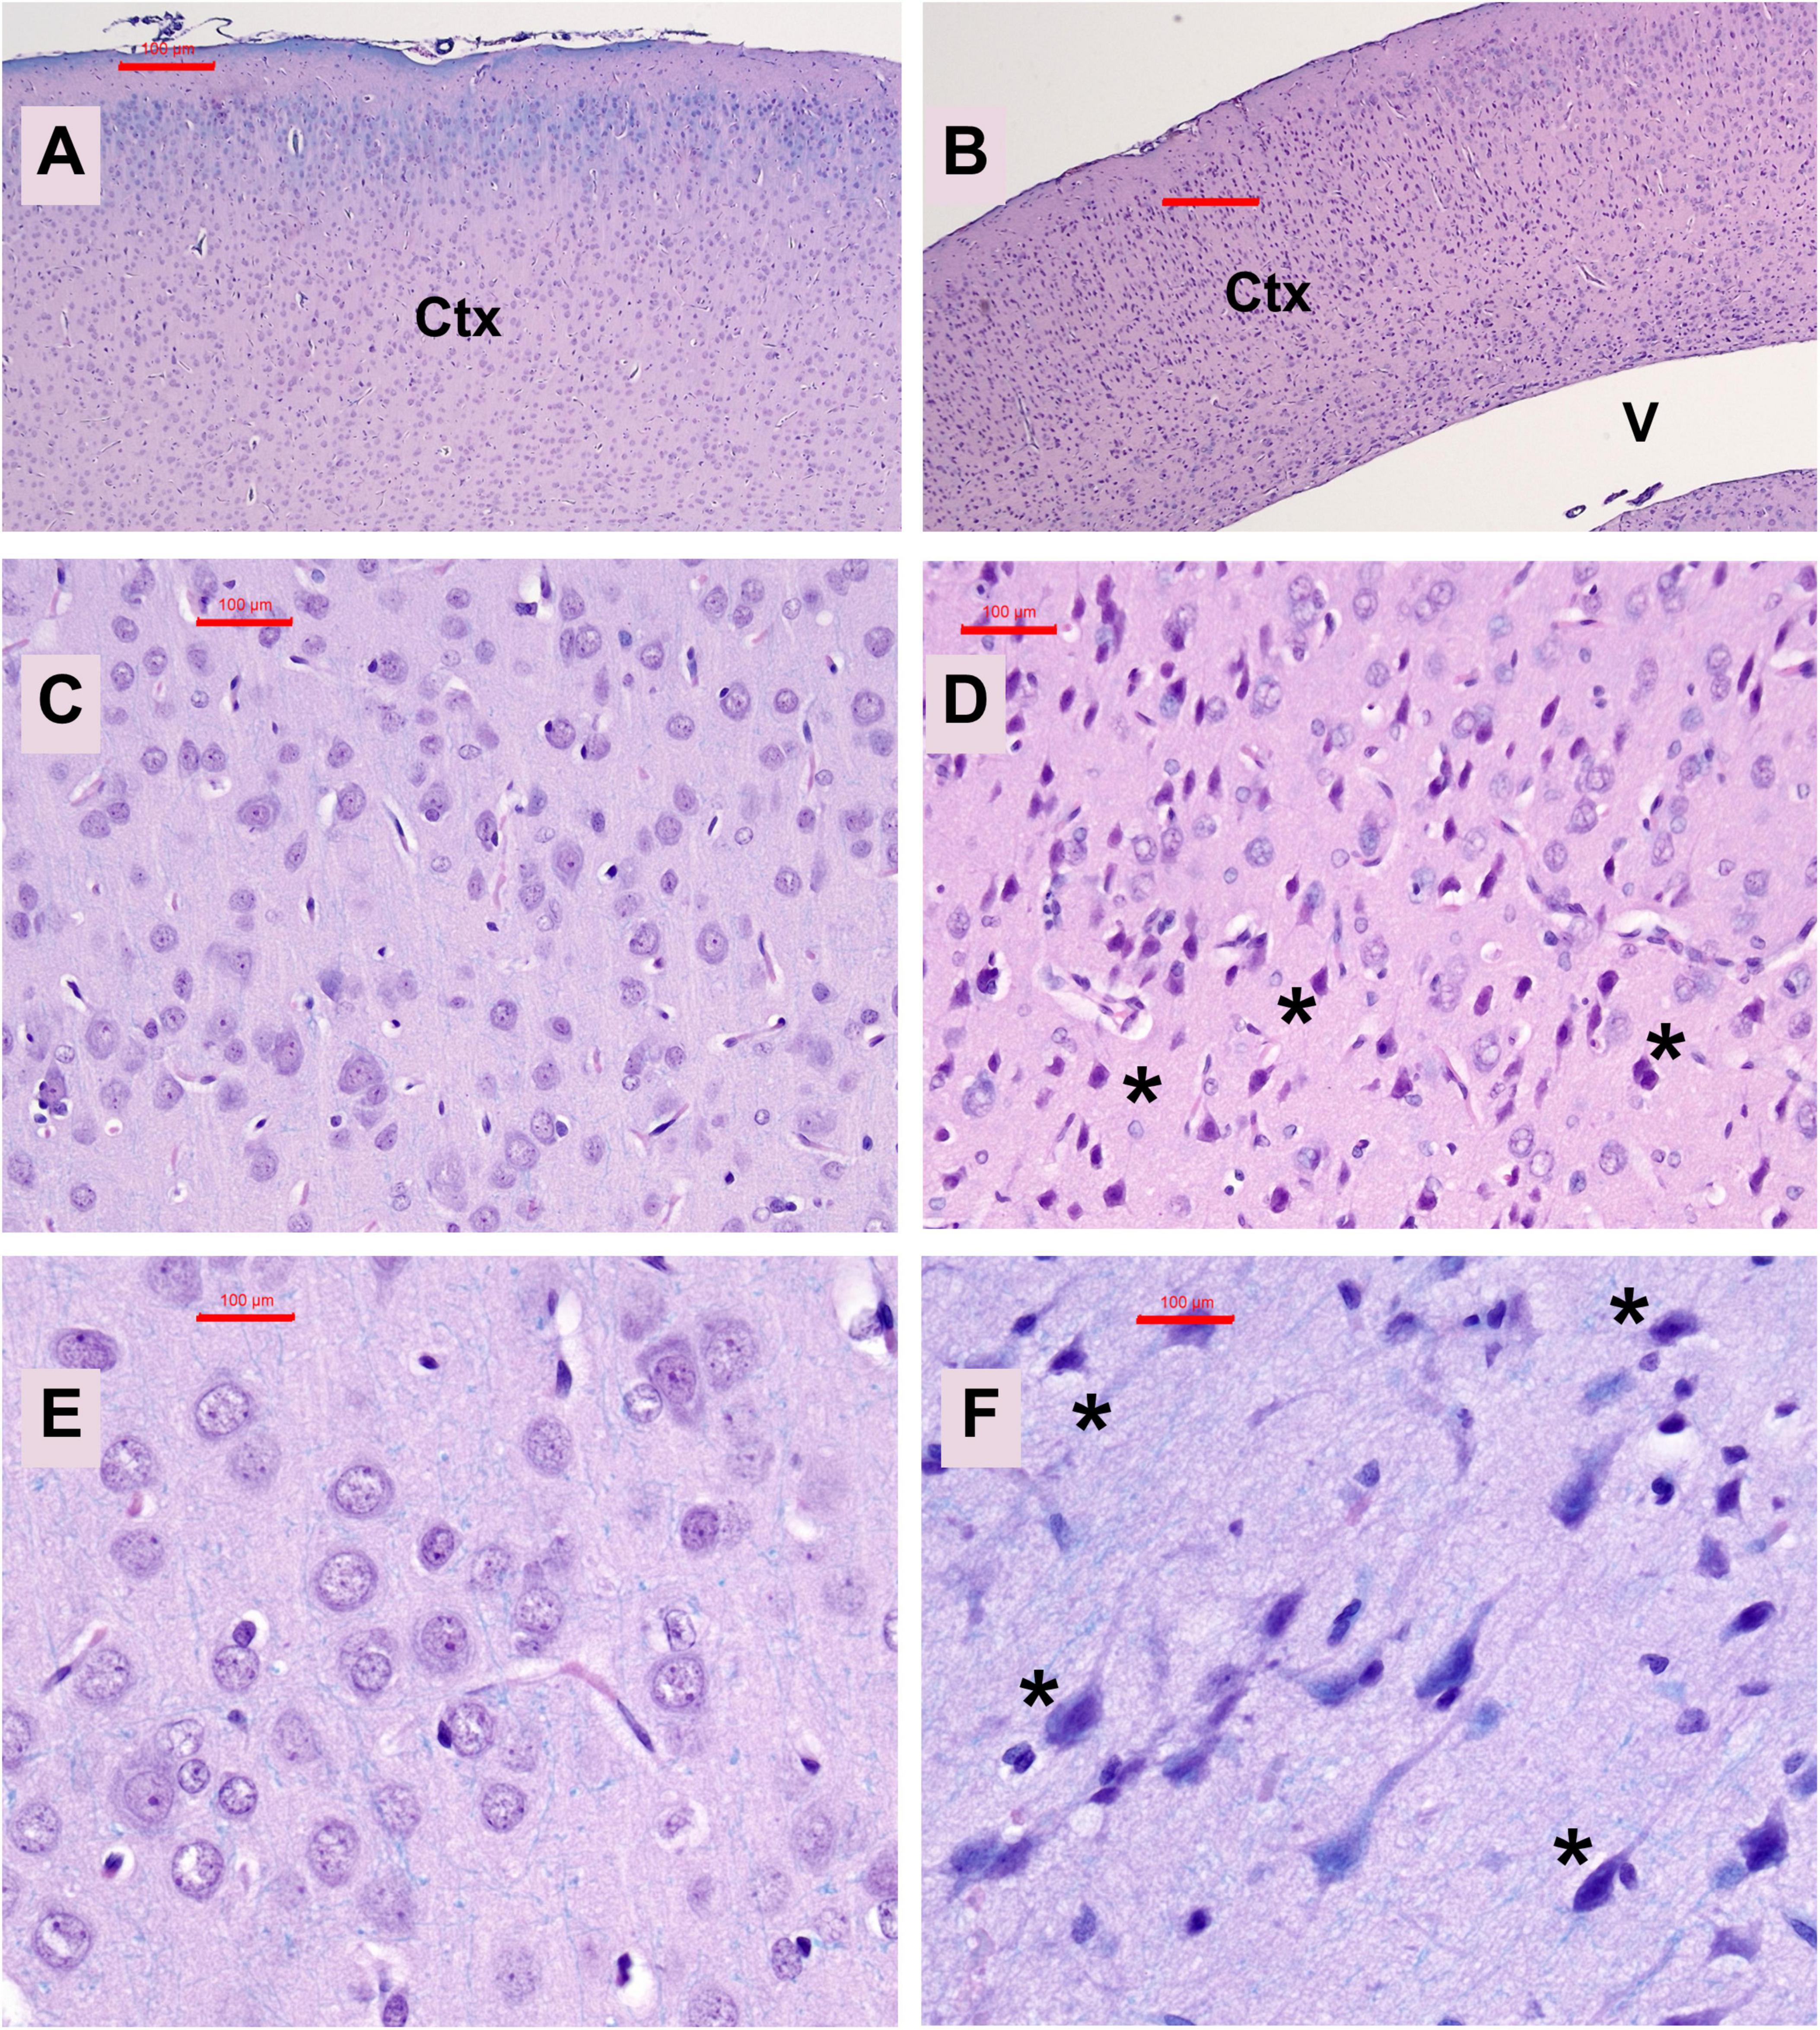
Figure 3. Temporal cortex pathology. Formalin-fixed, paraffin-embedded histological sections (5 μm thick) of the temporal lobe from control (A,C,E) and ic-STZ-treated (B,D,F) P30 rats were stained with Luxol fast blue, hematoxylin, and eosin (LHE). Note thinning of the cortex (Ctx) accompanied by enlargement of the lateral ventricle (V) in the ic-STZ low-magnification image (B) compared with a representative control (A) in which the ventricle is not visible due to the thickness of the cortex. Higher magnification images display numerous dark, pyknotic neurons [asterisks in (D,F)] compared with uniformly round to oval neuronal nuclei in the control brain (C,E). Original magnifications: A,B = 20×; C,D = 100×; E,F = 400×; Scale bars correspond to 100 μm.
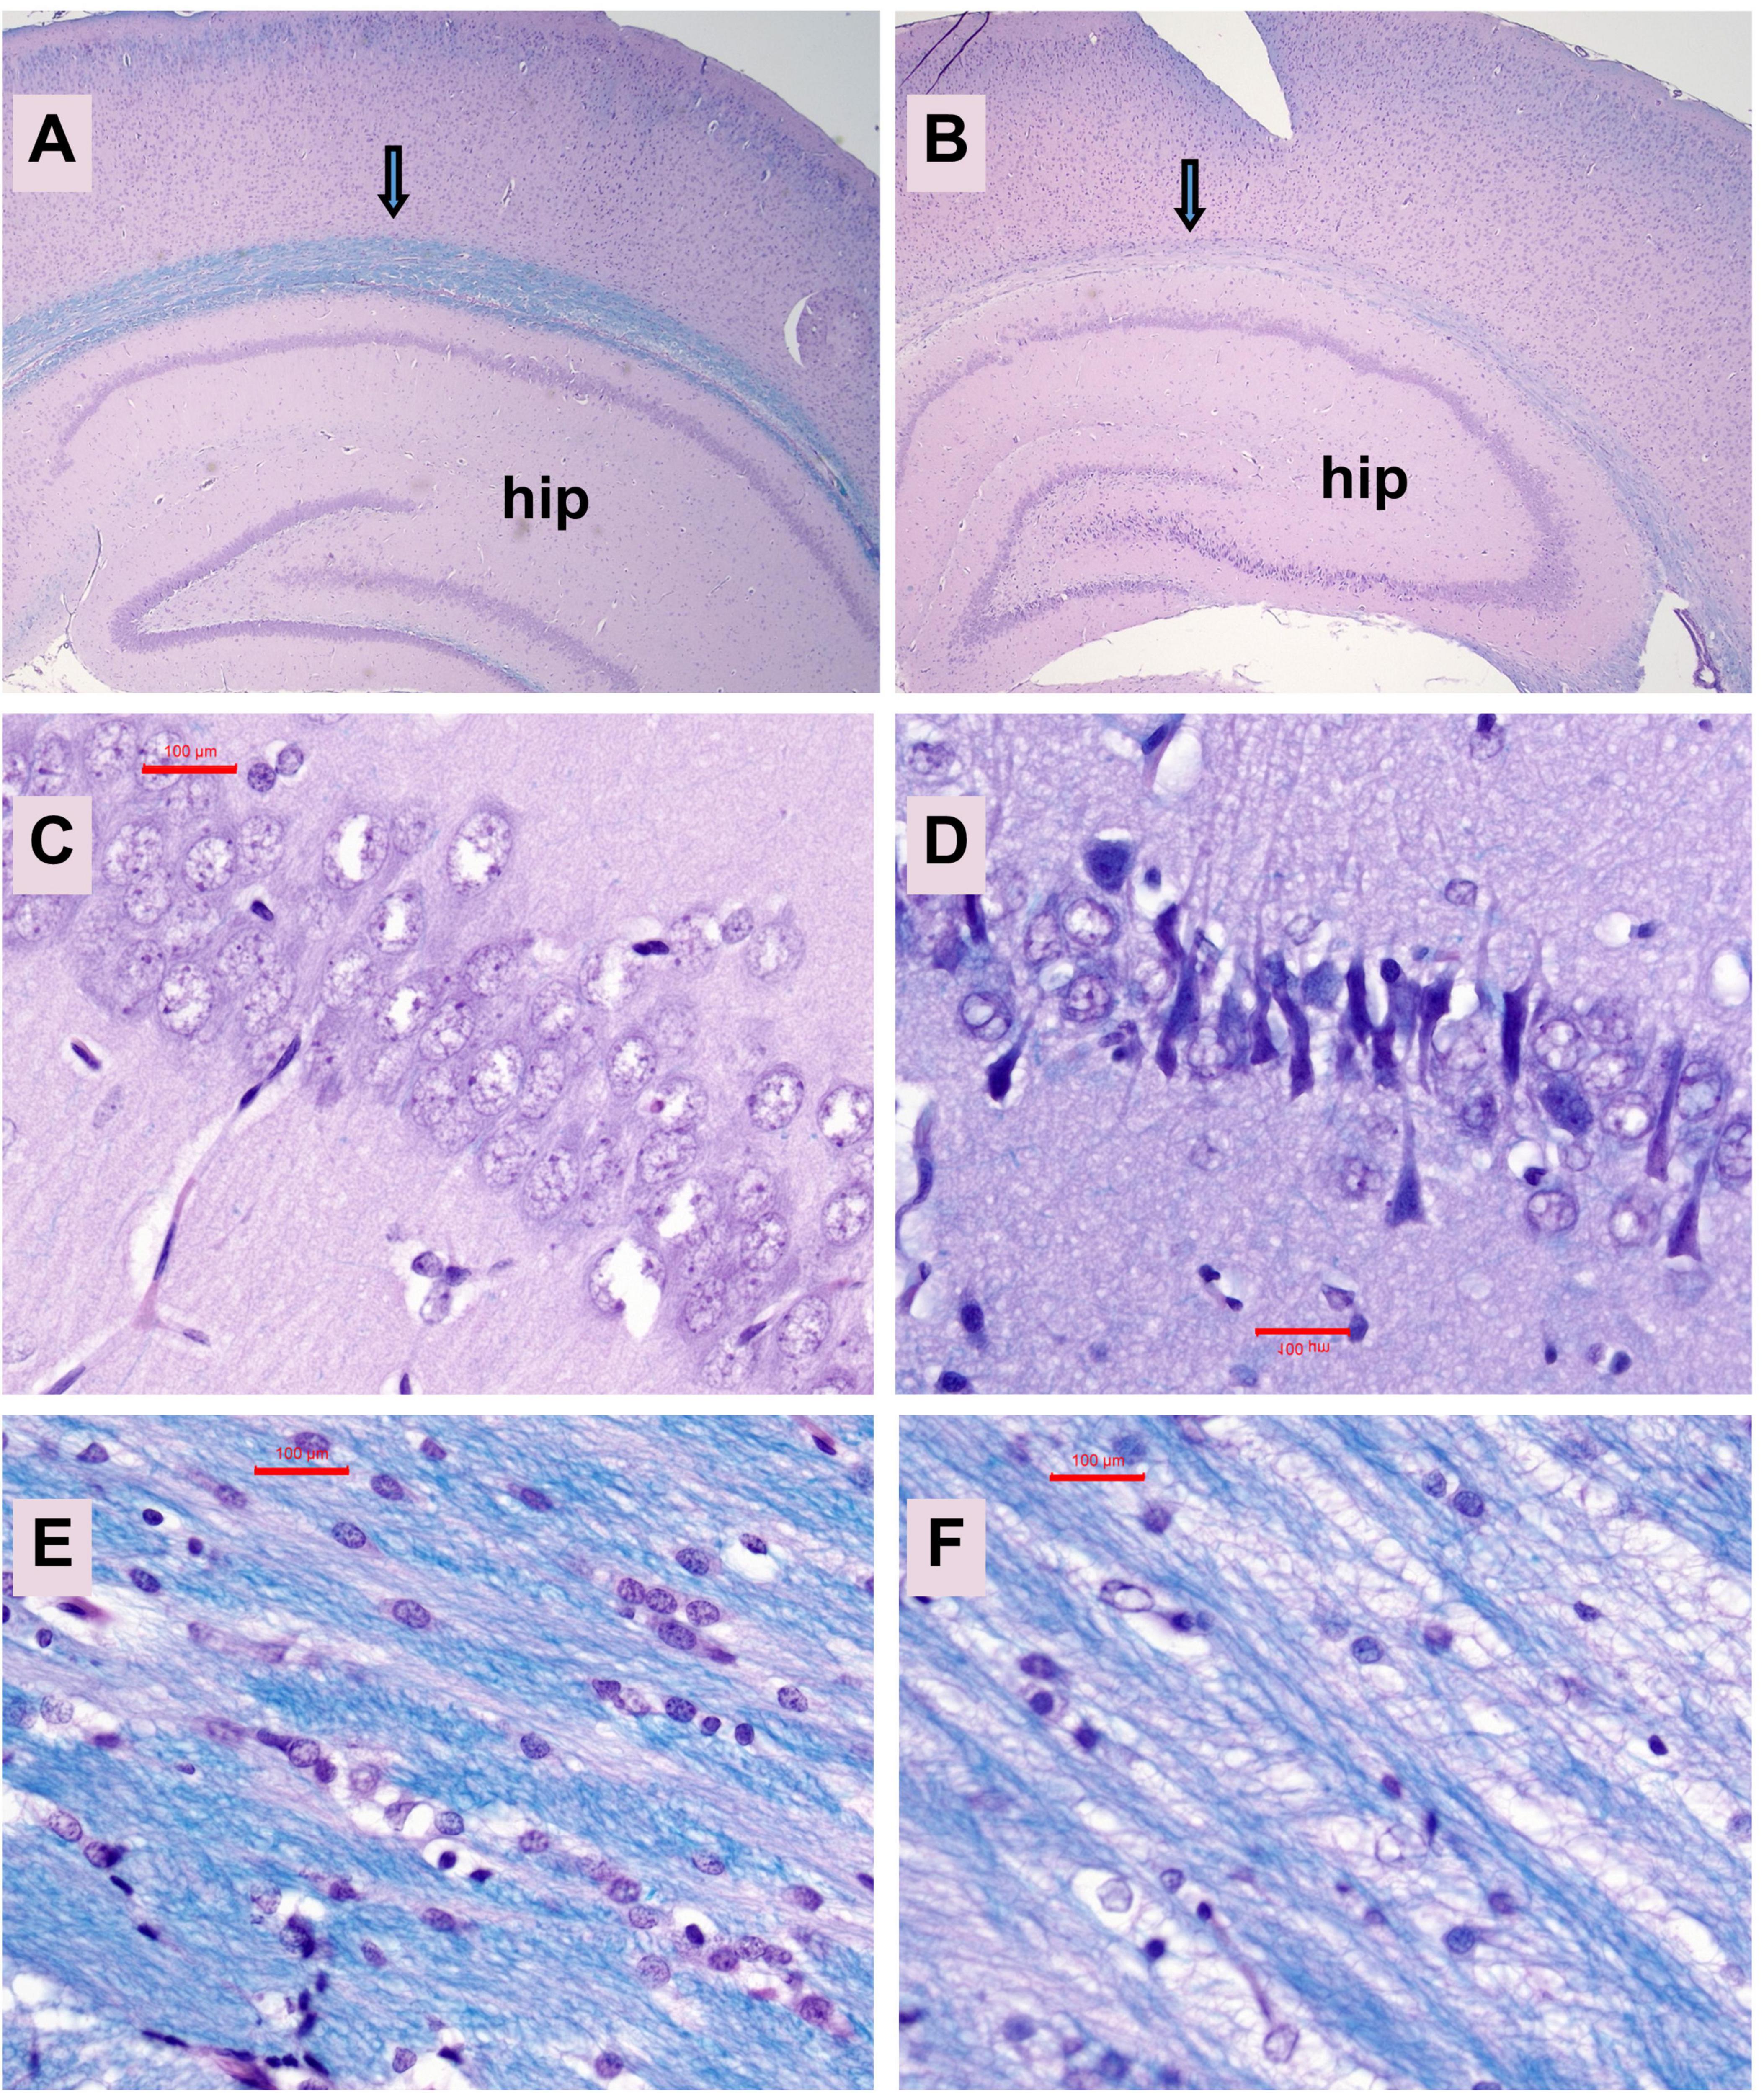
Figure 4. Hippocampal atrophy. Formalin-fixed, paraffin-embedded histological sections (5 μm thick) of the temporal lobe with hippocampal formation from control (A,C,E) and ic-STZ-treated (B,D,F) P30 rats were stained with LHE. Note the smaller size of the hippocampus (hip) and pallor of the white matter track (arrow) overlying the hippocampus in the ic-STZ case. (B,D) CA1 region of the hippocampus demonstrates striking neuronal degeneration (darkening and shrinkage of neurons and narrowing of the zone) in the (D) ic-STZ versus (C) control. (E,F) White matter pallor, cell loss and vacuolation in the ic-STZ compared with control. Note the lower density of nuclei (glial cells-oligodendrocytes) and bubbly white vacuolation of myelin corresponding to myelin and fiber loss due to ic-STZ. Original magnifications: A,B = 20×; C–F = 400×. Scale bars correspond to 100 μm.
AD Biomarkers: The effects of ic-STZ on temporal lobe expression of tau, pTau, AβPP, Aβ, ChAT, and AchE were evaluated by duplex ELISA in which target molecule immunoreactivity was normalized to RPLPO (Figure 5). In addition, the pTau/Tau ratios for each sample were calculated and analyzed statistically. The ic-STZ treatments resulted in significantly elevated levels of pTau (Figure 5B), pTau/Tau (Figure 5C), AβPP (Figure 5D), Aβ (Figure 5E), and AChE (Figure 5G) but not total Tau (Figure 5A) or ChAT (Figure 5F). Therefore, ic-STZ increased the expression of neurofibrillary tangle-related pTau, and both AβPP and its Aβ(1–42) cleavage product, corresponding with the findings in AD. In addition, the elevated levels of AChE relate to the known loss of cholinergic function in AD, as previously observed in this animal model (García-Ayllón et al., 2011).
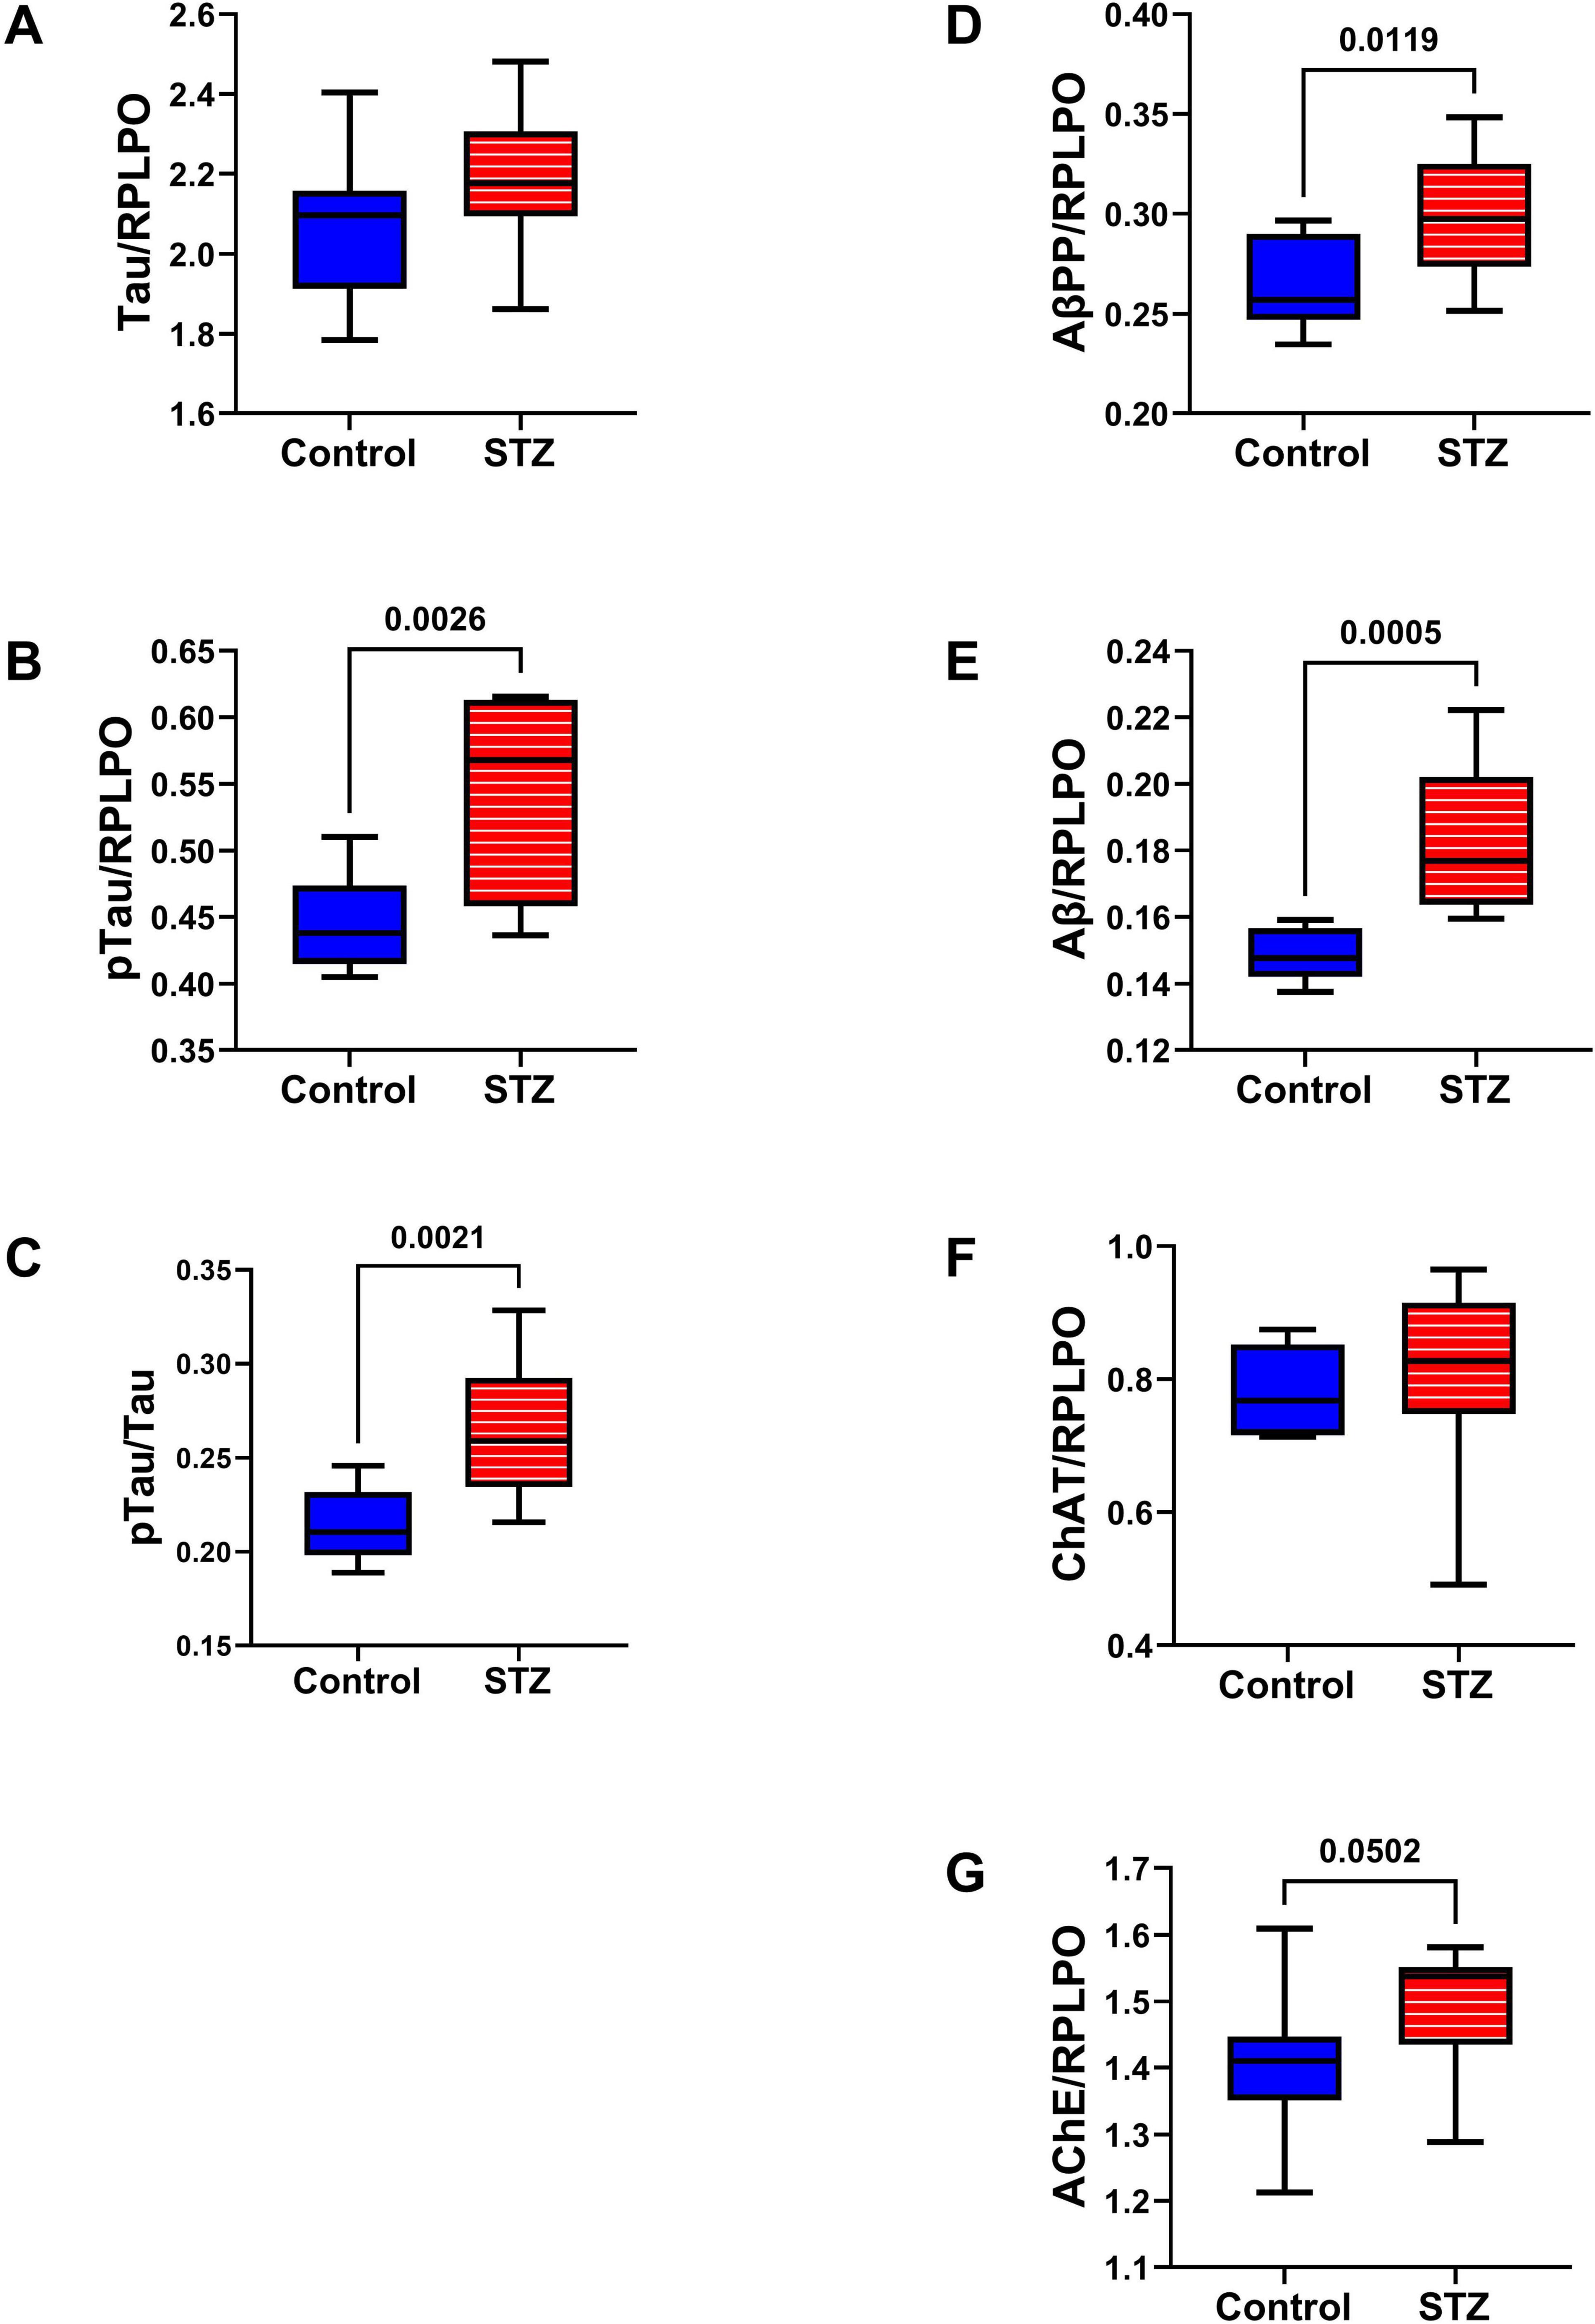
Figure 5. AD biomarker expression. Duplex ELISAs measured temporal lobe immunoreactivity to (A) Tau, (B) pTau (PHF), (C) pTau/Tau, (D) AβPP, (E) Aβ (F) ChAT, and (G) AChE with results normalized to RPLPO. The control group included 8 rats and the ic-STZ group included 11 rats. Inter-group statistical analyses were by repeated measures t-tests. Significant p-values (p ≤ 0.05) are displayed within the panels.
Oxidative Stress Molecules: Duplex ELISAs measured HNE (Figure 6A), 8-OHdG (Figure 6B), ubiquitin (Figure 6C), and GAPDH (Figure 6D) to assess long-term effects of ic-STZ on indices of oxidative stress (de la Monte et al., 2011; Tong et al., 2012). HNE, a marker of lipid peroxidation, was significantly increased in the ic-STZ brains (Figure 6A). The modest ic-STZ-associated elevation of 8-OHdG, a marker of DNA damage, did not reach statistical significance. Ubiquitin, which frequently binds to abnormally aggregated and misfolded proteins in AD and other neurodegenerative diseases (Amzallag and Hornstein, 2022; Behl et al., 2022; Tecalco-Cruz et al., 2022; Tokunaga and Ikeda, 2022), was significantly reduced following ic-STZ. However, extreme oxidative stress can inactivate the proteasome, inhibiting ubiquitination via reductions in newly formed ubiquitin conjugates (Shang and Taylor, 2011). GAPDH was significantly increased in ic-STZ-treated brains. Paradoxically, GAPDH expression in the brain was previously shown to be elevated under conditions of increased oxidative stress and neuronal damage (Hwang et al., 2007; Ou et al., 2010).
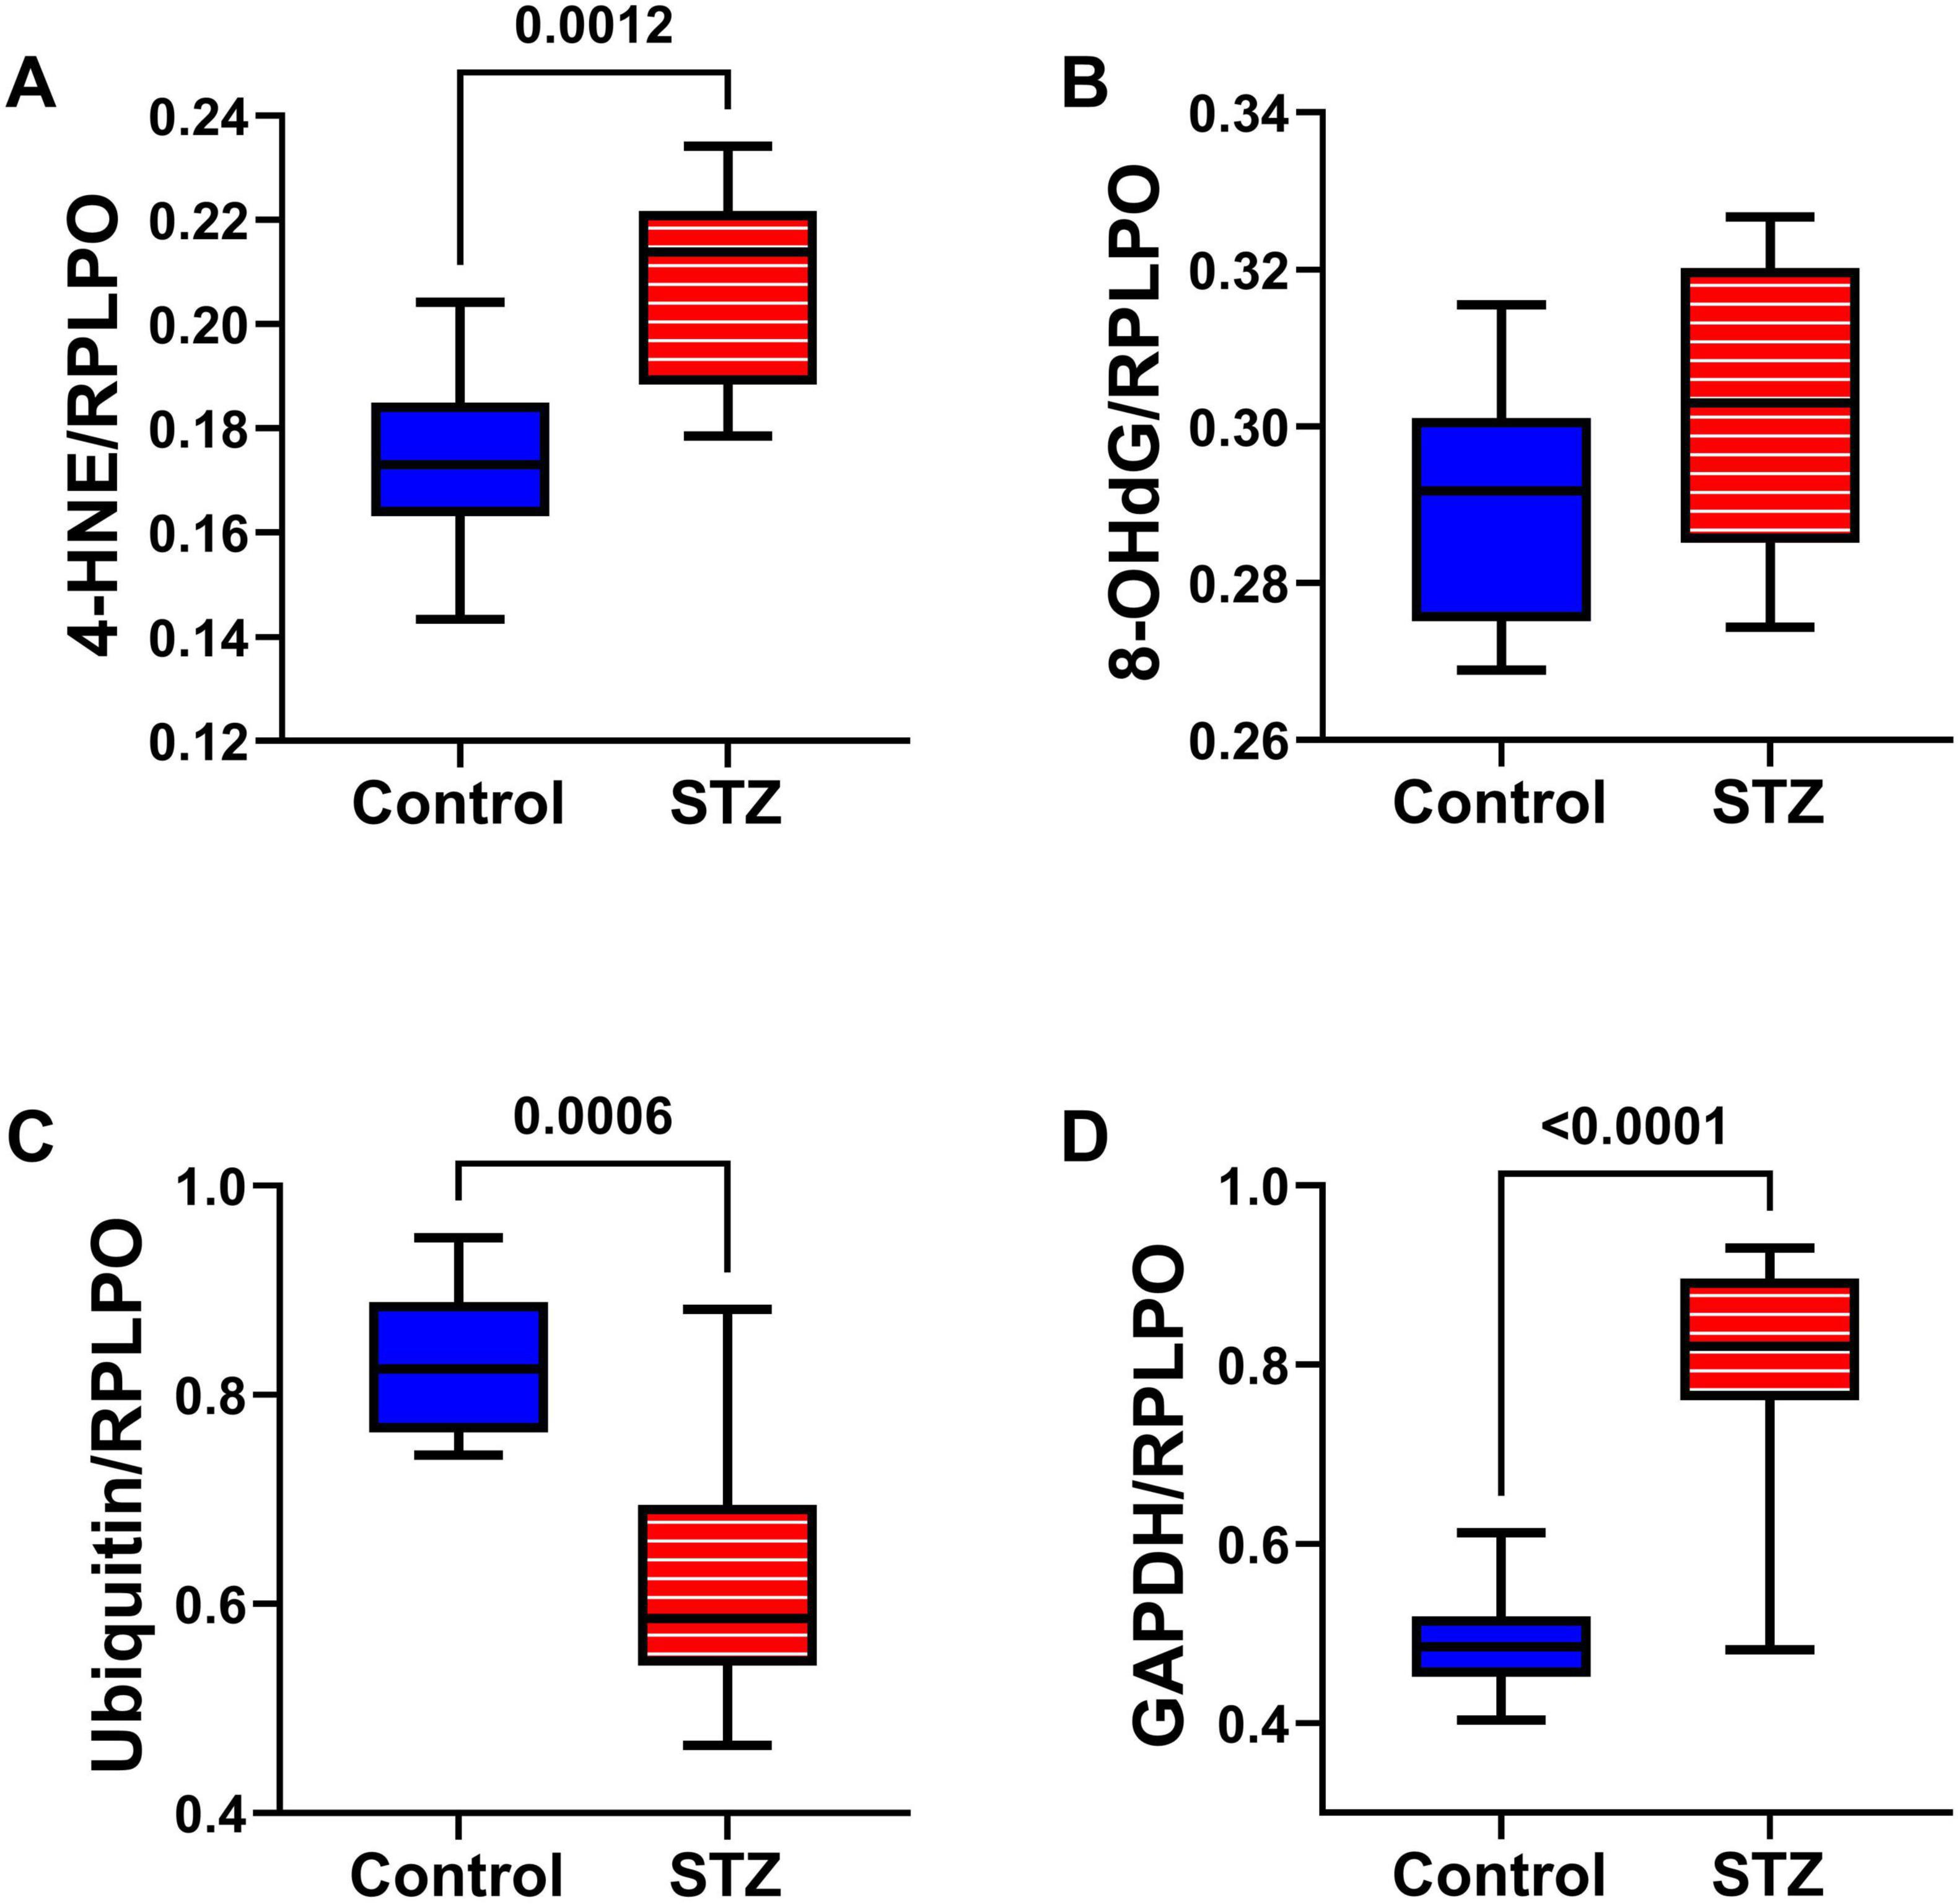
Figure 6. Oxidative stress markers. Temporal lobes from Long Evans rats treated with ic saline (Control, n = 8) or STZ (n = 11) were analyzed by duplex ELISA to measure (A) 4-HNE, (B) 8-OHdG, (C) Ubiquitin, and (D) GAPDH with results normalized by RPLPO. Inter-group comparisons were made by repeated measures t-tests. Significant differences (p ≤ 0.05) are displayed.
Inflammatory Cytokines Studies: A cytokine-focused multiplex ELISA measured TL levels of IL-1β, IL-2, IL-6, IFN-γ, and TNF-α (Figure 7). Although neuroinflammation is implicated in the pathogenesis of AD and other neurodegenerative diseases (Rubio-Perez and Morillas-Ruiz, 2012), this study demonstrated significant ic-STZ-associated reductions in IL-2 (Figure 7B), IL-6 (Figure 7C), and IFN-γ (Figure 7D), but no detectable effects on IL-1β (Figure 7A) or TNF-α (Figure 7E).
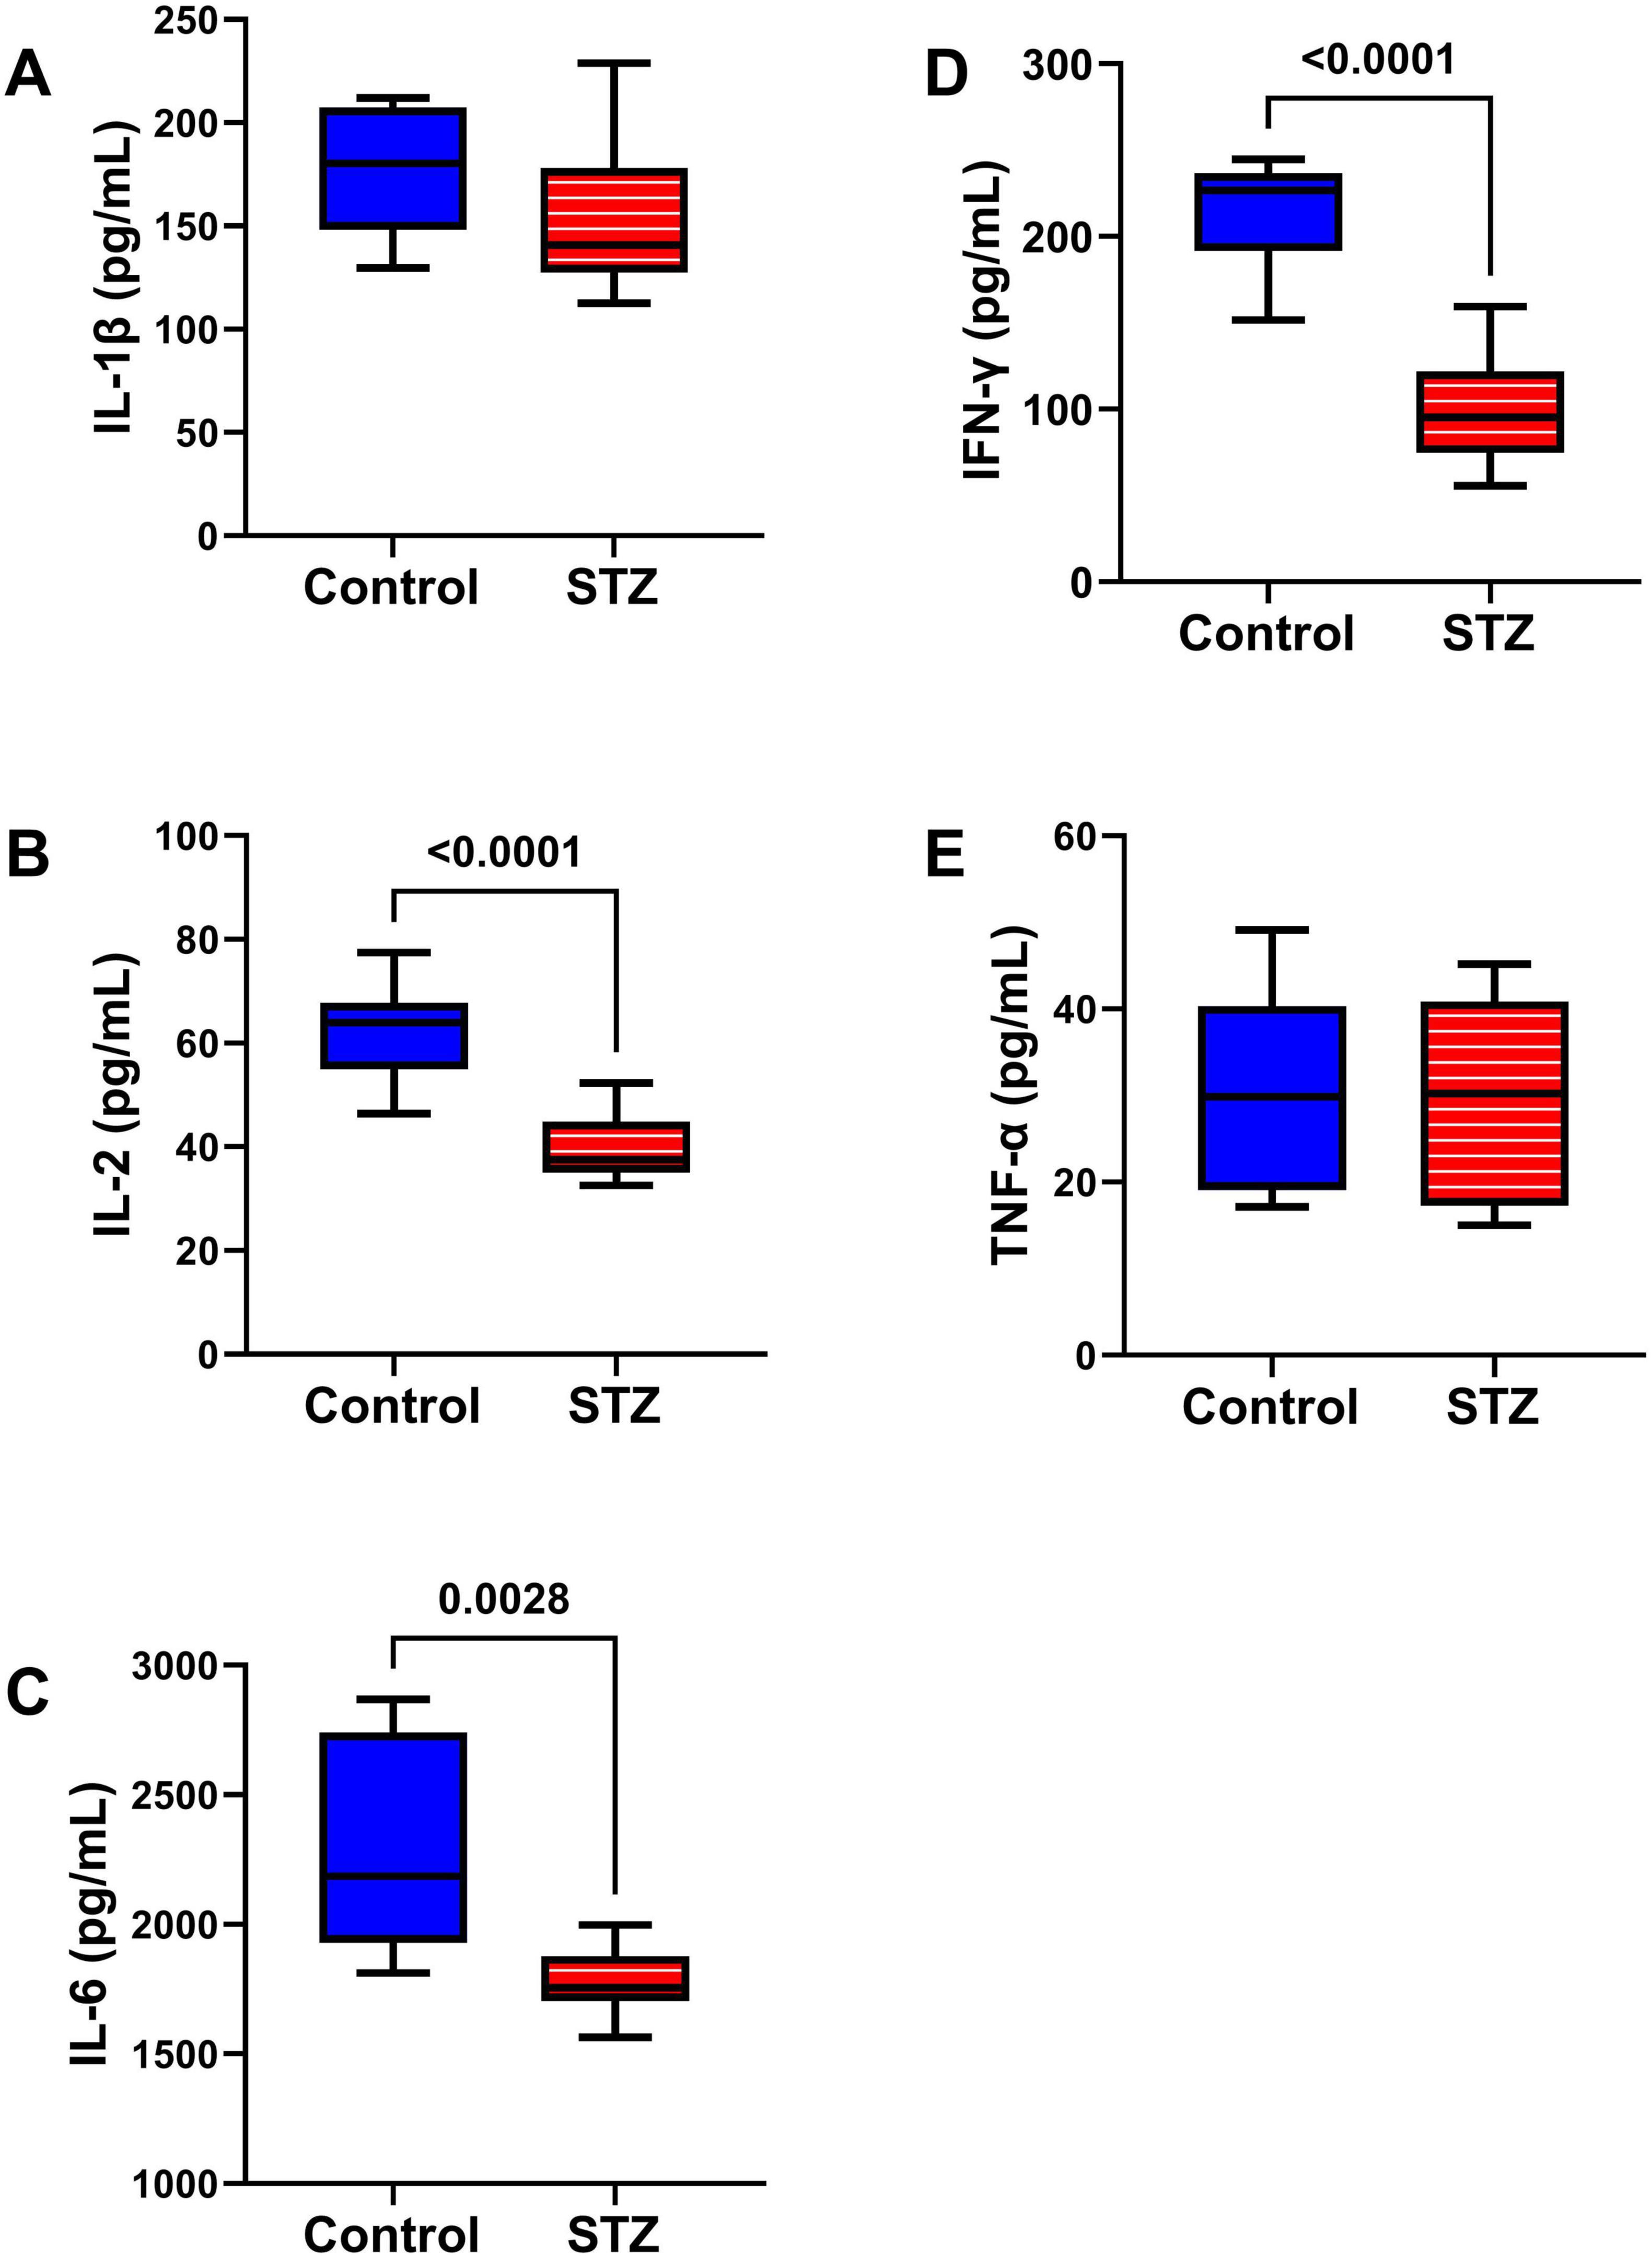
Figure 7. Pro-Inflammatory Cytokines. A multiplex ELISA panel was used to measure the effects of ic-STZ on (A) IL-1β, (B) IL-2, (C) IL-6, (D) IFN-γ, and (E) TNF-α immunoreactivity in temporal lobe tissue (n = 8 controls and 11 ic-STZ rats). Inter-group comparisons were made by repeated measures t-tests. Significant (p ≤ 0.05) differences are displayed.
Upstream Insulin/IGF-1 and IRS-1 Signaling Pathway: Insulin receptor (Insulin-R), insulin-like growth factor, type 1 receptor (IGF-1R), and insulin receptor substrate, type 1 (IRS-1) total (Figures 8A–C) and phosphorylated (Figures 8D–F) protein expression were measured by multiplex ELISA. Their calculated levels of relative phosphorylation were also assessed. The studies demonstrated a significant increase in the mean level of IGF-1R (Figure 8B) but significantly reduced levels of pY1135/1136-IGF-1R (Figure 8E) and p/T-pY1135/1136-IGF-1R (Figure 8H) in the ic-STZ samples. In contrast, there were no significant effects of ic-STZ on total Insulin-R (Figure 8A), pY1162/1163-Insulin R (Figure 8D), p/T-pY1162/1163-Insulin R (Figure 8G), IRS-1 (Figure 8C), pS636-IRS-1 (Figure 8F), or p/T-pS636-IRS-1 (Figure 8I).
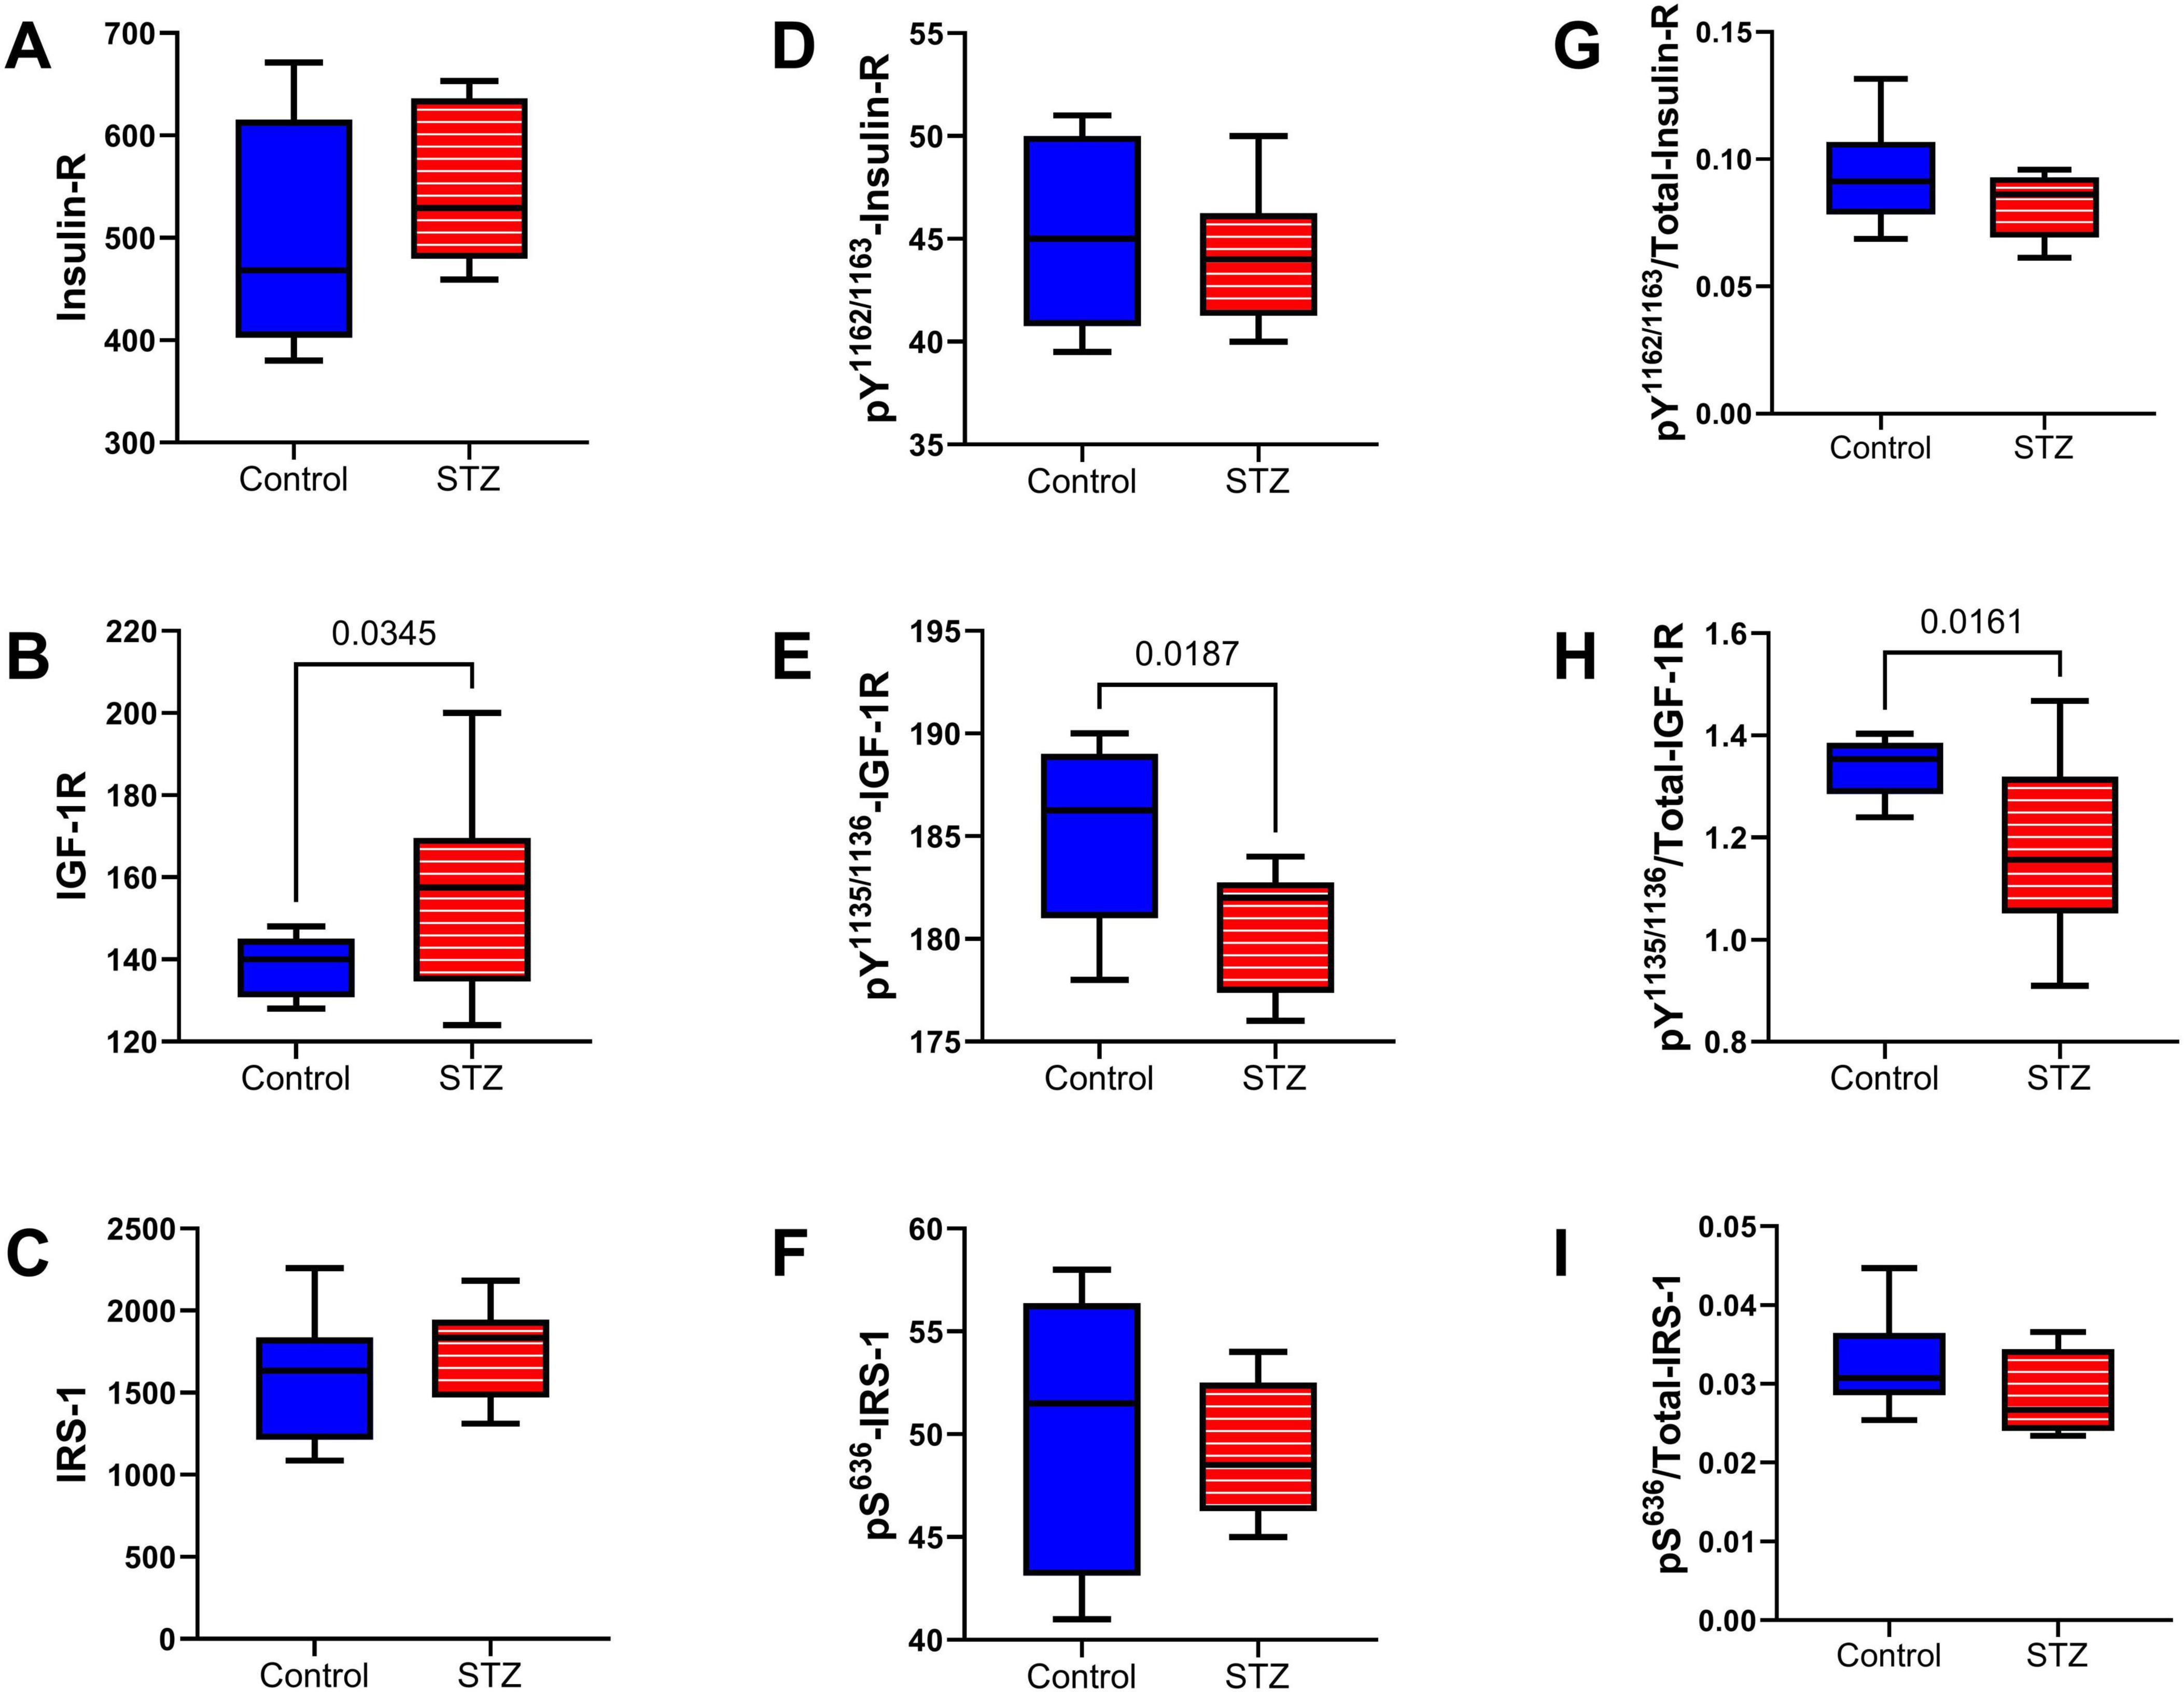
Figure 8. Upstream signaling molecules. The effects of ic-STZ on temporal lobe expression of (A) Insulin receptor (Insulin-R), (B) IGF-1R, (C) IRS-1 (D) pY 1162/1163-Insulin-R (E) pY 1135/1136-IGF-1R, (F) pS 636-IRS-1 were examined using commercial multiplex bead-based ELISA platforms. The (G) pY 1162/1163/T-Insulin-R, (H) pY 1135/1136/T-IGF-1R, and (I) pS 636/T-IRS-1 calculated ratios correspond to relative levels of signaling molecule phosphorylation. Inter-group comparisons (n = 8 control and 11 ic-STZ rats) were made by repeated measures t-tests. Significant (p ≤ 0.05) differences are displayed.
Intermediate Signaling Molecules: The multiplex ELISA panels measured the total (Figures 9A–D) and phosphorylated (Figures 9E–H) levels of Akt, GSK-3α, GSK3β, and PTEN, and those results were used to calculate the relative levels of protein phosphorylation (p/T) (Figures 9I–L). Significant effects of ic-STZ were marked by reduced levels of PTEN (Figure 9D) and pS380-PTEN (Figure 9H), and increased levels of p/T-pS380-PTEN (Figure 9L). In addition, total Akt exhibited a statistical trend-wise reduction related to ic-STZ (p = 0.06; Figure 9A). There were no significant effects of ic-STZ on TL levels of pS473-Akt (Figure 9E), p/T- pS473-Akt (Figure 9I), or the total, phosphorylated or relative phosphorylated GSK-3α (Figures 9B, F, J) and GSK3β (Figures 9C, G, K).
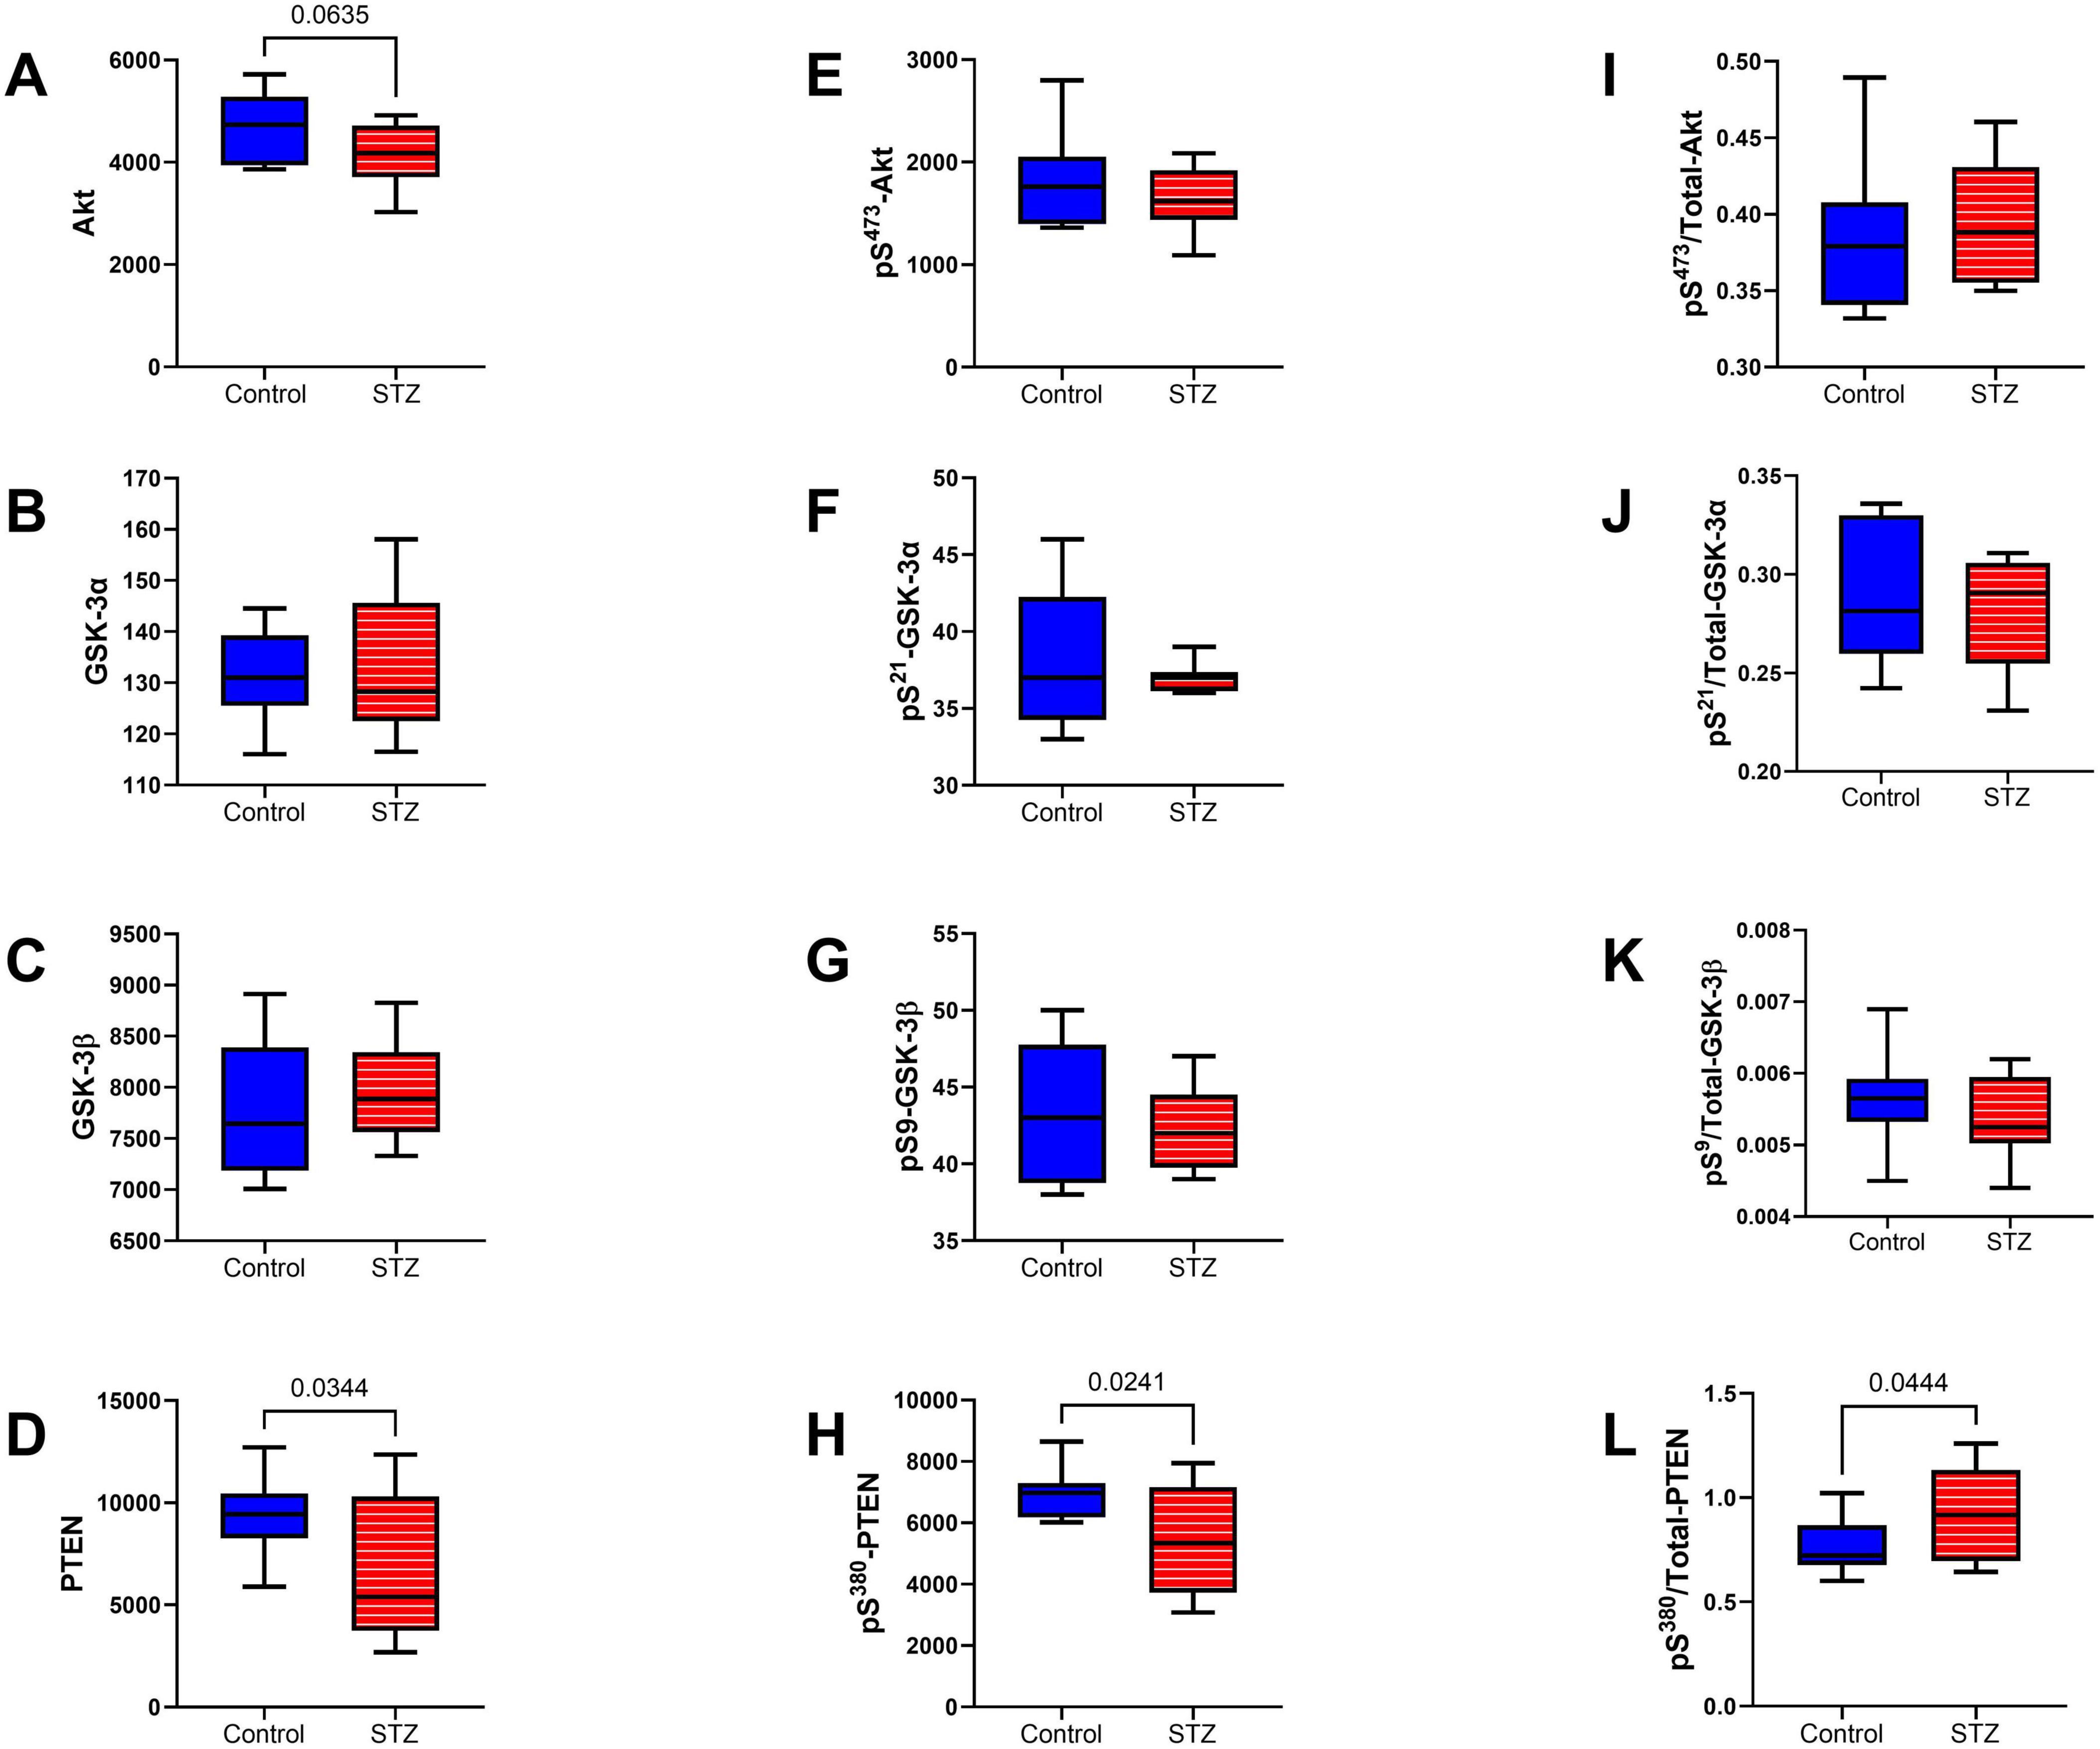
Figure 9. Intermediate signaling molecules. The effects of ic-STZ on temporal lobe expression of (A) Akt, (B) GSK-3α, (C) GSK-3β, (D) PTEN, (E) pS 473-Akt, (F) pS 21-GSK3α, (G) pS 9-GSK3β, (H) pS 380-PTEN were measured with total and phospho-protein multiplex ELISA platforms. The (I) pS 473/T-Akt, (J) pS 21/T-GSK3α, (K) pS 9/T-GSK3β, and (L) pS 380/T-PTEN calculated ratios correspond to relative levels of signaling molecule phosphorylation. Inter-group comparisons (n = 8 control and 11 ic-STZ rats) were made by repeated measures t-tests. Significant (p ≤ 0.05) and statistical trend-wise (0.05 < p < 0.10) differences are displayed.
mTOR pathway: Included among the mTOR pathway molecules evaluated using total and phosphoprotein multiplex ELISAs were TSC, mTOR, RPS6, and p70S6k (Figure 10). Significant ic-STZ effects were shown by the increased TSC2 (Figure 10A), and reduced pS2448-mTOR (Figure 10F), and pT412-p70S6K (Figure 10H). In contrast, no significant effects of ic-STZ were observed with respect to pS939-TSC2 (Figure 10E), p/T pS939-TSC2 (Figure 10I), mTOR (Figure 10B), p/T- pS2448-mTOR (Figure 10J), RPS6 (Figure 10C), pS235/236-RPS6 (Figure 10G), p/T-pS235/236-RPS6 (Figure 10K), p70S6K (Figure 10D), or p/T- pT412-p70S6K (Figure 10L). Additional duplex ELISAs were performed to measure the ic-STZ effects on Rictor and Raptor, the main regulators of mTORC complex and mTOR signaling (Rosner et al., 2010). The effects of i.c STZ on total (Figures 11A, B), phosphorylated (Figures 11C, D), and the relative phosphorylated (Figures 11E, F) levels of Rictor and Raptor were virtually identical in that all inter-group differences were statistically significant and marked by increased total and phosphorylated signaling molecule expression but reduced relative levels of phosphorylated Rictor and Raptor in the ic-STZ-treated group.
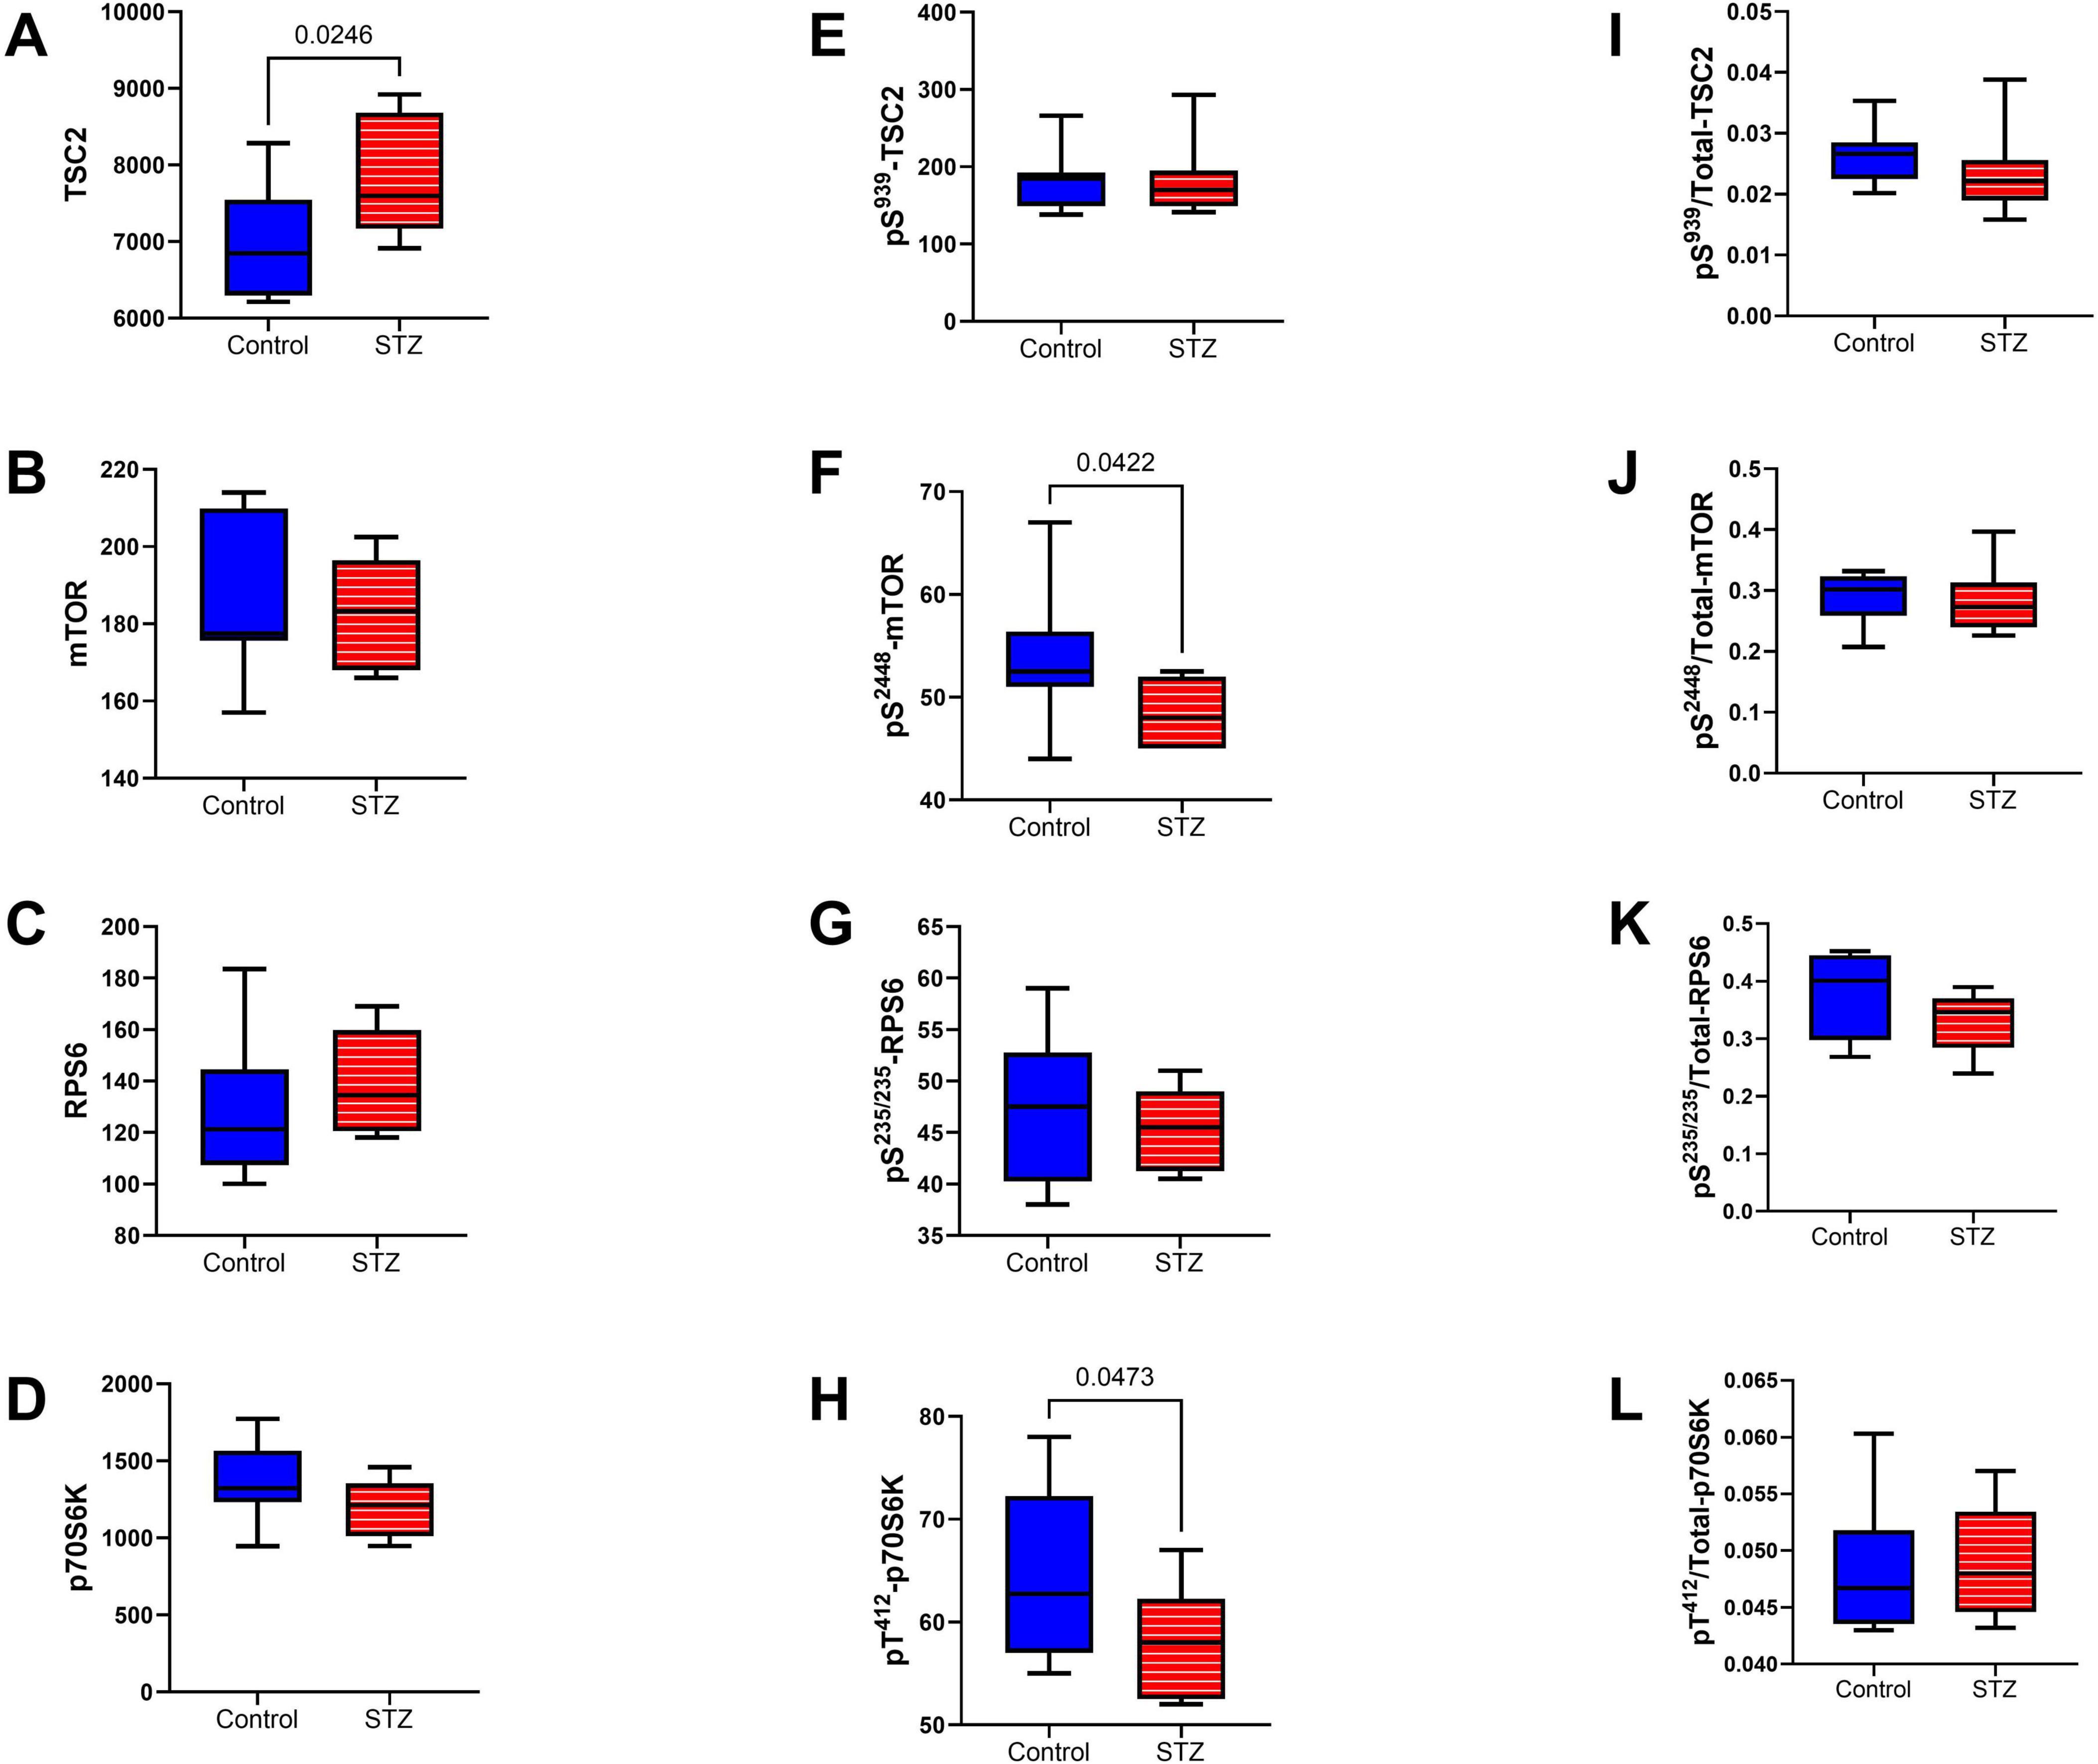
Figure 10. mTOR pathway signaling. Immunoreactivity to (A) TSC2, (B) mTOR, (C) RPS6, (D) p70S6K, (E) pS 939-TSC2, (F) pS 2448-mTOR, (G) pS 235/236-RPS6, (H) pT 412-p70S6K were measured with total and phospho-protein multiplex ELISAs. Relative levels of phosphorylation represented by (I) pS 939-/T-TSC2, (J) pS 2448/T-mTOR, (K) pS 235/236/T-RPS6, and (L) pT 412/T-p70S6K were calculated from the ratios of phosphorylated to total protein immunoreactivity. Inter-group comparisons (n = 8 control and 11 ic-STZ rats) were made by repeated measures t-tests. Significant (p ≤ 0.05) differences are displayed.
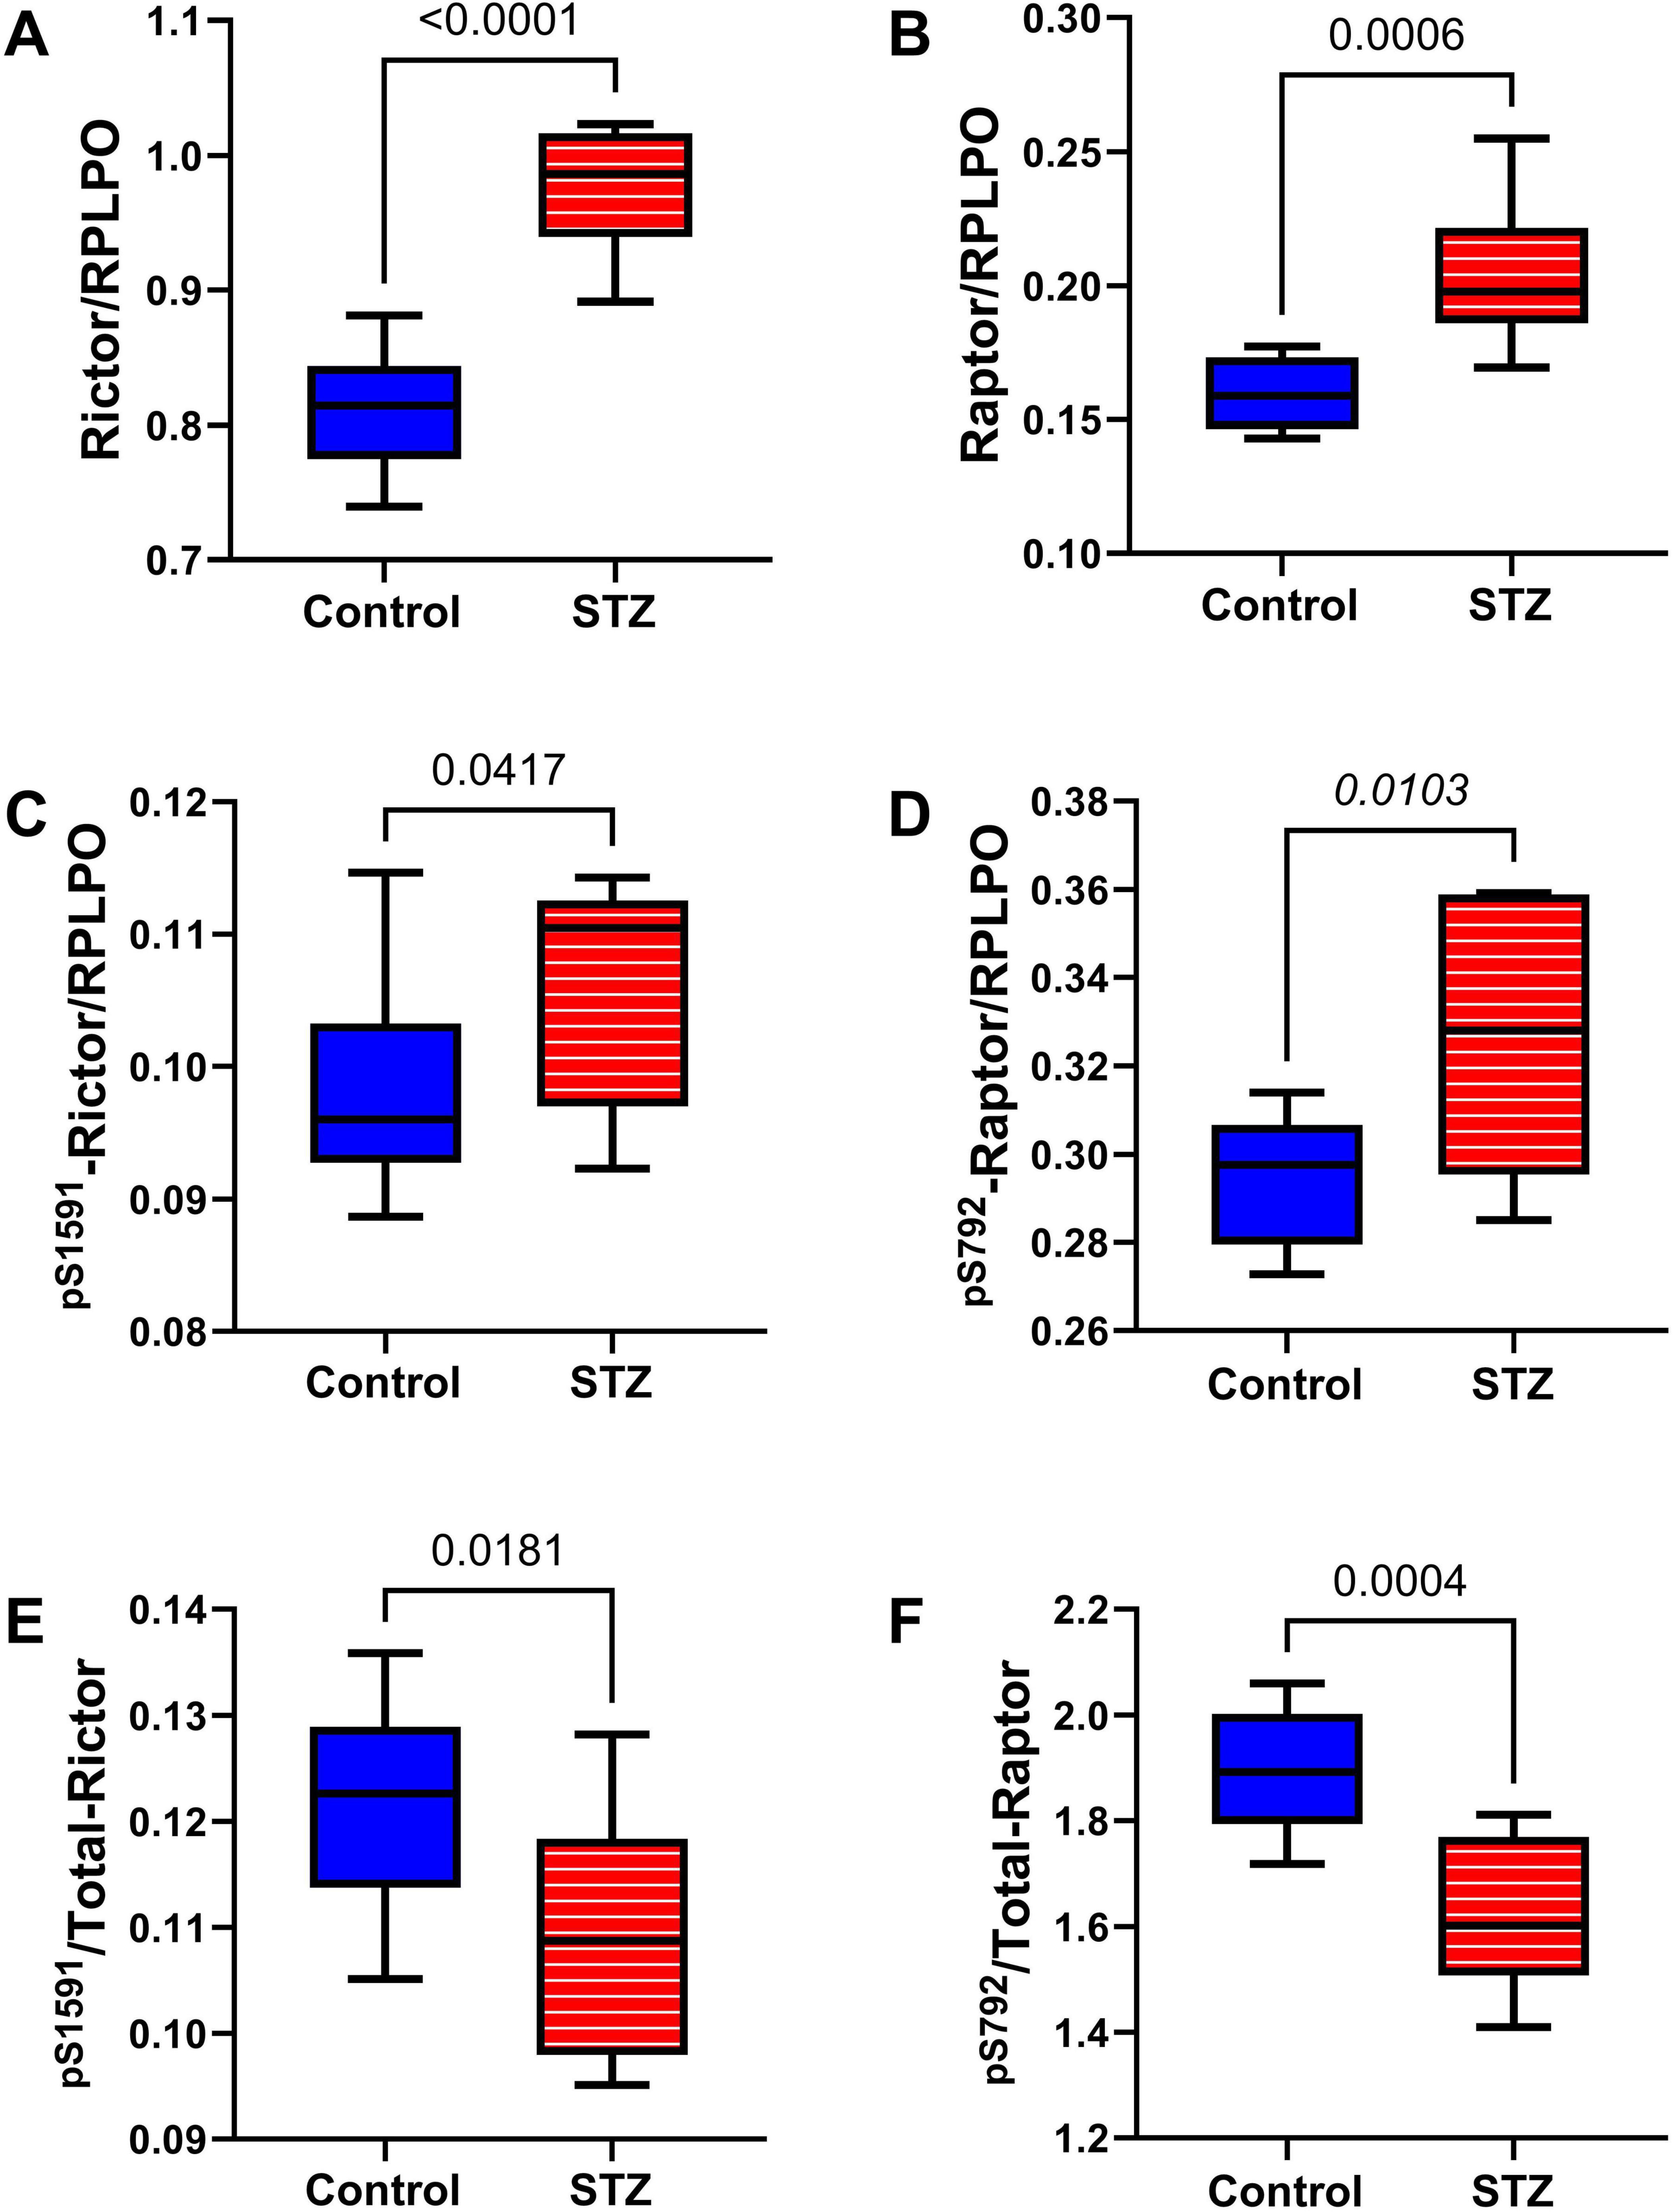
Figure 11. Rictor/Raptor Adaptor Molecules. Duplex ELISAs were used to measure temporal lobe immunoreactivity to (A) Rictor, (B) Raptor, (C) pS 1591-Rictor, and (D) pS 792-Raptor with results normalized to RPLPO. (E) pS 1591/T-Rictor and (F) pS 792/T-Raptor, corresponding to the relative levels of phosphorylation, were calculated from ratios of phosphorylated to total protein. Inter-group comparisons (n = 8 control and 11 ic-STZ rats) were made by repeated measures t-tests. Significant (p ≤ 0.05) differences are displayed.
4 DiscussionThis study assessed the integrity of mTOR signaling networks in the temporal lobes of an ic-STZ model with AD-type neurodegeneration and builds on prior evidence that AD is integrally linked to dysregulated signaling through the insulin and/or IGF receptors, and downstream through PI3K-Akt with activation of GSK-3β (de la Monte and Wands, 2005; Rivera et al., 2005; Steen et al., 2005; Talbot et al., 2012; Hoyer, 2004). Consequences include impairments in glucose utilization, energy metabolism, neuronal survival and plasticity, and homeostatic mechanisms, combined with increased oxidative stress and mitochondrial dysfunction (de la Monte, 2023; Cunnane et al., 2020; de la Monte, 2014; de la Monte and Wands, 2005). These pathophysiological processes contribute to cognitive decline and brain accumulations of signature hyperphosphorylated Tau-associated paired-helical filament lesions, i.e., neurofibrillary tangles, dystrophic neurites, and neuropil threads, and Aβ-containing senile plaques and fibrils (de la Monte, 2014; Gabbouj et al., 2019; Li et al., 2022). However, the need to pursue additional mechanistic studies is underscored by the lack of effective treatments and persistent incomplete understanding of the full spectrum of AD pathology, including white matter degeneration with myelin, fiber, and oligodendrocyte loss, which contributes to cognitive decline and dementia (Tahami Monfared et al., 2022; de la Monte, 2023; Cunnane et al., 2020). A more detailed understanding of dysregulated brain metabolism in AD could lead to better treatments based on expanded targeting of signal transduction networks, including those needed to support white matter integrity. The approach was to re-evaluate the neurobehavioral and AD-type neurodegenerative effects of ic-STZ sporadic AD model in relation to long-term dysregulation of brain insulin/IGF signaling and its crosstalk with the mTOR pathway. Importantly, mTOR signaling has pivotal roles in oligodendrocyte functions needed to maintain white matter integrity, bioenergetics, and neuroprotection (Figlia et al., 2018; Narayanan et al., 2009; Carson et al., 2015
留言 (0)