
記住我


Between January 2014 and December 2018, 307 patients aged ≥ 60 years old underwent LR for HCC at the General Surgery 2 Hepato-pancreato-biliary Surgery and Liver Transplantation of Padua University Hospital, Padua, Italy.
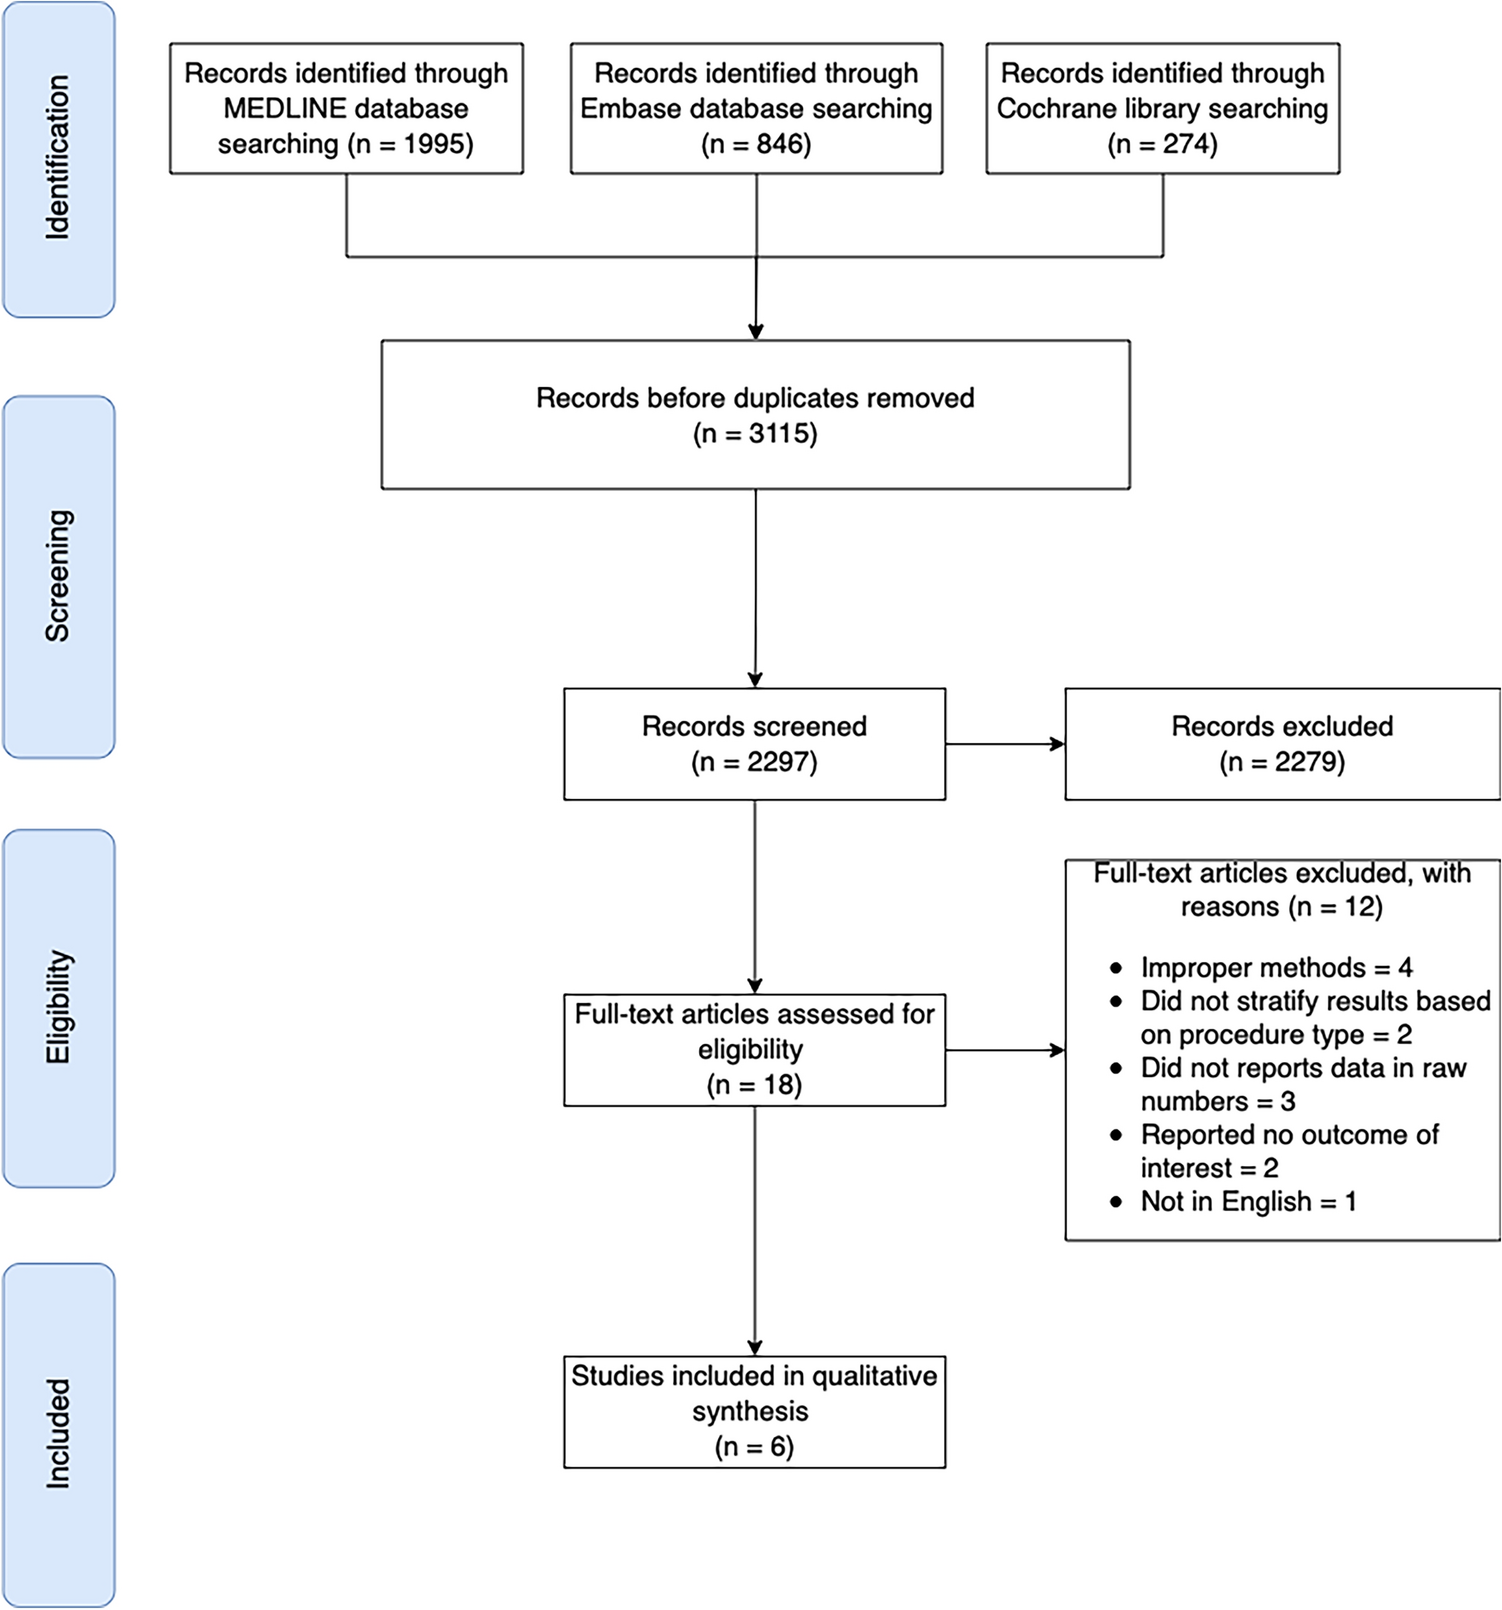
Based on the selected exclusion criteria, we excluded 100 patients for inadequate radiological images (the only MRI was available, or only CT-scan of the upper abdomen); 53 patients for a timeframe > 3 months between the last CT-scan and surgery; 5 patients due to a previous LR for HCC. One-hundred-and-forty-nine patients were eligible for the study.
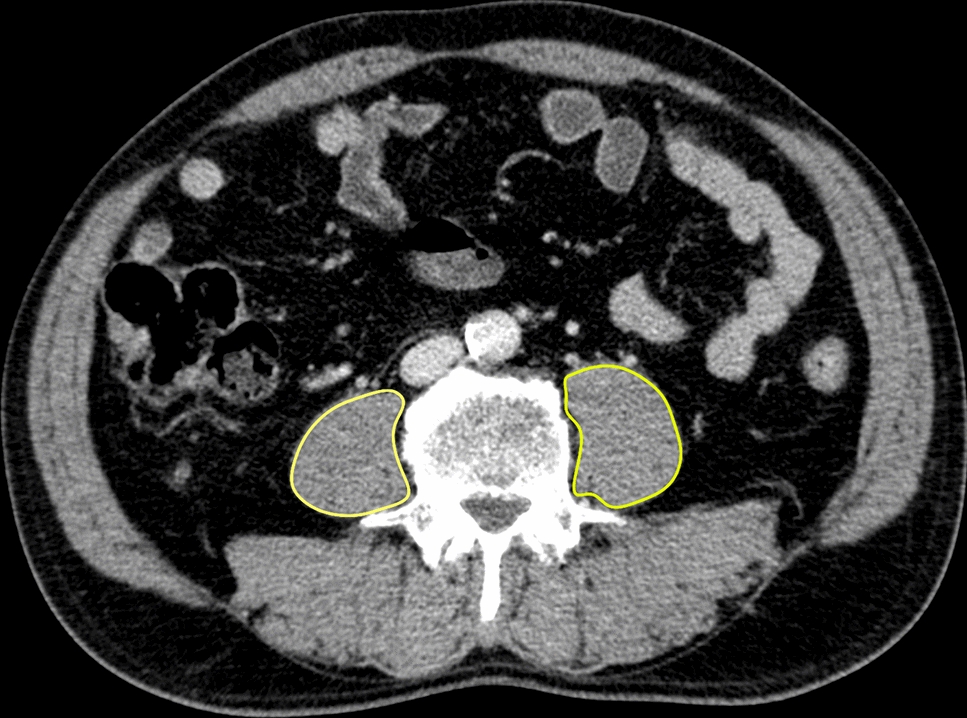
One-hundred- and-twelve (75%) patients were male, median age was 70 (65.6–75.8), median BMI was 26 (23.6–29.4) Kg/m2, 117 (78.5%) had a diagnosis of cirrhosis, 19/117 (16.2%) scored Child–Pugh class B, and 54 (36%) patients were hepatitis C virus (HCV) positive. Median PMA was 21.23 (18.01–23.65) cm2 in male patients and 12.95 (11.66–15.50) cm2 in females, while median PMI was 7.225 (6.282–8.140) cm2/m2 in male patients and 4.882 (4.413–5.720) cm2/m2 in female. In the male population, the 25th percentile was censored at 6.282 cm2/m2, while in the female population the 25th percentile of PMI was 4.413 cm2/m2. According to those cut-off values, 28 (25%) males and 9 (24.3%) females were deemed sarcopenic. Overall, 37 (24.8%) patients were considered sarcopenic. A BMI ≥ 30 kg/m2 was registered only in 3 (8.1%) out of 37 sarcopenic patients so no analysis of sarcopenic obesity was attempted.
Sarcopenic patients were older (72.0 [67.9, 77.3]; p = 0.027), had a lower BMI (25.1 [21.3,27.1]; p = 0.026), and a greater ASA score (≥ 3, 25/34 [74%]; p = 0.043) compared to non-sarcopenic. No differences were observed in terms of the patient's medical history, tumor, and intraoperative characteristics. Even though sarcopenic patients had longer ICU-stay (> 1 day, 16/37 [43%]; p = 0.006), no differences were observed in postoperative outcomes compared to non-sarcopenic. Table 1 resumes the main perioperative and postoperative characteristics of the two cohorts.
Table 1 Demographical, perioperative and postoperative characteristicsAfter uni- and multi-variable analysis, only BMI (OR 0.89; 95% CI 0.79, 0.98; p = 0.027) and ASA grade ≥ 3 (OR 3.33; 95% CI 1.22, 10.3; p = 0.026) were statistically significant associated with the presence of sarcopenia in the whole population (Table 2).
Table 2 Uni- and multi-variable analysis of characteristics associated to the presence of sarcopeniaTo investigate the risks factors associated with the probability of patients death, a Cox proportional-hazard regression analysis was performed, and the multivariable analysis showed a statistically significant association with sarcopenia (HR 2.15; 95% CI 1.07, 4.33; p = 0.032), MELD ≥ 10 (HR 3.13; 95% CI 1.55, 6.31; p = 0.001), HCC nodules > 3 (HR 4.97; 95% CI 1.86, 13.3; p = 0.001) and Clavien–Dindo ≥ 3 postoperative complication (HR 3.38; 95% CI 1.69, 6.75; p < 0.001) (Table 3).
Table 3 Uni- and multi-variable analysis of characteristics associated with the probability of deathIn the current setting of aged (≥ 60 years) patients, given the non-negligible probability of death for causes other than HCC (e.g.: cerebrovascular or cardiovascular disease), further Cox Proportional-Hazard regression analysis was performed to investigate the HCC-related death. This latter multivariable analysis showed that the only factor associated with HCC-related death was HCC nodules > 3 (HR 5.91; 95% CI 1.90, 18.4; p = 0.002). (Table 3). Furthermore, history of TKI therapy (HR 3.26; 95% CI 1.59, 6.67; p = 0.001), HCC nodules > 3 (HR 2.74; 95% CI 1.34, 5.61; p = 0.006), and positive resection margin (R1) (HR 1.70; 95% CI 1.07, 2.68; p = 0.023) were independent risk factors for reduced DFS at Cox proportional-hazard regression analysis.
In our study population, TO was achieved in 98 (66%) patients. Twenty-five out of 37 (68%) sarcopenic patients achieved TO, and 73 out of 112 (65%) non-sarcopenic achieved TO (p = 0.79). The achievement of each TO item was calculated separately with cumulative percentages to identify which indicator was the main limiting factor for accomplishing TO. The R0 resection margin is the item found to have the lowest achievement incidence compared to the others (77.2%). Interestingly, in sarcopenic patients, the main limiting factor is the absence of postoperative complications grade ≥ 3 (81.1%) (Fig. 2).
Fig. 2
The proportion of patients who achieved each desired health outcome forming the textbook outcome (TO) in the whole population, and the two groups individually
Survival analysisAfter LR, the 1-, 3- and 5-year overall survival (OS) of our aged HCC patient population were 85.9%, 65.9%, and 56.3% respectively with a median follow-up of 16.7 (IQR 6.1; 37.1) months.
Sarcopenic patients had an OS of 75.7%, 60.3%, and 38.8% at 1, 3, and 5 years, respectively, compared to 89.2%, 68.2% and 61% at 1, 3, and 5 years respectively registered in non-sarcopenic (p = 0.085) (Fig. 3a).
Fig. 3
Kaplan–Meier survival curves of the study population stratified according to sarcopenia status (a); Kaplan–Meier survival curves of the study population stratified according to textbook outcome (TO) achievement (b); Kaplan–Meier survival curves of the study population stratified according to both sarcopenia status and TO achievement (c)
Patients who reached TO showed a significantly higher OS compared to patients who didn’t (TO Achieved patients 1-, 3-, and 5-year OS was 91.7%, 70.9%, and 59.7%, respectively; TO Not-achieved patients 1-, 3-, and 5-year OS was 74.6%, 56.3%, and 50%; p = 0.01) (Fig. 3b). Interestingly, when TO achievement was stratified according to sarcopenia status, sarcopenic patients who did not achieve TO had worse survival outcomes compared to both non-sarcopenic (regardless of TO status) and sarcopenic who achieved TO (OS at 1, 3, and 5 years 55.6%, 18.5% and 18.5% respectively; p = 0.00039) (Fig. 3c).
NomogramWe developed a nomogram to predict post-operative survival probability based on the multivariable Cox proportional-hazard regression analysis. Hence, age ≥ 70, sarcopenia, MELD ≥ 10, HCC nodules > 3, and Clavien–Dindo ≥ 3 postoperative complications were the selected items, with each variable being assigned a score on a point scale. By adding the scores and by locating the total score on the total points scale, a straight line could be drawn perpendicularly downwards to identify the probabilities of 1-, 3-, and 5-year OS (Fig. 4). These predictive probabilities could be used to predict the outcome of LR for HCC for an individual patient.
Fig. 4
Nomogram to predict post-operative survival probability
留言 (0)