
記住我

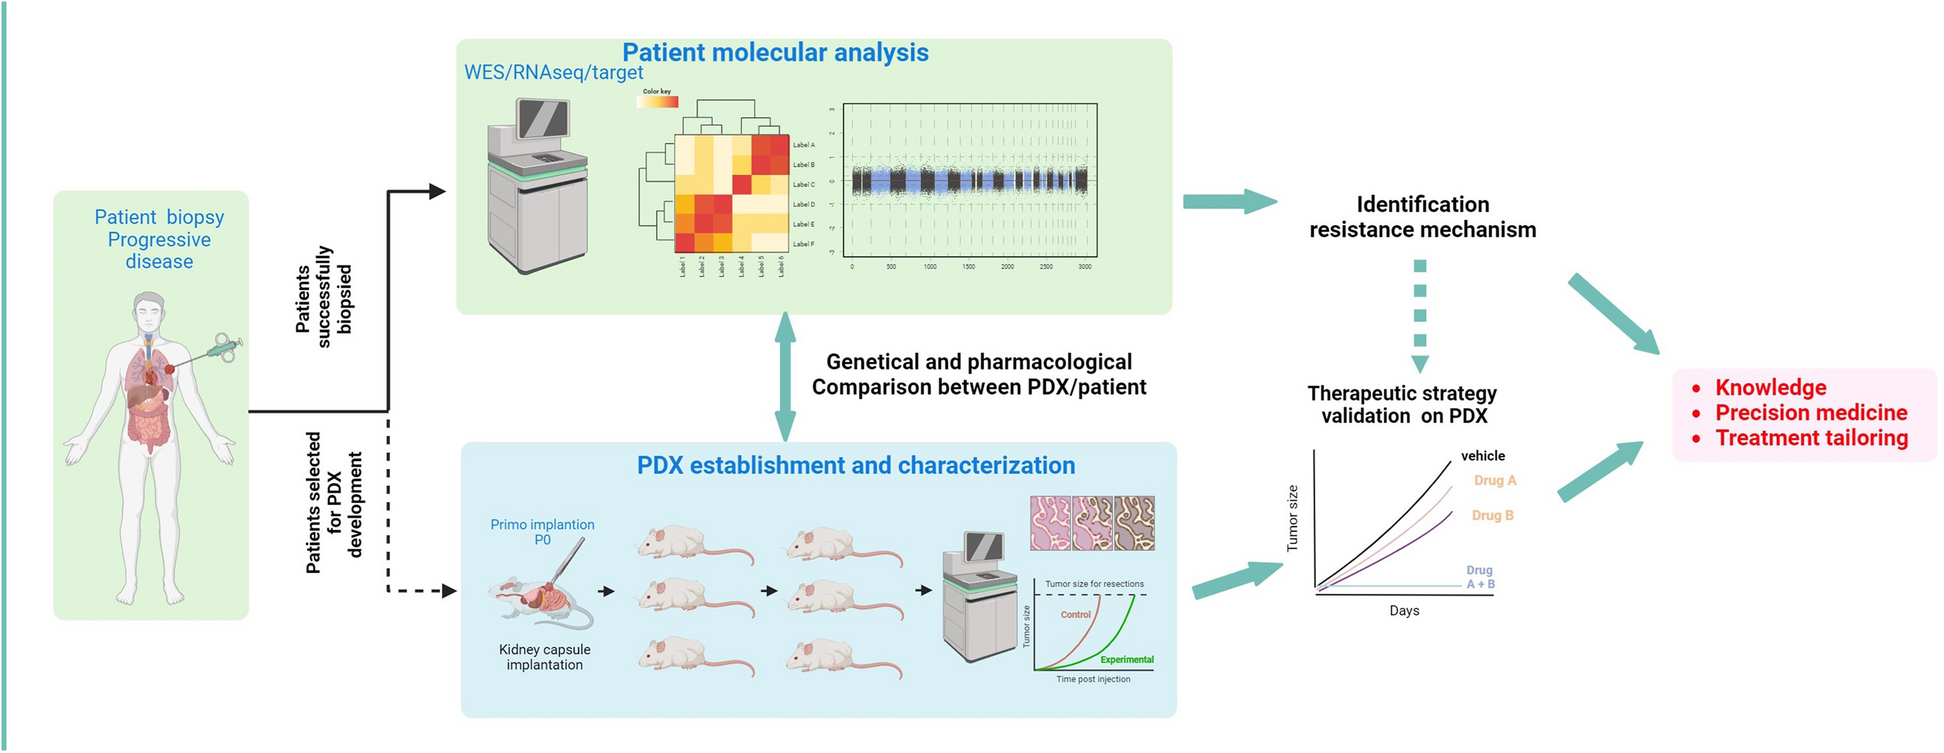


The study flow is illustrated in Fig. 1A. From January 2015 to December 2022, a total of 1,120 biopsies were performed on 857 patients, with 220 patients (25.7%) undergoing a second biopsy, 38 (4.4%) a third biopsy, 4 (0.5%) a fourth, and one patient having a fifth biopsy. The repeated biopsies were mainly performed due to treatment progression, insufficient material, or unsuccessful tumor sequencing.
Fig. 1
Global patient population. A. Study flow chart. B. Oncoprint depicting 1230 pathogenic alterations identified in the initial biopsy of 563 patients, all of whom exhibited at least 1 pathogenic alteration. C. Frequency of the highest OncoKb alteration in each first biopsy
The median age of the 857 patients was 63.3 years (interquartile range: 54.7–70.5). The majority of the patients were male, accounting for 56.0% (n = 480/857) of the cohort. The five most prevalent cancer types within this cohort were lung cancers (38.9%; n = 333/857), digestive cancers (16.3%; n = 140/857), prostate cancers (14.1%; n = 121/857), genito-urinary cancers outside of the prostate (10.0%; n = 86/857) and gynecological cancers (5.8%; n = 50/857). In terms of treatment regimen, 30.9% (n = 265/857) of the patients received targeted therapy, 19.3% (n = 165/857) received immunotherapy, 14.1% (n = 121/857) received endocrine therapy [22, 23] and 35.7% (306/857) received another type of treatment (such as conventional cytotoxic chemotherapy) (Table 1 and Supplementary Table 1).
Table 1 Characteristics of the patients included in the MATCH-R trialGenomic landscape of the MATCH-R patientsOverall, out of 857 patients, molecular analysis was not feasible for 254 (29.6%) due to low tumor content (TC) (< 10%) or insufficient DNA and/or RNA. A total of 812 biopsies with adequate TC (> 10%) were collected from these patients, and molecular profiling was conducted on this subset. Specifically, 520 (64.0%) biopsies underwent both WES and RNAseq, 164 (20.2%) were analyzed using WES only, 106 (13.1%) using a targeted NGS panel due to low TC (ranging from 10 to 30%), and 22 (2.7%) using RNAseq only. Additionally, 341 (41.4%) of these biopsies were implanted in mice, resulting in 136 (16.5%) PDX models generated (Fig. 1A).
Focusing on the 661 molecular profiling performed on the first biopsy, at the time of inclusion in the clinical trial, at least one pathogenic alteration was identified for 563 (84.3%) of these biopsies. In total, 1384 pathogenic alterations were identified, 1294 (93.5%) single nucleotide variations, 64 (4.6%) focal copy number alterations, and 26 (1.9%) fusion transcripts. Among the genes mutated in at least 10 patients in this pan-cancer cohort, the five most affected were TP53 (63%), KRAS (21%), EGFR (10%), PIK3CA (10%) and ARID1A (9%) (Fig. 1B).
Furthermore, at least one actionable alteration was identified in 357 (53.4%) out of the 661 first biopsies performed. When considering the OncoKB actionability scale, 25% of these alterations were classified as level 1, 4% as level 2, 6% as level 3 and 27% as level 4 (Fig. 1C).
Targeted therapy cohort and resistance mechanismsAmong the 857 patients who underwent a biopsy, 265 (30.9%) were known to harbor a molecular cancer driver either through molecular profiling conducted as part of the protocol or through standard molecular diagnosis. The five most common oncogenic driver alterations were found in the genes EGFR, FGFR2/3, ALK, BRAF and KRAS (Fig. 2A). EGFR was the most prevalent gene, identified in 41.5% (n = 110/265) of the patients. All 110 EGFR mutations were identified in lung cancer patients. An FGFR2/3 alteration was detected in 15.5% (n = 41/265) of the patients. Among the 41 cases with FGFR2/3 alterations, the majority, 51.2% (n = 21/41), originated from digestive cancer, followed by urothelial cancer 34.1% (n = 14/41), gynecological cancers 7.3% (n = 3/41), and 2 from other types of cancer. ALK alterations were observed in 11.7% (n = 31/265) of the patients. The large majority, 90.3% (n = 28/31), of ALK alterations were identified in lung cancer patients, while one case each came from digestive cancer, sarcoma, and thyroid cancer. BRAF alterations were detected in 6.8% (n = 18/265) of the patients. The majority of these, 55.6% (n = 10/18), were found in lung cancer cases, followed by digestive cancers 22.2% (n = 4/18), other cancers 16.7%, (n = 3/18), and 1 case in urological cancer. Finally, KRAS mutations were identified in 5.7% (n = 15/265) of the patients. Among these KRAS mutations, the largest proportion 53.3% (n = 8/15) originated from digestive cancers, followed by lung cancer 33.3% (n = 5/15), and gynecological cancers 13.3% (n = 2/15).
Fig. 2
Targeted therapy cohort. A. Sankey diagram depicting the tumor type of origin of the 265 patients harboring a molecular driver and the 594 patients without any molecular driver identified. B. Flow chart representing the resistance mechanisms identified in the 265 patients harboring a molecular driver. C. Pie chart depicting the by-pass resistance mechanisms identified in the 265 patients harboring a molecular driver
Subsequent repeated biopsies were used to investigate acquired resistance mechanisms. Out of 265 patients, 175 (66.0%) underwent additional molecular profiling on biopsies collected after developing resistance to targeted therapies. The resistance mechanism remained unidentified for 72 patients (41.1%). Among the patients with identified resistance mechanisms, 56 (32.0%) experienced an on-target resistance mechanism, 44 (25.1%) had a by-pass resistance mechanism, and 3 patients had histological transformation explaining the resistance to the targeted therapy (Fig. 2B). The molecular profiles of the 44 patients with a by-pass resistance mechanism revealed the presence of 51 alterations. The most frequently altered genes among these patients were KRAS (13.7%, n = 7/51), PIK3CA (11.8%, n = 6/51), PTEN (11.8%, n = 6/51), NF2 (7.8%, n = 4/51), AKT1 (5.9%, n = 3/51), and NF1 (5.9%, n = 3/51) (Fig. 2C).
EGFRAmong the 110 EGFR-mutated patients treated with a TKI, a molecular profile was performed at the time of progression in 70.0% (n = 77/110) of them.
The disease progression was experienced after first- or second-generation TKI for 24 patients (31.2%). In terms of baseline oncogenic driver, 14 patients (58.3%) harbored a deletion in exon 19, 8 patients (33.3%) carried a p.(Leu858Arg) mutation, 1 patient had both p.(Leu858Arg) and p.(Thr790Met) mutations, and 1 had a p.(Gly719Ala) mutation.
Regarding the mechanisms of resistance observed in patients treated with first- or second-generation TKI, 14 patients (58.3%) demonstrated an on-target resistance mechanism. As expected, the predominant mechanism was the presence of the p.(Thr790Met) mutation, which was found in 13 patients (92.9%). Additionally, 1 other on-target alterations was identified: p.(Arg776Cys). For 10 patients (41.7%), the resistance mechanisms were not identified. Of note, no by-pass resistance mechanisms were identified in these patients (Fig. 3A).
Fig. 3
Resistance mechanisms in EGFR, FGFR2/3 and ALK driven patients. A & B. Sunburst charts representing the EGFR cohorts. The innermost layer depicts the baseline molecular driver and the identified resistance mechanism are presented in the outermost layer. C & D. Sunburst charts illustrating the FGFR2/3 cohorts. The innermost layer depicts the baseline molecular driver and the identified resistance mechanism are presented in the outermost layer. E. Sunburst chart representing the ALK cohort. The innermost layer depicts the baseline molecular driver and the identified resistance mechanism are presented in the outermost layer
Out of the 77 EGFR-mutated patient who received an EGFR TKI treatment and for whom a biopsy at progression was available, 53 (68.8%) experienced disease progression while being treated with the third-generation TKI osimertinib. Among these patients, the most prevalent oncogenic driver observed at baseline was the combination of deletion in exon 19 and p.(Thr790Met) mutation, which was present in 27 patients (50.9%). Other oncogenic drivers included: deletion in exon 19 alone, observed in 10 patients (18.9%), p.(Leu858Arg) mutation observed in 5 patients (9.4%), combination of p.(Leu858Arg) and p.(Thr790Met) mutations observed in 6 patients (11.3%) and finally other drivers such as the combination of deletion in exon 19 and EGFR amplification (n = 2), the combination of p.(Glu709Ala) and p.(Gly719Ala) mutations, the combination of p.(Ser768Ile) and p.(Leu858Arg) mutations, and the presence of p.(Leu747Ser) mutation, were observed in 5 patients (9.4%).
A mechanism of resistance to third-generation EGFR TKI was identified for 32 patients (60.4%) who were treated with osimertinib. For 20 patients (37.7%), a by-pass mechanism was observed involving 25 genes. The most common by-pass mechanisms were PTEN with 4 mutations, KRAS 3 mutations, PIK3CA 3 mutations, RET 2 mutations, FGFR3 2 fusions and MET with 2 amplifications. An on-target resistance mechanism was observed for 11 patients (20.8%). The most frequent mutation observed was EGFR:p.(Cys797Ser), which was seen in 9 patients (81.8%). The EGFR:p.(Cys797Gly) mutation was observed in 1 patients and p.(Val843Ile) in 1 patient. A histological transformation from non-small cell lung cancer to small cell lung cancer was observed in 1 patient. Finally, for 20 (37.7%) patients, no molecular mechanisms explaining the resistance were observed (Fig. 3B).
FGFR2/3Among the 41 patients with FGFR2/3 alterations, a molecular profiling performed at progression in the MATCH-R clinical trial was available for 32 of them (78.0%).
The baseline oncogenic driver was a FGFR2 fusion for 15 of these patients (46.9%) mainly involving cholangiocarcinoma patients. The most frequent fusion partner of FGFR2 was BICC1 observed in 3 patients, followed by STRN4 (n = 2/21) in 2 patients. Other FGFR2 partners included CCSER2, DIP2C, ERC1, FAM160B1, INA, MITF, PAWR, PXN, and WDHD1. Regarding FGFR2 mutations, FGFR2:p.(Cys382Arg) was identified in two patients (Fig. 3C). Additionally, the baseline oncogenic driver alteration was a FGFR3 mutation for 15 patients (46.9%), mainly suffering from urothelial cancer, with 11 patients (34.4%) presenting with a FGFR3:p.(Ser249Cys) mutation, 3 patients (9.4%) harboring a FGFR3:p.(Tyr373Cys) and 1 patient with a FGFR3:p.(Arg248Cys) mutation (Fig. 3D).
In terms of resistance mechanisms to FGFR2 or FGFR3 inhibitors (erdafitinib, futibatinib or pemigatinib), an on-target mechanism was identified in 15 patients (46.9%). These on-target mechanisms were monoclonal for 11 of these patients (68.8%, n = 11/16). By-pass mechanisms were observed in 7 patients (21.9%) and occurred in different genes such as EGFR, NF1, PIK3CA, NF2 or MSH6. Lastly, no resistance mechanism was identified for 10 patients (31.3%).
ALK (Fig. 3E)A molecular profiling performed in the context of the MATCH-R clinical trial was available for 21 out of the 31 patients (67.7%) known to harbor an ALK molecular driver. Among these patients, ALK systematically involved fusion events, with EML4 emerging as the predominant fusion partner, observed in 11 patients (52.4%). Additionally, there were unique fusion occurrences involving CLTC and STRN in individual patients. The fusion partner of ALK remained unidentified for 8 patients (38.1%).
Regarding the resistance, an on-target mechanism was identified in 9 patients (42.9%) which was a unique mutation for 6 of them (66.7%). A by-pass resistance mechanism was identified in 2 patients involving NF2 in both cases. One histological transformation from non-small cell lung cancer to small cell lung cancer was also identified. Finally, the resistance mechanism to the ALK inhibitor remained unidentified for 9 patients (42.9%).
Treatment orientation based on molecular profilingOverall, out of the 100 patients who received a targeted therapy and developed either an on-target or a by-pass resistance mechanism, treatment adaptation based on molecular profiling was implemented for 45 (45.0%) of them. Among the 56 patients with an on-target resistance mechanism, a new line of treatment was proposed for 34 of them (60.7%). Similarly, out of the 44 patients with a by-pass resistance mechanism, a new line of treatment was proposed for 11 patients (25.0%).
The best response observed to the new line of treatment could be assessed for 29 (64.4%) patients. Among these patients, 11 (37.9%) had a stable disease, 11 (37.9%) had a partial response, 6 (20.7%) had a progressive disease. Additionally, one patient achieved a complete response.
The median duration of treatment was 11 months (ranging from 0 to 101 months) and the main reason for stopping the adapted treatment was progressive disease, identified in 23 out of 29 patients (79.3%) overall.
Among the 29 patients who had an evaluable response to the new line of treatment, 20 patients (69.0%), were diagnosed with an EGFR-driven cancer. Fourteen (70.0%) of them were initially treated by a first- or a second-generation EGFR TKI and all developed an on-target resistance involving the EGFR:p.(Thr790Met) mutation. Switching to a third-generation EGFR TKI appeared to be effective in overcoming this identified resistance mechanism. The median duration of treatment with this new line was 18 months, with some patients still on osimertinib for 78, 87, and even 101 months. On the other hand, resistance to third-generation TKI primarily involved by-pass resistance mechanisms (in 5 out of 6 patients) occurring in HER2, MET, KRAS, ALK and NF1. The treatment duration of the new line of treatment was shorter when compared to resistance to first or second generation TKIs with a median duration of 2 months.
For the four ALK-driven patients who had an evaluable clinical response to the adapted treatment, the median duration of treatment was 15 months and for the three FGFR2/3 patients the median was 11 months.
However, a few patients with on-target resistance mutations did not respond to next-generation therapies specifically designed to target those alterations. For example, patients MR396 and MR475 experienced rapid disease progression (1 and 6 months, respectively) despite treatment with osimertinib targeting the EGFR:p.(Thr790Met) mutation. Similarly, patient MR517 who harbored the ROS1:p.(Gly2032Arg) resistance mutation to lorlatinib, failed to respond to reprotectinib, with progression occurring within 2 months. Patient MR439, treated with brigatinib for the ALK:p.(Gly1269Ala) mutation showed disease progression within only a few days. Conversely, some patients demonstrated prolonged responses with single-agent therapies instead of combination, targeting exclusively the resistance mechanism. For instance, patient MR12 responded to erlotinib for 43 months after developing the EGFR:p.(Leu861Arg) mutation, which emerged following progression on a first-line MET inhibitor (Table 2).
Table 2 Treatment orientation based on molecular profilingPDX establishmentOut of the 341 biopsies grafted in mice, 136 patients-derived xenograft (PDX) models were successfully established, reaching an overall success rate of 39.9% (n = 136/341) (Fig. 4) (https://pdx.gustaveroussy.fr). The success rates of tumor engraftment varied by pathology, with bladder cancer achieving an 80.0% (n = 12/15) success rate, followed by pancreas at 71.4% (n = 10/14), gynecological at 61.5% (n = 8/13), head and neck at 60.0% (n = 9/15), non-small cell lung cancer at 37.3% (n = 60/161), cholangiocarcinoma at 36.7% (n = 11/30), and prostate at 26.5% (n = 18/68) (Supplementary Fig. 1A). Notably, the success rate of engraftment appeared to be positively associated with the tumor cell content of the other biopsies collected simultaneously for sequencing (Supplementary Fig. 1B).
Fig. 4
PDX models available. Illustration of the PDX developed based on the molecular driver and the targeted therapy that led to acquired resistance
Regarding the targeted therapy cohort, 31 PDX models were available from EGFR patients, 26 from FGFR2/3 patients (14 with FGFR2 fusion, eight with FGFR3:p.(Ser249Cys), three with FGFR3:p.(Tyr373Cys), and one with FGFR2:p.(Arg248Cys)), 16 from ALK patients, 15 from KRAS patients, and 6 from BRAF patients. The global take rate of the PDX models from tumors harboring an oncogenic molecular driver was 44.3%, with variations among the different drivers: KRAS (62.1%), BRAF (46.2%), FGFR2/3 (44.8%), EGFR (39.7%) and ALK (39.5%) (Supplementary Fig. 1C).
PDX with resistance to targeted therapies availableThe high value of the PDX models generated lies in the fact that most of them originate from tumors collected at the time of acquired resistance in patients. After first- second-generation EGFR inhibitors, we generated four PDX models with on-target resistance mechanisms, including three models carrying an EGFR:p.(Thr790Met) mutation, and one model with an EGFR:p.(Arg776Cys) mutation. Additionally, among the 25 models established post-osimertinib, resistant models harbored on-target resistance, four had an EGFR:p.(Cys797Ser) mutation, and one an EGFR:p.(Cys797Gly) mutation. In contrast to the models obtained after first- second-generation inhibitors, we acquired PDX models that developed by-pass pathway resistance to osimertinib. Three showed a PIK3CA mutation PIK3CA:p.(Asn545Lys) or PIK3CA:p.(Arg108His), two had a fusion FGFR3::TACC3 or STRN::ALK), two displayed a MET amplification, and one exhibited a NRAS mutation NRAS:p.(Gln61Leu).
In terms of resistant models to FGFR2/3 TKI, PDX models were available for nine patients with a FGFR2 fusion, five with a FGFR3:p.(Ser249Cys) mutation, two harboring a FGFR3:p(Tyr373Cys) mutation, and one each harboring FGFR2:p.(Cys382Arg) and FGFR3:p.(Arg248Cys) mutations. Among these models, seven harbored on-target resistance mutations FGFR2:p.(Asn549Lys), FGFR2:p.(Asp650His), FGFR2:p.(Val565Phe), FGFR2:p.(Val564Leu), FGFR3:p.(Val754Met), four were established from patients presenting by-pass resistance mechanisms (PTEN, EGFR, NF1, PIK3CA), two PDX models from the same patient with an MSI profile presented multiple by-pass resistance mechanisms, and three models had unknown resistance mechanisms.
Resistant PDX models to ALK/ROS1 inhibitors, were available for eight patients with an EML4::ALK fusion, one patient with a CD74::ROS1 fusion, and one patient harboring a STRN::ALK fusion. Among these models, five harbored a single on-target resistance mutation ALK:p.(Gly1202Arg), ALK:p.(Val1180Leu), ALK:p.(Phe1174Leu), or ALK:p.(Leu1196Met), and one PDX model carried two on-target resistance mutations ALK:p.(Gly1202Arg) + ALK:p.(Thr1151Met). Moreover, two PDX models were established from patients presenting by-pass resistance mechanisms, NF2 skipping of exon 10 + NF2:p.(Lys543Asn) and NF1:p.(Lys1385Arg) and four models had unknown resistance mechanisms.
In addition to the previously mentioned results related to EGFR, FGFR2/3, and ALK, our team has successfully developed numerous PDX models that exhibit acquired resistance to targeted therapies (Fig. 4). As the development of KRAS inhibitors targeting the KRAS:p.(Gly12Cys) and KRAS:p.(Gly12Asp) mutations has more recently become a new challenge in the clinic in our KRAS cohort, we successfully developed 15 PDX models, including nine with the KRAS:p.(Gly12Cys) mutation and six with the KRAS:p.(Gly12Asp) mutation. Among these PDX models, four came from patients who acquired resistance to KRAS inhibitors. For two PDX models, by-pass resistance mechanisms were identified, involving a PIK3CA:p.(Glu545Lys) mutation and multiple gene amplifications. Furthermore, we have successfully established eight PDX models that exhibit resistance to various targeted therapies, including BET inhibitors, everolimus, EED inhibitors, NOTCH1 inhibitors, and HER2 inhibitors. Importantly, our research efforts have resulted in the development of PDX models derived from patients who have experienced resistance to PARP inhibitors such as olaparib, niraparib or rucaparib, ATR inhibitors such as ceralasertib, as well as to MAPK pathway inhibitors like vemurafenib, dabrafenib, or trametinib, and to NTRK inhibitors.
PDX closely reproduce patient’s tumorAs expected, the PDX models closely resembled the genetic tumors found in patients. In this study, when comparing pathogenic alterations, the mean concordance between the PDX models and the patients’ tumors reached 75.3% overall. When looking into details, the mean concordance was 100% for NTRK and HER2 models. The mean concordance was also notably high for ALK (90.0%), KRAS (82.0%), EGFR (81.0%), FGFR2/3 (81.0%), and BRAF models (72.0%) as depicted by Supplementary Fig. 2 and Supplementary Table 2.
For 40% (n = 55/136) of PDX models, in the frame of a collaboration with XenTech company, selective pressure was applied to the mice using the inhibitor to which the patient had developed resistance to validate its pharmacological status. Globally 84% (n = 46/55) of the PDX reproduced the pharmacological status of the patient’s tumor.
For example, PDX models MR7 and MR441-R, which exhibit resistance mechanisms involving MET amplification and the acquisition of EGFR:p.(Cys797Ser) respectively, both demonstrate resistance to osimertinib treatment (Fig. 5A). Within the PDX models of ALK-positive patients, PDX model MR619 displayed resistance to alectinib, consistent with the patient's clinical resistance profile marked by the acquisition of a secondary mutation, ALK:p.(Gly1202Arg) (Fig. 5B). Another PDX model, MR448-RE, exhibited lorlatinib resistance and retained the compound mutations, ALK:p.(Gly1202Arg) and ALK:p.(Thr1151Met) (Fig. 5B).
Fig. 5
Pharmacological status of PDX models. In vivo pharmacological evaluation was performed by measuring the tumor volume in vehicle-treated and TKI-treated mice for: A. Two EGFR-resistant PDX models (MR7 and MR441) treated with 25 mg/kg of Osimertinib and vehicle. B. Two ALK-resistant PDX models (MR619, from cholangiocarcinoma, and MR448re, from lung) treated with 50 mg/kg of Alectinib and 20 mg/kg of Lorlatinib, respectively. C. Two FGFR3 bladder PDX models from the same patient: one from a biopsy in a stable disease site (MR86-SD) and one from a resistant disease site (MR86-PD), treated with 15 mg/kg of erdafitinib and vehicle. D. Two FGFR2-resistant cholangiocarcinoma PDX models (MR313 and MR369) treated with 1 mg/kg of Pemigatinib or vehicle
MR86-PD PDX model, treated with erdafitinib, revealed a PIK3CA mutation PIK3CA:p.(Glu545Lys) upon resistance analysis. This indicated a by-pass pathway resistance mechanism, confirmed by subsequent treatment response in the PDX model, not observed in PDX models obtained from stable disease sites (Fig. 5C). Patients MR313 and MR369 developed pemigatinib resistance due to secondary mutations FGFR2:p.(Asp650His) and FGFR2:p.(Val565Leu), respectively, with corresponding PDX models exhibiting pemigatinib resistance (Fig. 5D).
Overcoming strategies investigated in PDX modelsThe use of PDX models serves as a valuable and complementary approach in enhancing our understanding of resistance mechanisms and enables us to evaluate the efficacy of therapeutic combinations to overcome such resistance. Notably, we have conducted successful validations in four instances, demonstrating that combination therapy can effectively overcome resistance:
Case 1: MR240 (Supplementary Fig. 3A).
After 22 months of osimertinib treatment, patient MR240 developed STRN::ALK fusion-induced resistance. To explore alternatives, we tested alectinib and osimertinib combination efficacy using PDX models, revealing a robust response [14].
Case 2: MR135 (Supplementary Fig. 3B).
Double-hit alteration involving NF2 caused lorlatinib resistance in patient MR135. Investigating resistance mechanisms, we found that combining mTOR inhibitor vistusertib with lorlatinib in PDX models effectively overcame the resistance [13].
Case 3 and 4: MR15 and MR86 (Supplementary Fig. 3C and 3D).
Identifying by-pass pathways during erdafitinib treatment, MR15 model exhibited increased EGFR phosphorylation, while MR86 had a PIK3CA:p.(Glu545Lys) mutation. Targeting these abnormalities, we combined erdafitinib with gefitinib for MR15 and with PIK3CA inhibitor pictilisib for MR86, proving the efficacy of these tailored therapeutic combinations in both cases [12].
PDX models have also proven invaluable for assessing the efficacy of next-generation TKIs in overcoming resistance associated with secondary kinase domain mutations from previous generations. For instance, we recently demonstrated that the irreversible FGFR2-selective inhibitor lirafugratinib exhibited significant potency against PDXs established from biopsies of cholangiocarcinoma patients. These biopsies were collected at the onset of acquired resistance to reversible FGFR inhibitors and contained resistant secondary mutations, specifically FGFR2:p.(Asn549Asp) (Supplementary Fig. 3E), FGFR2:p.(Asp650His) (Supplementary Fig. 3F) and FGFR2:p.(Asn549Asp) (Supplementary Fig. 3G) [24].
Similarly, the latest generation ALK TKI, NVL-655, demonstrated remarkable activity against MR448re PDX that was established following resistance to lorlatinib due to compound ALK mutations ALK:p.(Gly1202Arg) + ALK:p.(Thr1151Met) (Supplementary Fig. 3H) [25].
留言 (0)