
記住我


A large number of animal populations and data sets were considered in this study. These are detailed below for each analysis. Briefly, the most important of these are (i) pedigree and life history information on millions of female cattle (date of birth; lifespan; cause of death; dates of insemination and bull IDs; dates of calving and onset of lactation) extracted from the French national bovine database; (ii) phased and imputed Illumina BovineSNP50 array genotypes generated as part of the routine bovine genomic evaluation; (iii) performance for various traits corrected for non-genetic factors as estimated in the national genomic evaluation; (iv) whole-genome sequences of 1869 cattle; (v) SNP array genotypes for candidate variants in large populations; and (vi) animals recruited from commercial farms for physiopathological characterization and functional analyses.
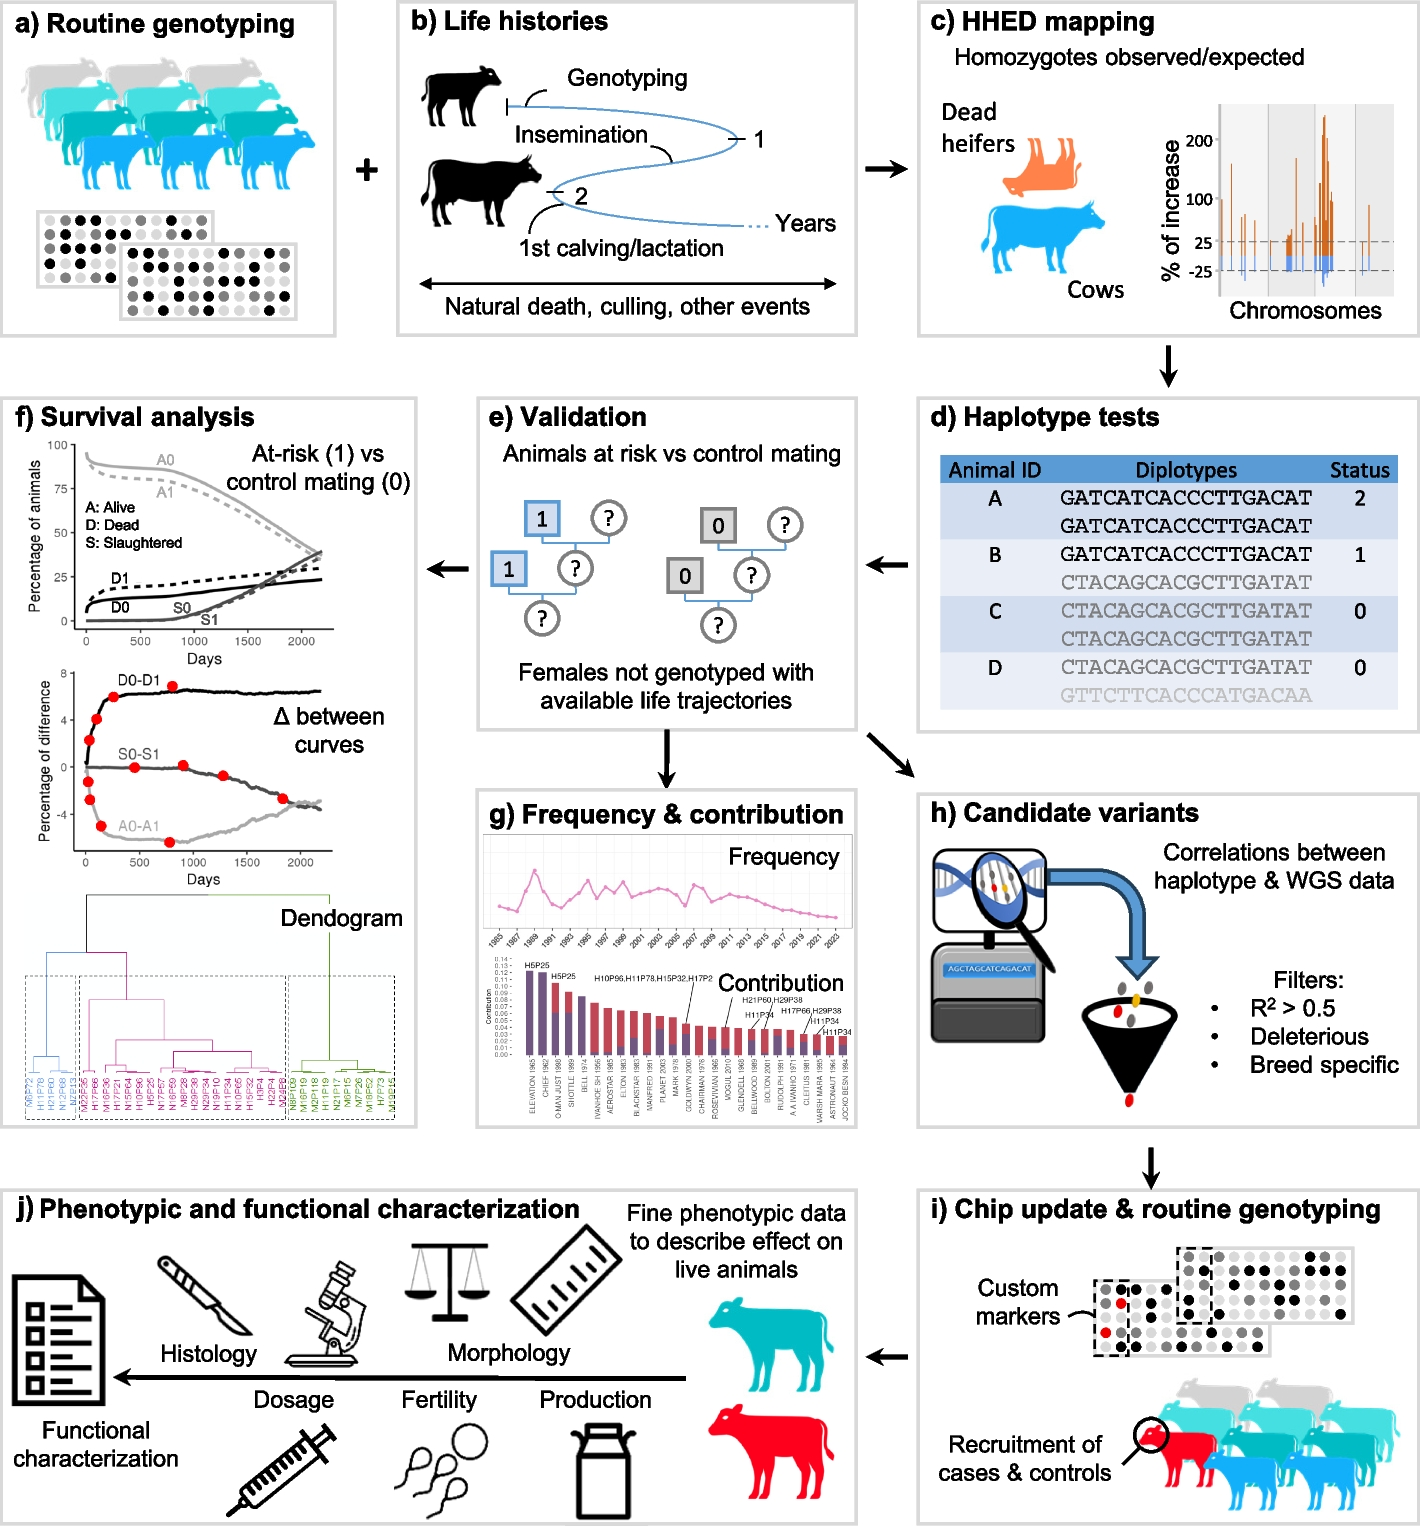
Mapping of recessive loci, validation and analysis of survival curvesPedigree and life history information was extracted from the French national bovine database for 5.96 million Holstein, 1.63 million Montbeliarde, and 1.24 million Normande females whose sires and maternal grandsires (MGS) were genotyped. Of these, 593,445 Holstein, 333,520 Montbeliarde, and 103,975 Normande females were also genotyped, themselves.
The discovery population was restricted to genotyped females and included 8203, 6198, and 2254 “dead heifers” (females that died of natural causes before 3 years of age and were never inseminated) and 291,529, 141,343, and 56,095 cows (females that calved and started a first lactation) from the three breeds, respectively (Additional file 1: Table S1). These animals and their ancestors were genotyped using various Illumina SNP arrays over time (LD, ∼7 K SNPs; custom LD, ∼10 K to 20 K; BovineSNP50, ∼50 K; EuroGMD, ∼63 K; and HD, ∼777 K). Raw genotypes were imputed and phased for 44,596 autosomal SNPs by FImpute [92] as part of the French routine genomic evaluation of cattle, as described by [93] (Additional file 1: Table S2). We considered sliding haplotypes of 20 markers (incremented by one marker) and counted the number of homozygotes observed (Nobs) within each group of genotyped individuals. In parallel, we estimated the expected number of homozygotes (Nexp) using within-family transmission probability. We filtered haplotypes satisfying the following criteria: Nobs ≥ 10 in cases, increase in homozygotes (i.e., (Nobs − Nexp)/Nexp) ≥ 25% in cases and ≤ − 25% in controls (Additional file 1: Table S3). Among stretches of consecutive haplotypes, we selected the one showing the highest increase in homozygotes in cases as the “peak haplotype” (Additional file 1: Table S4). For validation, we compared the proportions of animals belonging to three categories (“dead heifers,” “cows,” and “others”) using a chi-squared test with Benjamini–Hochberg correction (p value ≤ 0.05) among the descendants of at-risk mating (“1”; carrier sire and carrier MGS) or control mating (“0”; non-carrier sire and MGS). Note that the “other” category includes females that do not meet the criteria retained for the “dead heifers” and “cows” groups (e.g., heifers that were slaughtered, heifers that died after 3 years of age). This analysis was performed on a validation population of 5.96 million Holstein, 1.63 million Montbeliarde, and 1.24 million Normande females born between 2000 and 2015, most of whom were not genotyped themselves (Additional file 1: Table S5). Then, for 34 validated haplotypes, we calculated the daily proportion of females that died of a natural causes (D), were slaughtered (S), or were still alive (A) over a period of 6 years for mating types 0 and 1 (Additional file 1: Table S8). We also calculated the D0-D1, S0-S1, and A0-A1 differences in proportion on a daily basis and scored the days on which 25, 50, 75, and 100% of the maximum deviation between each proportion difference was reached (Additional file 1: Table S9). We then used these 12 parameters to perform a principal component analysis and a hierarchical clustering using the RStudio package Factoshiny v.1.2.5033 (Additional file 1: Table S10).
Male calves were not included in this study, due to the fact that they are usually sent to feedlots farms at a young age (~ 1 month), making them difficult to monitor, especially when exported to other countries.
Estimation of the number of calves born homozygous for one or more validated haplotypes in the last 10 yearsWe considered 55.5 million inseminations performed during the period 2013–2022, of which 2.0 million involved females and males that were both genotyped. To estimate the number of homozygous calves (NH), we took into account the total number of inseminations (NAI), the proportion of at-risk mating observed within genotyped couples (PR), the Mendelian probability (0.25), the average conception rate in each breed (CR), and finally the proportion of females bred by AI (%AI): NH = NAI*PR*CR*0.25/%AI (Additional file 1: Table S7; [2]).
Evolution of haplotype frequencies over timeThe frequency of the 34 validated haplotypes was calculated on an annual basis considering 1,185,446 Holstein, 591,294 Montbeliarde, and 180,722 Normande individuals of any sex available in the French bovine national genomic evaluation database born between 1985 and 2023 (Additional file 1: Table S11).
Genetic contribution of the ancestors of the actual female populationsTo identify the main ancestors of the current female populations and calculate their raw and marginal genetic contributions, we analyzed the pedigrees of 3,058,756 Holstein, 738,333 Montbeliarde, and 333,793 Normande females born within the period 2019–2022 with at least sire and dam information available (Additional file 1: Table S12) using the PEDIG software [94].
Effects of haplotypes on recorded traitsThe effects of the 34 haplotypes in the heterozygous state were estimated on 14 morphological and production traits routinely recorded for selection purposes. To remove the various environmental factors affecting these phenotypes, we used yield deviation data, i.e., records adjusted for the non-genetic effects included in the genomic evaluation models. Yield deviations are a by-product of the official genomic evaluations carried out by GenEval on behalf of the French breeding organizations (for details on the models used, see https://www.geneval.fr/english). Yield deviations were analyzed with a mixed model including the fixed effect of the haplotype studied (0 versus 1 copy), the fixed effect of the year of recording, and the individual random polygenic effect. Calculations were performed with BLUPF90 software [95]. The sample size ranged from 1930 to 509,258 cows per group (Additional file 1: Table S13). Student’s t-test was used to compare the means between groups for each trait and adjusted using the Benjamini–Hochberg method. To allow comparisons between traits, effects were converted to genetic standard deviations (GSD) based on the genetic parameters estimated for the national genomic evaluations.
Estimating effects in homozygotes did not seem relevant to us because at this stage we cannot know whether the haplotypes are in complete linkage disequilibrium with the causal variants. These effects may be strongly biased if, among animals homozygous for the haplotype with performance records, there is a large increase in the proportion of animals that are not homozygous for the causative variant as a result of natural counterselection of double homozygotes (for both the haplotype and the causative variant).
DNA extractionGenomic DNA was extracted from semen straws, blood, or myocardium samples using the DNeasy Blood and Tissue Kit (Qiagen). DNA quality was controlled by electrophoresis and quantified using a Nanodrop spectrophotometer.
Whole-genome sequencing and variant callingWe analyzed the whole-genome sequences of 1869 cattle from more than 70 different breeds generated by Illumina technology (Additional file 1: Table S14; [16,17,18,19,20,21,22,23,24,25,26,27,28,29,30,31,32,33,34,35,36,37,38,39,40,41,42,43,44,45,46,47,48,49,50,51,52,53,54,55,56,57,58,59,60,61,62,63,64,65,66]). Of these, 1137 were obtained from public databases and 732, consisting mainly of influential AI bulls of French breeds, were sequenced at the GeT-PlaGe facility during the last decade (http://genomique.genotoul.fr/). Paired-end libraries with insert sizes ranging from 300 to 500 bp were generated using the NEXTflex PCR-Free DNA Sequencing Kit (Biooscientific) or the TruSeq Nano DNA Library Prep Kit (Illumina). Libraries were quantified using the KAPA Library Quantification Kit (Cliniscience), checked using a High Sensitivity DNA Chip (Agilent) or the Fragment Analyzer (Agilent), and sequenced on Illumina machines (HiSeq2500, Hiseq3000, Hiseq10X, or NovaSeq 6000) with 2 × 100-bp or 2 × 150-bp read lengths, according to the manufacturer’s protocol. Reads were aligned to the bovine ARS-UCD1.2 reference genome sequence using the Burrows–Wheeler aligner (BWA-v0.6.1-r104; [96]). SNPs and small InDels were identified using the GATK-HaplotypeCaller software [97] as previously described [98, 99], while structural variations (SVs) were detected using the Pindel [100], Delly [101], and Lumpy [102] software.
Variant filtering and annotationR2 correlations between haplotype status and genotypes for variants located in a 20-Mb region centered on each of the 33 haplotypes were calculated for 247 Holstein, 160 Montbeliarde, and 118 Normande WGS. The number of haplotype carrier alleles ranged from one to 22 in this data set (Additional file 1: Table S15). Variants with an R2 score ≥ 0.5 were selected, and those segregating in more than one breed represented in the full set of WGS were filtered out, assuming that the causative mutations occurred after the creation of the breeds. The remaining variants (consisting only of SNPs and small InDels) were annotated using Variant Effect Predictor (Ensembl release 110; https://www.ensembl.org/info/docs/tools/vep/index.html), and only those predicted to be deleterious were considered (i.e., missense variants with a SIFT score ≤ 0.05, stop gain or loss, premature start, start loss, frameshift, inframe insertion or deletion, and variants affecting splice donor or acceptor sites). Finally, the consistency of these annotations was verified using independent resources: some variants predicted by VEP to be deleterious and located in non-coding regions (i.e., with no evidence of bovine expressed sequence tag or orthologous transcripts in mouse or human) according to the USC genome browser (http://genome.ucsc.edu/) were further removed. Information on the pathophysiological features associated with mutations affecting orthologous genes in humans and mice was extracted from the Online Mendelian Inheritance in Man (OMIM; https://www.omim.org) and Mouse Genome Informatics (MGI; https://www.informatics.jax.org) databases (Additional file 1: Table S16). The putative amino acid sequence of the mutant NOA1 protein was obtained using the Expasy translate tool (https://web.expasy.org/translate/) after insertion of the frameshift allele into the cDNA of the Ensembl transcript ENSBTAT00000025792. Information on “domains & features” was obtained from the eponymous Ensembl “transcript-based display.” To analyze amino acid conservation at the ITGB7 and RFC5 mutation sites, “1-to-1” orthologous proteins from numerous animal species were extracted from the “orthologues” “gene-based display” available for Ensembl entries ENSBTAG00000018993 and ENSBTAG00000007137 and aligned using ClustalW software version 2.1 ( [103]; https://www.genome.jp/tools-bin/clustalw). Finally, a sequence logo was generated using WebLogo ( [104]; http://weblogo.berkeley.edu). Note that RFC5 in animals is orthologous to RFC3 in fungi and plants, as supported by orthology comparisons with the yeast (Saccharomyces cerevisiae) protein entry YNL290W that are available in Ensembl release 110 (www.ensembl.org/), Ensembl Fungi release 57 (http://fungi.ensembl.org/), and Ensembl Plants release 57 (http://plants.ensembl.org/index.html). “1-to-1” orthologs of yeast RFC3 were extracted from the latter two databases and added to the animal orthologs of the bovine RFC5 protein for analysis. Information on protein IDs, species, and amino acid sequence around the mutation sites is provided in Additional file 1: Tables S19 and S28.
Analysis of the 2/3D structure of the mutant ITGB7 proteinThe effect of the bovine p.G375S point mutation on the ITGB7 protein structure was evaluated using the mCSM-PPI2 server (https://biosig.lab.uq.edu.au/mcsm_ppi2/; [105]). For this purpose, the crystal structure of the human ITGA4/ITGB7 dimer interacting with the Act-1 mAb was used as a reference structure model (accession number 3V4P in the Worldwide Protein Data Bank; www.wwpdb.org). The orthologous glycine residue is located at position 283 in the human ITGB7 protein used for modeling.
Large-scale genotyping of candidate variants and analysis of LD with haplotypesThe Illumina SNP arrays used for genomic evaluation in France have a custom section to which probes for genotyping thousands of deleterious variants have been added over time through various forward and reverse genetic projects. Genotypes were available for the APOB insertion responsible for recessive CD in Holstein cattle and for six candidate variants for new loci associated with increased juvenile mortality discovered in this study. Information on the probes and the number of genotypes available in 15 breeds can be found in Additional file 1: Tables S6, S16, S17 and S18. These data were used to calculate allele frequencies, to verify the breed specificity of the markers, to compute contingency tables between haplotype status and genotypes, and to calculate R2 square correlations. Finally, they were also used to investigate the effect of the ITGB7, RFC5, and NOA1 candidate variants on various traits (see related sections).
Cause of incomplete LD between some haplotypes and their candidate variantsTo determine whether the incomplete LD was due to a relatively recent de novo mutation or to an ancient founder effect followed by recombination events between the haplotype and the variant, we sorted carriers of (i) both the haplotype and the variant, (ii) the haplotype but not the variant, and (iii) the variant but not the haplotype. We searched for IBD segments between these animals and their ancestors using both genotype and pedigree information. Illumina BovineSNP50 array genotypes were available for most of the AI bulls used in France since 1985. This analysis was performed for H5P25/ITGB7 (Additional file 1: Table S23) and M6P72/NOA1 (Additional file 2: Fig. S2).
Imputation of ITGB7 and RFC5 variants using long-size haplotypesAs the ITGB7 and RFC5 candidate variants were included in the arrays used for genomic evaluations in France in early 2019, we have developed an approach to impute them in animals genotyped before that date, in order to allow survival studies over 6 years and to increase cohort sizes for studying different traits. For the ITGB7 substitution, we considered a 34-Mb segment (476 markers from markers ARS-BFGL-NGS-69702 to ARS-BFGL-NGS-7850) centered on the 15.9 IBD segment shared by the bulls ELEVATION and ELTON, which were (i) heterozygous carrier of the H5P25 haplotype but wild type for the variant for the former and (ii) double heterozygous for the latter (Fig. 5; Additional file 1: Table S23). For the RFC5 inframe deletion, which was in complete LD with N17P57, we arbitrarily considered a 5-Mb segment centered on the inframe deletion (105 markers from Hapmap34428-BES2_Contig387_701 to BTB-00682446). See Additional file 1: Table S2 for information on the marker map. Using 272,326 Holstein cattle genotyped for the ITGB7 variant and 53,263 Normande cattle genotyped for the RFC5 variant, we created a bank of long-size haplotypes associated with either the ancestral or the mutant allele. If a long-size haplotype was not associated with only one allele, it was considered dubious and eliminated. We then proceeded to genotype imputation for 789,594 and 127,783 animals, respectively. Animals with one or two long-size haplotypes unknown in the haplotype bank were not considered. This procedure has been designed to reduce imputation errors to a level close to zero. Finally, we generated a database of 585,671 ITGB7 genotypes in Holstein and 164,291 RFC5 genotypes in Normande cattle with 1.15 and 2.08 ratios of imputed/real genotypes, respectively. Imputation was not required for the NOA1 frameshift insertion as it has been genotyped since 2013.
Analysis of survival based on genotype for candidateTo verify the causality of the ITGB7 and NOA1 variants, a first analysis of the proportions of animals still alive at 2 years of age or that died or were slaughtered before was performed for each combination of variant genotype × haplotype status (Additional file 1: Tables S24 and S34). This analysis was not performed for the RFC5 inframe deletion because of its complete LD with the N17P57 haplotype. In addition, for the three genotypes of each variant, we calculated the proportions of animals still alive at 6 years of age or that died or were slaughtered before, and their repartition per trimester (Additional file 1: Tables S27, S31 and S35).
Effects of the ITGB7, RFC5 and NOA1 variants on various traitsThe effects of heterozygosity or homozygosity at the ITGB7 substitution were estimated for 14 traits routinely recorded for evaluation purposes using the same model as for the haplotypes (see above; Additional file 1: Table S26), for age at first insemination and age at first calving (Additional file 1: Table S25), and for birth weight (Additional file 1: Table S30). Only the latter phenotype was analyzed for RFC5 and NOA1 due to insufficient numbers of homozygous mutant females with insemination and production record available.
Estimation of the proportion of NOA1 homozygous mutants that died during embryonic development and between birth and genotypingThe conception rate (CR; i.e., the proportion of successful AI) was calculated for mating between males and females heterozygous for the NOA1 frameshift variant (1*1) and for mating between wild type parents (0*0) at two developmental stages (heifers and primiparous cows; Additional file 1: Table S32). The CR was expressed as a proportion of the CR observed in control mating for each female category (Centered_CR). The proportion of embryonic lethality among homozygous mutant conceptuses was calculated as (Centered_CR_0*0 − Centered_CR_1*1)/0.25, assuming that 25% of the conceptuses from at-risk mating are expected to be homozygous mutants, and full penetrance of embryonic lethality in the latter group. In parallel, we counted the proportion of each genotype observed in the offspring of heterozygous parental pairs and estimated the proportion of homozygous mutants genotyped out of the proportion expected according to Mendelian rules. These two values were used to derive the proportion of homozygous mutants that were born but died before reaching the age of genotyping (see Additional file 1: Table S33 for more information).
Pathophysiological examinationITGB7, RFC5, and NOA1 homozygous mutant cattle aged 2 months to 3 years old and their matched controls were examined on farms. Blood samples were collected for serum and cell content analysis. Some of them were hospitalized for clinical follow-up at the bovine clinic of one of the four French National Veterinary Schools (Ecoles Nationales Vétérinaires de France, ENVF). During this time, routine blood analyses (hematology and biochemistry) and specific dosages (beta-hydroxybutyric acid, non-esterified fatty acids, lactate, etc.; see Additional file 1: Table S36) were performed at the central clinical pathology laboratory of each school. Euthanasia and necropsy were performed to identify gross lesions and to obtain tissue samples for further analysis to confirm hypothesized mechanisms of pathophysiology. Details on the number and age of animals considered are provided for each analysis in the figures in the “Results” section and in Additional file 1: Tables S36 and S37.
HemogramBlood was drawn from the jugular vein into 4-mL K 3-EDTA tubes (Venosafe, Terumo, France) and gently mixed by inversion. Tubes were immediately refrigerated at ~ 4 °C until hematologic analysis at the central laboratory of each school. Air-dried blood smears were prepared and stained with a May-Grünwald/Giemsa automated stainer (Aerospray hematology slide stainer cytocentrifuge 7150, Wescor, USA) for microscopic evaluation. Measurements were performed on a Sysmex XT-2000iV analyzer as recommended by the manufacturer, using settings for bovine blood (Sysmex XT-2000iV software v.00–13) [106]. Analyzer-measured variables included red blood cell (RBC) count by impedance (RBC-I) and optical (RBC-O) measurements, hemoglobin concentration (HGB), and white blood cell (WBC) count. Neutrophil, lymphocyte, monocyte, eosinophil, and basophil counts were determined from 100 leukocytes counted per oil immersion field (1000 ×). The percentages of each cell type were determined and the corresponding cell counts were calculated from the WBC.
Metabolite analysisAnticoagulated tubes were centrifuged within half an hour to prevent further exchange of analytes between blood cells and plasma. One milliliter of EDTA blood was mixed with 6% (w/v) perchloric acid for the determination of lactate. Biochemical analyses were performed on a Konelab 30 (Thermo Fisher Scientific Inc., USA) using reagents from the same company, except for the determination of plasma lactate (Diasys Diagnostic Systems, Germany) or GLDH (Roche Diagnostic, Switzerland). Plasma troponin I concentration was determined by Immulite 2000 (Siemens, Germany). The HClO4 extracts were neutralized with 20% (w/v) KOH before analysis according to [107]. Biological parameters were compared with reference samples prepared from healthy animals according to ASVCP recommendations [108].
Quantification of CD4 + mem a4 + b7 + T cells in the jejunal lamina propria using flow cytometryOne gram of small intestinal wall in the jejunal loop from heifers (n = 3 homozygous mutant and 5 wild type) aged 1.5 to 3 years was washed in cold PBS, cut into 0.5 cm pieces, incubated four times in 30 mL of PBS 3 mM EDTA (Sigma-Aldrich), and digested in 20 mL of DMEM added with 20% FCS and 100 U/mL of collagenase (Sigma-Aldrich) for 40 min at 37 °C. Jejunum LP mononuclear cells were isolated on a 40–80% Percoll gradient after centrifugation at 1800 g for 15 min at room temperature. Then, 1–2 × 10⁶ mononuclear cells were resuspended in HBSS, 0.5% BSA, and 10 mM Hepes. Cell viability was assessed using Viobility 405/520 Fixable Dye (Miltenyi Biotec, Germany). Incubation with the antibodies was performed at 4 °C for 30 min in the dark. The antibodies used were CD4-PB (clone CC8, Biorad, Hercules, USA), CD45-FITC (clone 1.11.32, Biorad), CD45R0-A647 (clone IL-A116, Biorad), Beta7-RPE (clone FIB27, Biolegend, San Diego, USA), and Alpha4-PECy7 (clone 9F10, Biolegend). Data were collected on a MACSQuant® Analyzer (Miltenyi Biotec) and analyzed using Flowlogic software (Miltenyi Biotec).
Light microscopyShoulder skin samples from four heifers homozygous for the RFC5 inframe deletion and four matched controls were fixed in 10% neutral buffered formalin for 24 h at + 4 °C, and then dehydrated in a graded ethanol series (30 to 100%), cleared in xylene, and embedded in paraffin wax. Longitudinal microtome Sects. (5 µm, Leica RM2245) were mounted on adhesive slides (Klinipath-KP-PRINTER ADHESIVES), deparaffinized, and stained with a Roan solution (nuclear fast red, orange G, and aniline blue). Slides were digitized with the Pannoramic Scan 150 and analyzed with CaseViewer 2.4 software (3D Histech). The number of hair follicles in a randomly selected 1 mm2 square and the diameter of the pilary canal of 50 adjacent hair follicles were measured for each animal (Additional file 1: Table S29).
Transmission electron microscopyLeft ventricular heart samples from three heifers homozygous for the NOA1 frameshift variant and three matched controls were fixed with 2% glutaraldehyde in 0.1 M Na cacodylate buffer pH 7.2, for 4 h at room temperature. The specimens were then contrasted with oolong tea extract (OTE) 0.2% in cacodylate buffer, postfixed with 1% osmium tetroxide containing 1.5% potassium cyanoferrate, dehydrated in a graded ethanol series (30% to 100%), and embedded in Epon, after the ethanol was gradually replaced by ethanol-Epon mixtures. Thin Sects. (70 nm) were collected on 200 mesh copper grids and counterstained with lead citrate. The grids were examined on a Hitachi HT7700 electron microscope operated at 80 kV (Milexia, France) and images were acquired using a charge-coupled device camera (AMT).
Analysis of mitochondrial/nuclear DNA ratio by quantitative PCRAfter preliminary testing focused on specificity and efficiency of amplification, two sets of mitochondrial and nuclear genes were selected with primer pairs showing similar slope (CYTB and PPIA, and COX1 and RSP24, respectively; Additional file 1: Tables S3 and S38). Quantitative PCR was performed in triplicate on a QuantStudio 12 K Flex Real-Time PCR System (Thermo Fisher Scientific) for five homozygous carriers of the NOA1 frameshift insertion and five matched controls. The reaction mixture contained 10 μL 2X SYBR Green PCR Master Mix (Thermo Fisher Scientific), 1 ng total DNA extracted from myocardial samples, and 300 nM forward and reverse primers, in a total volume of 20 μL. For each animal, the ∆Ct(CYTB-PPIA) and ∆Ct(COX1-RSP24) values were calculated based on the mean cycle threshold (Ct) of the triplicates. Finally, the 2−∆∆Ct(CYTB−PPIA) and 2−∆∆Ct(COX1−RSP24) were used as two different indicators to measure the relative changes in the ratio of mitochondrial to nuclear DNA between the case and control groups.
留言 (0)