
記住我
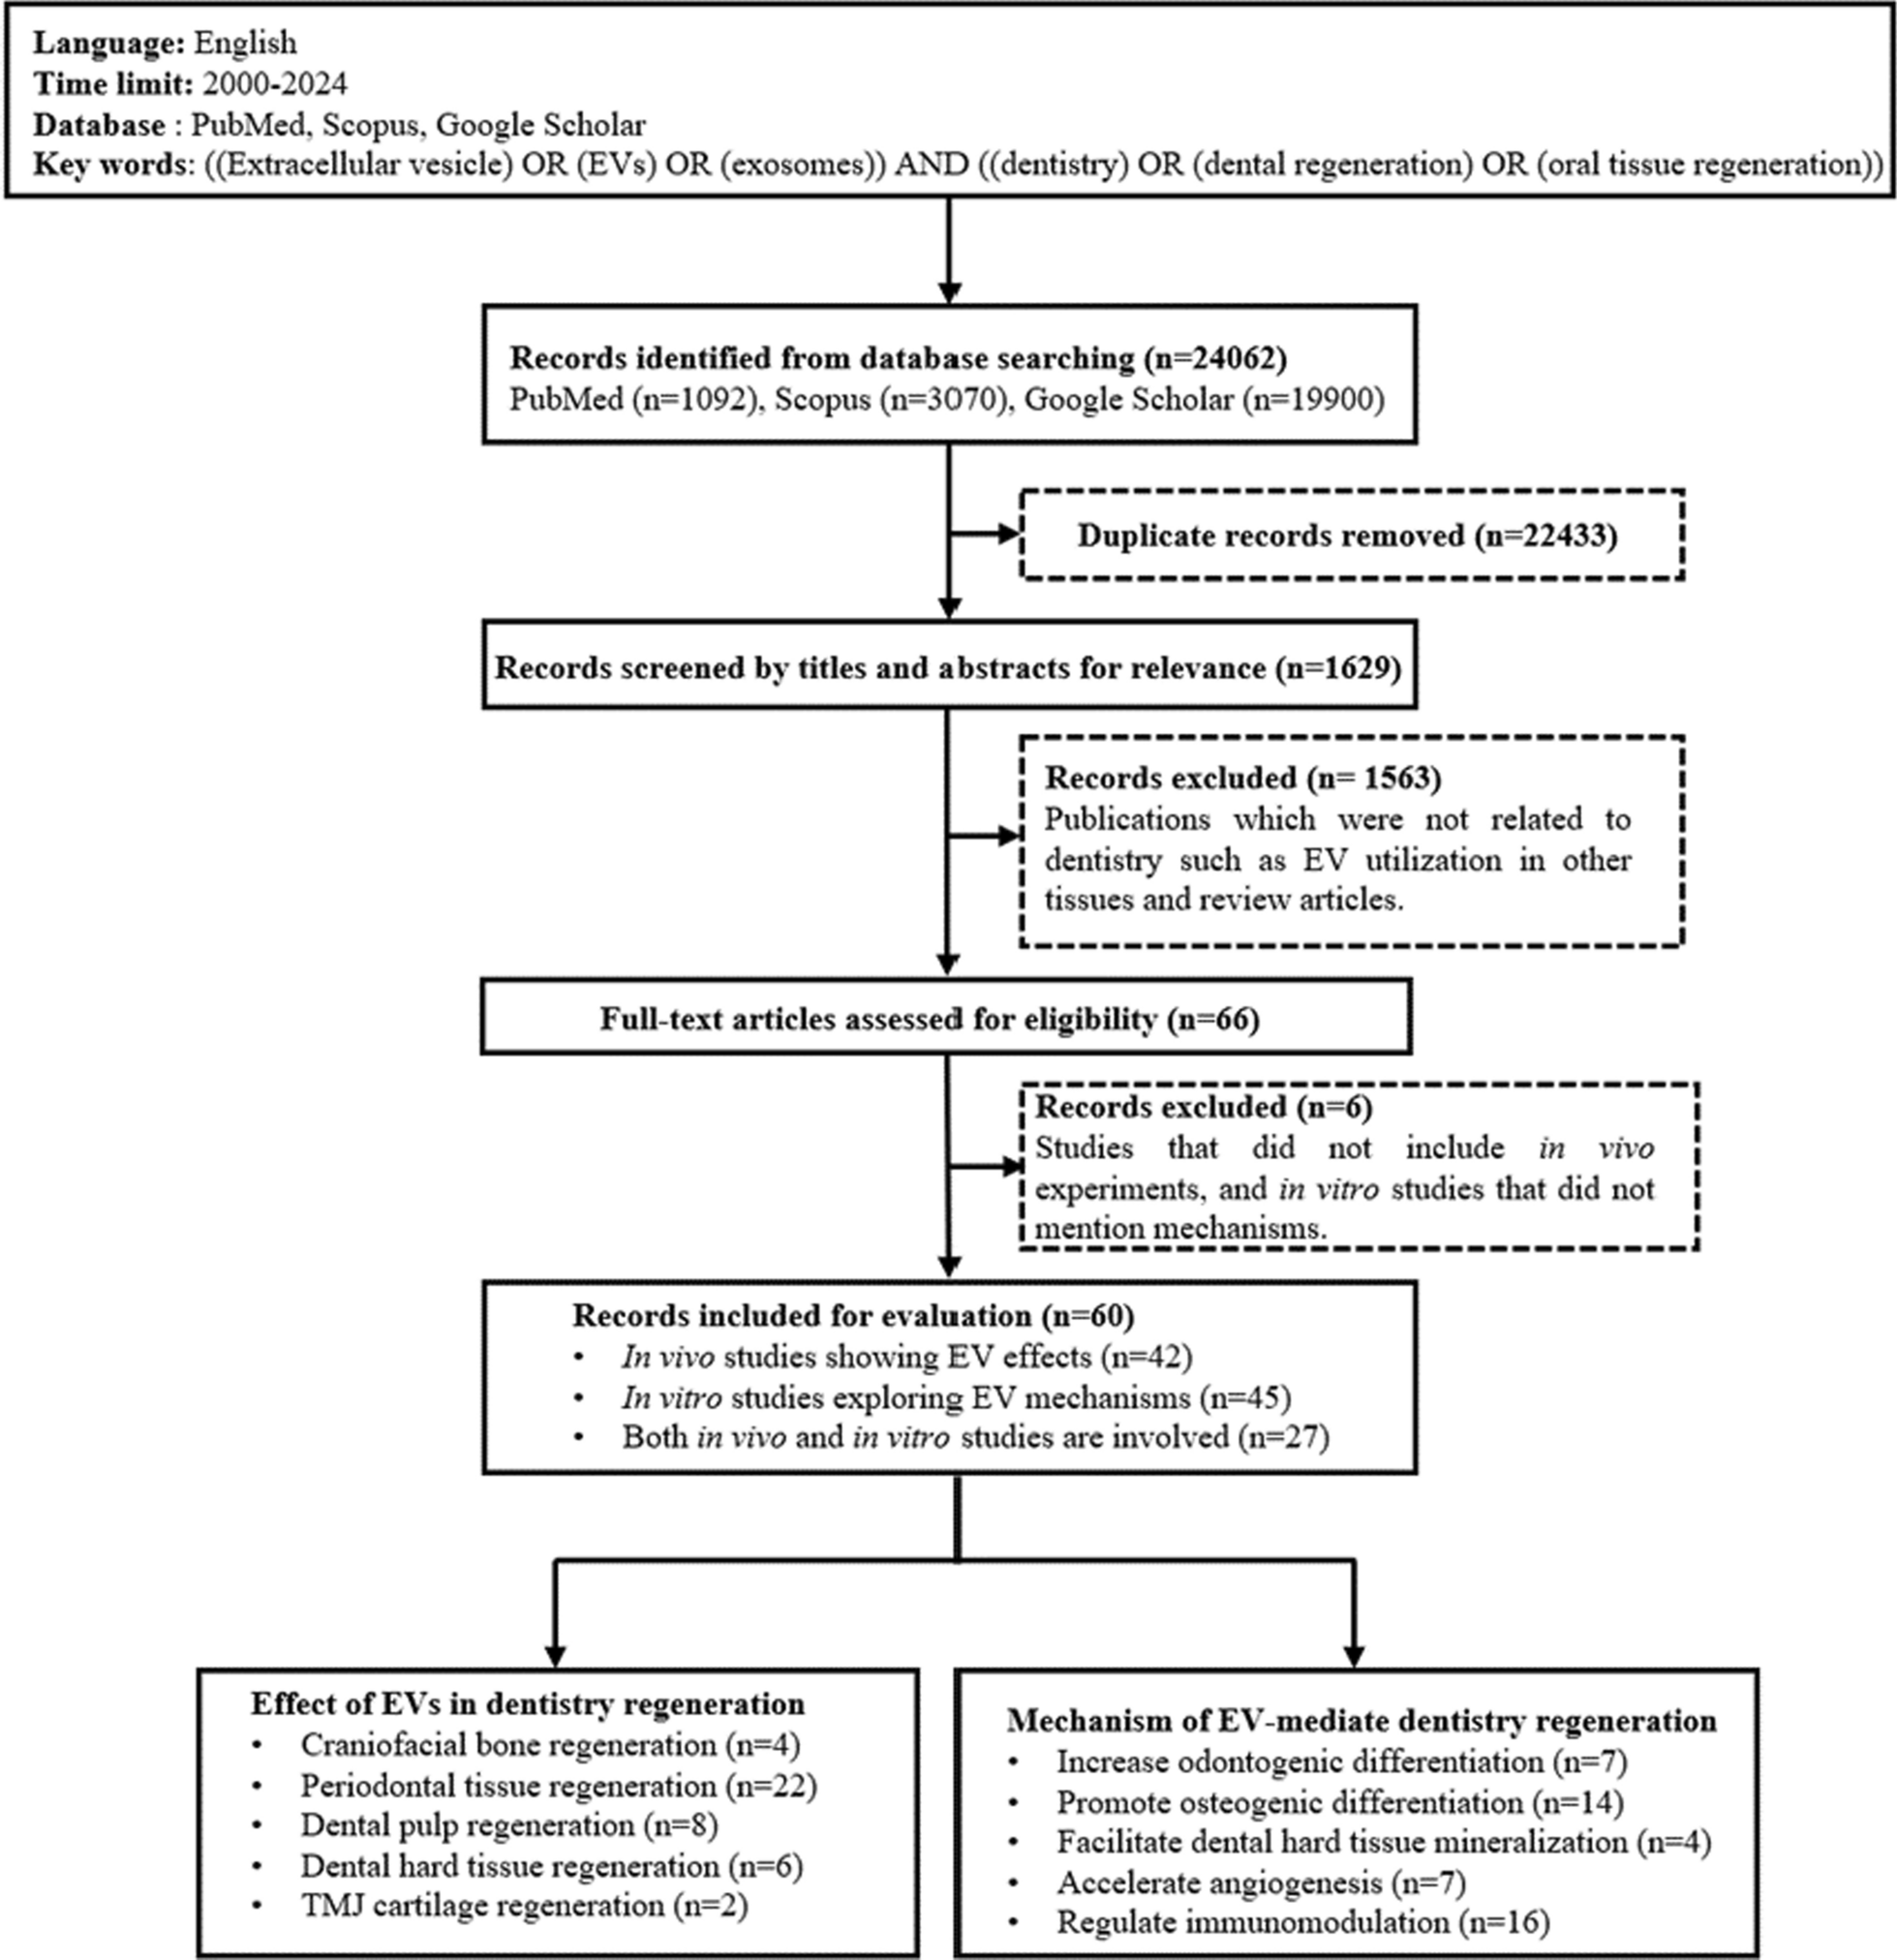


PNSC spheroids were produced through a suspension culture technique, and their efficacy was subsequently evaluated. To investigate the advantages of multiple administrations of PNSC spheroids, rats were subjected to TBI induction. Behavioral assessments were performed at predetermined intervals to track recovery progress. At 6 weeks post-induction, the rats were euthanized to allow for extensive analyses, which included histological examinations, magnetic resonance imaging (MRI) scans, and immunofluorescence staining to assess functional recovery (Fig. 1).
Fig. 1
Experimental Design Overview.A: Illustration of the peripheral nerve (PN) isolation process. B: Diagram detailing the preparation of peripheral nerve-derived stem cell (PNSC) spheroids via suspension culture. C: Overview of the methods employed to assess the therapeutic efficacy of prepared PNSC spheroids. D: Timeline and strategies for spheroid administration and subsequent evaluations post-traumatic brain injury (TBI). E: Categorization scheme utilized to examine the therapeutic impact of PNSC spheroids, based on injection frequency and the administered volume for each experimental group. F: Depiction of TBI model creation, including a schematic of the injection technique and the specific brain tissue sections selected for injury site analysis. [Figure created with BioRender.com]
Tissue and reagentsFollowing the approval of the Institutional Review Board of Inje University College of Medicine (IRB No. 16–0147), surplus sciatic tissue from brain-deceased organ donors was acquired. For this study, the donors’ guardian provided written informed consent for participation in the study and the use of samples. Porcine skin-derived collagen (MS Collagen®) and type I collagenase were obtained from MSBio (Seongnam, Korea) and Worthington Biochemical (Lakewood, NJ, USA), respectively. Growth factors, including recombinant epidermal growth factor (EGF), basic fibroblast growth factor (bFGF), β-nerve growth factor (NGF), and brain-derived neurotrophic factor (BDNF), were sourced from Peprotech (Rehovot, Israel), unless otherwise specified. All culture media, animal sera, and additional culture-related reagents were purchased from Gibco (Carlsbad, CA, USA).
Cell isolation and culturePNSCs were isolated from donated peripheral nerves (PN) utilizing a previously described 3D organ culture method [11]. The epineurium and adjacent connective tissues were meticulously removed under a stereomicroscope. Subsequently, the PNs were finely chopped into 2- to 3-mm segments, rinsed with phosphate-buffered saline (PBS), and then dispersed in a chilled 0.25% neutral collagen mixture. This mixture, consisting of 100 mg of nerve fragments in 10 mL of neutral collagen solution, was transferred to a 100-mm tissue culture dish. It was then left to incubate in a moist chamber at 37 °C for 2 hours, facilitating the formation of a neutral collagen hydrogel that encapsulated the nerve fragments. This setup was further supplemented with 15 mL of organ culture medium containing 100 ng/mL EGF, 20 ng/mL bFGF, and 10 µg/mL gentamicin mixed in Dulbecco’s Modified Eagle Medium/Nutrient Mixture F-12 (DMEM/F12). After a 14-day cultivation period, the collagen hydrogels with embedded PN fragments and proliferating PNSCs were treated with 0.01% collagenase type I at 37 °C. This was done under dynamic conditions on an orbital shaker set to 25 rpm for 30 min to dissolve the hydrogel. The released PNSCs were then collected, centrifuged at 150 × g for 10 min, and resuspended in cell culture medium (DMEM/F12 supplemented with 10 ng/mL EGF, 2 ng/mL bFGF, and 10% fetal bovine serum [FBS]). These PNSCs were then cultured in polystyrene dishes under standard monolayer conditions until they reached 80% confluence. At this point, they were harvested using trypsin-EDTA and replated at a density of 5,000 cells/cm2. PNSCs at the sixth passage (P6) were employed for analyzing transcriptional, immunophenotypic, and biological characteristics and for generating multicellular spheroids (PNSC spheroids) for subsequent transplantation studies, unless stated otherwise. For comparison, bone marrow-derived mesenchymal stem cells (BMSCs) were isolated via established methods [18] to serve as negative controls. Additionally, SH-SY5Y and RAW264.7 cell lines were obtained from ATCC (Manassas, VA, USA).
Suspension cultureAfter treatment with trypsin-EDTA, PNSCs were gathered and resuspended in a suspension-culture medium consisting of DMEM/F12 enriched with 2% human serum albumin. A total of 7.5 × 10⁶ PNSCs were seeded in T75 Ultra-Low attachment cell culture flasks (Corning Inc., Corning, NY, USA). Following a 3-day incubation period, the formed PNSC spheroids were retrieved, rinsed thrice with PBS, mixed with a cryopreservation solution (NutriFreez D10, Sartorius), and subsequently cryopreserved for future use.
ImmunophenotypeThe immunophenotypic characteristics of PNSCs were evaluated using antibodies targeting markers associated with neural crest (NC)-lineage cells, Schwann cells, neuroglia, endothelial cells, and hematopoietic cells (Table S1). Marker expression levels were determined using flow cytometry (FACS Canto™ BD Biosciences, San Jose, CA, USA) or confocal microscopy (Zeiss LSM 510 Meta, Gottingen, Germany). For immunofluorescence analysis of spheroids, paraffin-embedded sections obtained 1, 2, and 3 days post-culture were incubated overnight at 4 °C with primary antibodies. Following this, sections were treated with isotype-specific secondary antibodies conjugated with Alexa Fluor and incubated at 37 °C for 30 min. Nuclei were stained using 2 µg/mL diamidino phenylindole (DAPI; Invitrogen, Waltham, MA, USA), and sections were mounted with ProLong® Gold antifade reagent (Invitrogen). For direct immunophenotyping, approximately 2 × 10⁵ PNSCs were incubated with primary antibodies, followed by labeling with Alexa Fluor-conjugated anti-mouse, anti-rabbit, or anti-goat IgGs. The analysis was performed on a minimum of 10,000 events and 3,000 cells to ensure robust data.
mRNA expressionThe transcriptional profiles of PNSCs were analyzed through reverse-transcription polymerase chain reaction (RT-PCR). Total RNA from BMSCs, PNSCs, and PNSC spheroids was extracted using TRIZOL-reagent® (Molecular Research Center Inc., Cincinnati, OH, USA), adhering to the provided protocol. The RNA concentration was measured with a NanoDrop® ND-1000 spectrophotometer (Thermo Fisher Scientific, Wilmington, DE, USA). Subsequently, 1 µg of RNA was reverse-transcribed into first-strand cDNA using random primers and SuperScript® VILO™ (Invitrogen), in a GeneAmp 2400 PCR thermocycler (Applied Biosystems, Carlsbad, CA, USA). The cDNA synthesis conditions were set to 10 min at 25 °C, 50 min at 42 °C, and 15 min at 70 °C, before cooling to 4 °C. The expression of neurotrophic factors in BMSCs, PNSCs and PNSC spheroids was evaluated using a predesigned PCR array (Human Cytokine Primer Library I (HCA-1), Real Timer Primers LLC, Elkins Park, PA). Quantitative real time PCR was carried out using SYBR Green Master Mix for qPCR (Applied Biosystems) and analyzed by an ABI Prism 7000 system (Applied Biosystems). The utilized program was as follows: an initial denaturation stem for 2 min at 95℃, and 40 cycles followed by 15 s at 95℃ and 1 min at 60℃. The genes compared in this research are listed in Table S2. Gene expression for each sample was normalized to beta actin, a housekeeping gene, using the 2ΔΔCt method. The normalized values were then compared to those of BMSCs or PNSCs, processed similarly, to determine relative expression levels. All samples were analyzed in triplicate to ensure data reliability.
Neuroprotective effects and neurite outgrowthConditioned media (CMs) were produced from PNSCs and PNSC spheroids following a 3-day culture period in vehicle medium (DMEM/F12 supplemented with 0.1% calf serum) and subsequently concentrated using Amicon® Ultra-15 centrifugal filter units (Millipore, Billerica, MA, USA). The potential protective effects of these CMs were evaluated in an H2O2-induced cellular injury model. Initially, SH-SY5Y cells (5 × 10⁴ cells) were plated in 48-well plates and cultured for 1 day, followed by treatment with 0.5 mM H2O2 either with or without the addition of CMs. After a 12-hour incubation period, the cells were rinsed with PBS and lysed using CellLytic™ (Sigma Aldrich, St. Louis, MO, USA). Cell viability was assessed using a CyQuant GR dye (Invitrogen). The protective efficacy of CMs was further analyzed by measuring caspase-3/7 activity with fluorogenic substrates (Z-DEVD-aminoluciferin, Promega, Fitchburg, WI, USA). Additionally, the influence of CMs on neurite outgrowth and synaptic formation was investigated. SH-SY5Y cells were cultured on laminin-coated coverslips for 24 h. After fixation, the cells were immunostained with anti-neurofilament antibodies, and analyses of neurite length and synaptic formation were performed using ImageJ software. The analysis quantified the number of synapses per 100 μm of dendritic length to assess each determinant’s contribution.
Anti-inflammatory effectsThe anti-inflammatory properties of CMs derived from PNSCs and PNSC spheroids were evaluated through an assay utilizing RAW264.7 cells. The levels of tumor necrosis factor alpha (TNF-α) and interleukin-1β (IL-1β) secreted by lipopolysaccharide (LPS, Sigma Aldrich)-activated RAW264.7 cells were quantified using immunosorbent assay kit (R&D Systems, Minneapolis, MN, USA). Additionally, the influence of CMs on the polarization of macrophages from the pro-inflammatory M1 state to the anti-inflammatory M2 state was investigated. RAW264.7 cells, stimulated with lipopolysaccharide (LPS, Sigma Aldrich) and interferon-γ (Sigma Aldrich) in the presence or absence of CMs, were analyzed for the surface expression of M1 marker CD86 and M2 marker CD163. This expression was quantified using confocal microscopy to assess the CMs’ potential to modulate macrophage polarization.
Preparation of PNSC spheroidsPrior to their administration to the animals, the cryopreserved vials of PNSC spheroids were rapidly thawed. The spheroids were then collected in alpha-Modified Eagle Medium (α-MEM, Gibco) supplemented with 1% FBS (Gibco) and centrifuged at 1,000 rpm for 3 min. The supernatant was carefully removed, and the concentration of the spheroids was adjusted to a density of 2.0 × 10⁶ cells/µl for injection.
Animals and TBI modeling proceduresAnimal experiments were conducted after receiving approval from the Institutional Animal Care and Use Committee of the CHA University School of Medicine (IACUC-220189). The animal studies were conducted following ARRIVE guidelines (Animal Research: Reporting of In vivo Experiments). Nine-week-old female adult Sprague-Dawley rats (220–250 g) were purchased from Koatech (Pyeongtaek, Korea). We chose female rats because they typically show higher levels of natural antioxidant enzymes compared to males [19, 20], which could enhance recovery outcomes. Additionally, we avoided using male rats due to concerns about aggression when housed together [21]. To minimize stress from environmental changes, the animals underwent a 1-week acclimatization period before being subjected to procedures at the age of 10 weeks. They were maintained in a facility with a 12-hour light/dark cycle, temperature controlled between 22 °C and 25 °C, and humidity maintained at 40-60%, with ad libitum access to food and water.
Prior to the surgical procedure, the rats were anesthetized using a combination of zolazepam and tiletamine (Zoletil, 50 mg/kg, intraperitoneally, Virbac Laboratories, Virbac, France) and xylazine (Rompun, 10 mg/kg, intraperitoneally, Bayer, Seoul, Korea). Preoperative preparation involved shaving the head and disinfecting the surgical area with povidone-iodine and 70% ethanol. A controlled cortical impact (CCI) model for simulating TBI was established using a Precision Impactor Device 68,900II (RWD Life Science, Shenzhen, China). The procedure started with an incision to expose the skull, followed by a 5-mm-diameter craniotomy over the right parietal region, located 3.5 mm posterior to the coronal suture and 2.5 mm lateral to the sagittal suture, performed with a hand drill. The impact was delivered using an impactor tip with a diameter of 4 mm, on the exposed dura mater at a velocity of 4.5 m/s, to a depth of 2.0 mm, with a dwell time of 250 ms [22]. Post-injury, the incision was sutured after achieving hemostasis with sterile gauze and cotton swabs, followed by additional disinfection with povidone-iodine. The animals were then treated with ketoprofen for pain relief, cefazolin as an antibiotic, and saline for hydration. Postoperative care included maintaining the animals on a heating pad set to 39 °C until they fully recovered. Cyclosporine (Cipol-N, Chong Kun Dang Pharmaceutical Corp., 100 mg/L) was administered orally to all animals starting 2 days before the surgery and continuing until 6 weeks post-surgery, at which point the animals were euthanized [23].
Experimental groups and intrathecal injections of spheroidsIn this study, 36 experimental animals were allocated into four groups: (1) sham (n = 8); (2) TBI (n = 8); (3) TBI plus single injection of PNSC spheroids (n = 10, henceforth referred to as the “single injection.” group); and (4) TBI plus triple injections of PNSC spheroids (n = 10, henceforth referred to as the “triple injection.” group) (Fig. 1E).
For the interventions, PNSC spheroids (a total of 2 × 10⁶ cells, approximately 11217.05 spheroids/20 µL per injection) were administered into the intrathecal space. The single inj. group received a one-time injection immediately following the induction of the CCI model (day 0), whereas the triple inj. group was given three injections at 3-day intervals (i.e., on days 0, 3, and 6). Prior to the intrathecal injection, the spheroids were prepared in a Hamilton syringe equipped with a 26G needle. The lumbar region of each anesthetized rat was prepared by shaving and disinfecting with povidone-iodine and 70% ethanol-soaked gauze. The procedure involved locating the space between the fifth and sixth lumbar vertebrae by identifying the most convex bone in the lumbar region and following the pelvic bones towards the spine. The needle was then carefully inserted obliquely into this space, ensuring correct placement by observing a “tail flick” response from the rat. The PNSC spheroids were injected by intrathecal administration at a rate of 10 µL per minute. Upon successful injection, the needle was maintained in place for 1 min to ensure proper delivery, then gently withdrawn, and the site was again disinfected with povidone-iodine.
Behavioral assessmentsModified neurological severity score (mNSS)Neurological function was evaluated using the Modified Neurological Severity Score (mNSS) to assess both sensory and motor capabilities. This scoring system ranges from 0 to 18, where 0 represents normal functionality and 18 signifies maximum impairment. Scores from 1 to 6 are categorized as mild injury, 7 to 12 as moderate injury, and 13 to 18 as severe injury [24]. The mNSS test was performed on days 1, 7, 14, 21, 28, 35, and 42 following CCI induction. The assessment was carried out by two researchers who were blinded to the group allocations, ensuring an unbiased evaluation of the differences among groups.
Rotarod testThe rotarod test was utilized to assess advanced motor skills, including the ability to bear weight and coordinate movements of the hind limbs. For this test, each animal was placed on a rotating cylinder (rotarod), and the duration it could stay atop the cylinder was recorded. The speed of the rotarod was gradually increased from 4 rpm to 40 rpm over a 5-minute period. The test concluded either when the animal fell from the cylinder or managed two consecutive rotations without attempting to walk on the rotating surface, merely clinging to the apparatus. To ensure reliable performance, all animals underwent training for 3 days before the CCI procedure, and rotarod performance was recorded three times the day before surgery to establish an average baseline duration (in seconds). The reported values for the rotarod test are the mean durations across these three trials, which helps to provide unbiased data [25]. Furthermore, the rotarod cylinder was sanitized with 70% ethanol between each trial to eliminate odors and disinfect the equipment.
Magnetic resonance imaging (MRI)To assess the extent of brain injury, brain tissues were harvested 6 weeks after CCI induction and analyzed using T2-weighted MRI with a 9.4 T system (Bruker BioSpec, Billerica, MA, USA). To collect brain tissue, rats were first anesthetized and then euthanized by transcardiac perfusion with saline followed by 4% paraformaldehyde (PFA). After perfusion and fixation in 4% PFA, ex vivo MRI scanning was conducted. T2-weighted images were obtained in the coronal plane using the following parameters: repetition time = 2.5 s, field of view = 25 × 25 mm, slice thickness = 1 mm, matrix size = 128 × 128, and echo time = 76 ms. Each tissue sample scan lasted approximately 10 min. The volume of brain injury was determined by calculating the sum of the lesion areas (in mm²) across three MRI slices (focusing on the slice depicting the largest lesion) and multiplying by the thickness of a slice (1 mm). This analysis was performed using ImageJ software (National Institutes of Health, Bethesda, MD, USA) [26].
Histological analysisAfter perfusion and fixation in 4% PFA, rats were processed into paraffin blocks, and 3-µm-thick sections of the damaged brain tissue were prepared using a rotary microtome. Before histological staining, the slides underwent deparaffinization in xylene and were rehydrated through a graded series of ethanol solutions at concentrations of 99.9%, 95%, 90%, 80%, and 70%.
Hematoxylin and eosin (H&E) stainingH&E staining was conducted to evaluate differences in brain tissue loss. Sections were stained with Harris hematoxylin solution, followed by decolorization with 1% alcohol hydrochloric acid and neutralization in 1% ammonia water. The tissues were then stained with eosin to highlight the cytoplasm, dehydrated through a series of ethanol concentrations (70%, 80%, 90%, 95%, and 99.9%), and cleared in xylene. Finally, coverslips were applied using a lipid-soluble mounting medium (Canada balsam). Digital images of all H&E-stained tissue slides were captured using a digital slide scanner (Zeiss Axio Scan.Z1, Carl Zeiss, Oberkochen, Germany). The areas of the damaged ipsilateral hemisphere (right) and the unaffected contralateral hemisphere (left) were delineated and quantified as a percentage of total area using ImageJ software (National Institutes of Health) [27]. Additionally, live and necrotic neurons in the hippocampal regions CA1 and CA3 were identified and quantified [28].
Luxol fast blue (LFB) stainingLFB staining was performed to assess the extent of remyelination in brain tissue. Following the manufacturer’s instructions provided with the LFB staining kit (Abcam, Cambridge, United Kingdom; #ab150675), tissue sections were immersed in LFB staining solution for 24 h at room temperature. Differentiation was achieved with a 0.05% lithium carbonate solution and 70% ethanol for 5 s, until the gray matter appeared colorless while the white matter retained a blue hue. The neuronal cytoplasm was subsequently stained with cresyl echt violet. Following staining, the sections were dehydrated through a graded ethanol series (70%, 80%, 90%, 95%, and 99.9%) and clarified in xylene. Coverslips were applied using a lipid-soluble mounting medium (Canada balsam). Digital images of the LFB-stained sections were captured using a digital slide scanner (Zeiss Axio Scan.Z1, Carl Zeiss) for analysis. For quantitative assessment, three equally sized regions of interest were selected across the corpus callosum in both the ipsilateral and contralateral hemispheres to evaluate thickness. Analysis was performed using ImageJ software (National Institutes of Health), and results were expressed as a percentage change relative to the contralateral side, with 100% indicating no difference from the contralateral hemisphere [29].
Immunofluorescence stainingFor immunofluorescence analysis, brain tissue sections were rehydrated and underwent antigen retrieval by boiling for 10 min at 95 °C, followed by a 30-minute cooling period in either citrate buffer at a pH of 6.0 (Sigma Aldrich, #C9999-1 L) or Tris-EDTA at a pH of 9.0 (Biosesang, Yongin, Korea; #TR2220-050-90), depending on the specific requirements of each antibody. After antigen retrieval, sections were blocked with a 5% bovine serum albumin (BSA) solution for 1 h at room temperature to prevent nonspecific binding. Primary antibodies were then applied at the recommended dilution in 5% BSA and incubated on the sections for 2 h at room temperature. The sections were then washed three times with 1% Tween 20 in 1× PBS to remove excess primary antibody, followed by incubation with the secondary antibody diluted 1:200 in the diluent for 1 h at room temperature. Nuclear staining was performed by applying DAPI (Thermo Fisher, #D1306) diluted 1:10,000 in Dulbecco’s PBS (DPBS, Cytiva, #SH30028.02) for 10 min after the secondary antibody washing steps. The sections were then washed with PBS-T before mounting the coverslips using a water-soluble fluorescent mounting medium (Dako Fluorescent Mounting Medium, Agilent, Santa Clara, CA, USA, #S3023). Detailed specifications of the primary and secondary antibodies, including the dilution ratios, are listed in Table S1. Digitally scanned images of all stained sections were captured using a digital slide scanner (Zeiss Axio Scan.Z1, Carl Zeiss, Oberkochen, Germany). The qualitative assessment of immunofluorescence involved analyzing images of the lesion site using ImageJ software (National Institutes of Health). This analysis quantified the percentage of the area positive for staining relative to the total area (%) and counted the number of cells with positively stained nuclei or cytoplasm [30, 31]. For the Sholl analysis of microglia, a total of 30 random IBA-1 positive microglia per group were morphologically evaluated. The images were converted from color to binary, and the threshold was manually adjusted until only the cell body and branches of the microglia were visible. The number of microglial branches intersecting each circle was counted, and a Sholl plot was created for each cell. These individual plots were then averaged to obtain an average Sholl plot for each animal [32].
Statistical analysisData obtained from MRI and histological evaluations were processed and analyzed using ImageJ software (National Institutes of Health). The results are presented as the mean ± standard error of the mean. Statistical analysis was performed using one-way ANOVA, with post hoc comparisons made via the Tukey test to identify differences among the groups. Graphical representations of the data and statistical analyses were generated using GraphPad Prism (version 8.0.2, GraphPad Software, La Jolla, CA, USA). A p-value of less than 0.05 was considered to indicate statistical significance. Detailed explanations of the statistical significance and analyses are included in the captions accompanying each figure.
留言 (0)