
記住我


HEK293T was cultured in Dulbecco’s modified Eagle’s medium (DMEM, Gibco) supplemented with 10% fetal bovine serum (FBS, Gibco), 100 U/ml penicillin, and 100 ug/ml streptomycin (Gibco); and incubated at 37 °C with 5% carbon dioxide (CO2). The human monocyte cell line U937 was maintained in Roswell Park Memorial Institute 1640 Medium (RPMI 1640 Medium) medium (Nacalai Tesque, Kyoto, Japan) containing 10% FBS, along with 100 U/ml penicillin, 100 U/ml streptomycin, and 10 mg/mL neomycin, under incubation conditions of 37 °C and 5% CO2. The microglial cell line BV2 cells were cultured in high-glucose DMEM supplemented with 5% FBS and maintained in a 5% CO2 incubator.
Primary microglia were cultured from postnatal day 1 C57BL/6 mice, with brains mechanically dissociated, devoid of meninges and vasculature, and filtered through a 70-um nylon mesh. Tissues were further incubated with 0.25% trypsin (15090046, Gibco) and 1 mg/ml DNase I (10104159001, Roche). The cell suspension was centrifuged for 4 min at 800 rpm using a tabletop microfuge at 37 °C. The pellet was then resuspended in the culture medium. Isolated cells were cultured for 14 days in DMEM/F12 (Gibco) supplemented with 10% FBS. After 10–14 days, when a mixed glia culture is established, flasks were incubated with trypsin solution (0.25% trypsin and 1 mM EDTA in Hank’s balanced salt solution) in DMEM/F12 with a 1:4 dilution, followed by subjected to mild shaking (200 rpm for 2 h) to detach microglia from the astrocyte layer. The supernatant was collected and centrifuged, with the pellet being microglia which were cultured with DMEM/F12 containing 10% FBS. Subsequent experiment was carried out when the primary microglia reached 95% purity.
Detailed information regarding experimental procedures conducted on these specific cell lines can be found in the corresponding sections of the Methods section. Briefly, HEK293T, U937, and BV2 cell lines were transfected with the plasmids of candidate transcription factors in combination with CD200R1 promoter plasmid to elucidate their regulatory roles on CD200R1 promoter activity by luciferase reporter assays (refer to the ‘Luciferase Reporter Assays’ section for detailed protocols). Additionally, HEK293T cells were employed in Electrophoretic mobility shift assay (EMSA) where cells were transfected with NFKB1 expression vectors or control constructs (further details are available in the ‘EMSA’ section). Furthermore, HEK293T cells were transfected with NFKB1-siRNA or a negative control to explore the effects of decreased NFKB1 on CD200R1 expression levels (further details are available in the ‘siRNA and Transfection’ section). Primary microglia isolated from mice with genotypes NFKB1+/+, NFKB1+/-, and NFKB1-/- were utilized to measure basal CD200R1 mRNA in these mice (for methodological details, refer to the ‘Quantitative RT-PCR (qRT-PCR)’ section).
Isolation and culturing of peripheral blood mononuclear cells (PBMCs)The sample collection protocol was approved by the Health Research Ethic Authority of Ruijin Hospital Affiliated to Shanghai Jiaotong University School of Medicine and the written informed consent was obtained from each donor. The isolation method for PBMCs is well-established and validated in our previous work [23]. About 5 ml of blood was collected using BD Vacutainer tubes containing acid-citrate-dextrose anticoagulant. The PBMCs were isolated using Ficoll-Paque gradient centrifugation (MilliporeSigma, USA). The centrifugation was carried out at a speed of 2000 rpm for 20 min at room temperature. The PBMCs were then seeded at a density of 4 × 10⁴ cells per well in 96-well plates for cell-based enzyme-linked immunosorbent assay (ELISA) assay and 2 × 10⁵ cells per well in 24-well plates for mRNA analysis. The cells were cultured in RPMI 1640 Medium (Life Technologies) supplemented with 10% FBS under 37 °C with 5% CO2. Cell viability was assessed with the trypan blue staining.
Gene Silencing with siRNAWe employ siRNA technology to selectively knockdown NFKB1 to elucidate the regulatory influence of NFKB1 on CD200R1 expression in PD. We designed the siRNA sequence targeting the human NFKB1 gene, as presented in Table 1. The negative control siRNA were obtained from RiboBio (Guangzhou, China) and the catalog number is siN0000001-1-10.
Table 1 Primer SequencesaThrough a series of optimization experiments, optimal conditions for siRNA transfection in HEK293T cells were identified as follows. The ideal seeding density was determined to be 2 × 10⁵ cells per well in a 6-well plate. Maximum transfection efficiency was achieved with a 1:1 ratio of siRNA to transfection reagent and a final siRNA concentration of 12.5 pmol/ml. Cells were transfected for 48 h to reach the most effective gene silencing.
For PBMCs, various experiments were conducted to refine the conditions based on the intended applications. For cell-based enzyme-linked immunosorbent assay (ELISA), PBMCs were seeded at a density of 4 × 10⁴ cells per well in 96-well plates, with an siRNA concentration of 9 pmol/ml. For Quantitative RT-PCR, the preferred seeding density was 2 × 10⁵ cells per well in 24-well plates, with an siRNA concentration of 16 pmol/ml per well. In both cases, the transfection efficiency was maximized by using a 1:1 ratio of siRNA to transfection reagent and a transfection period of 48 h.
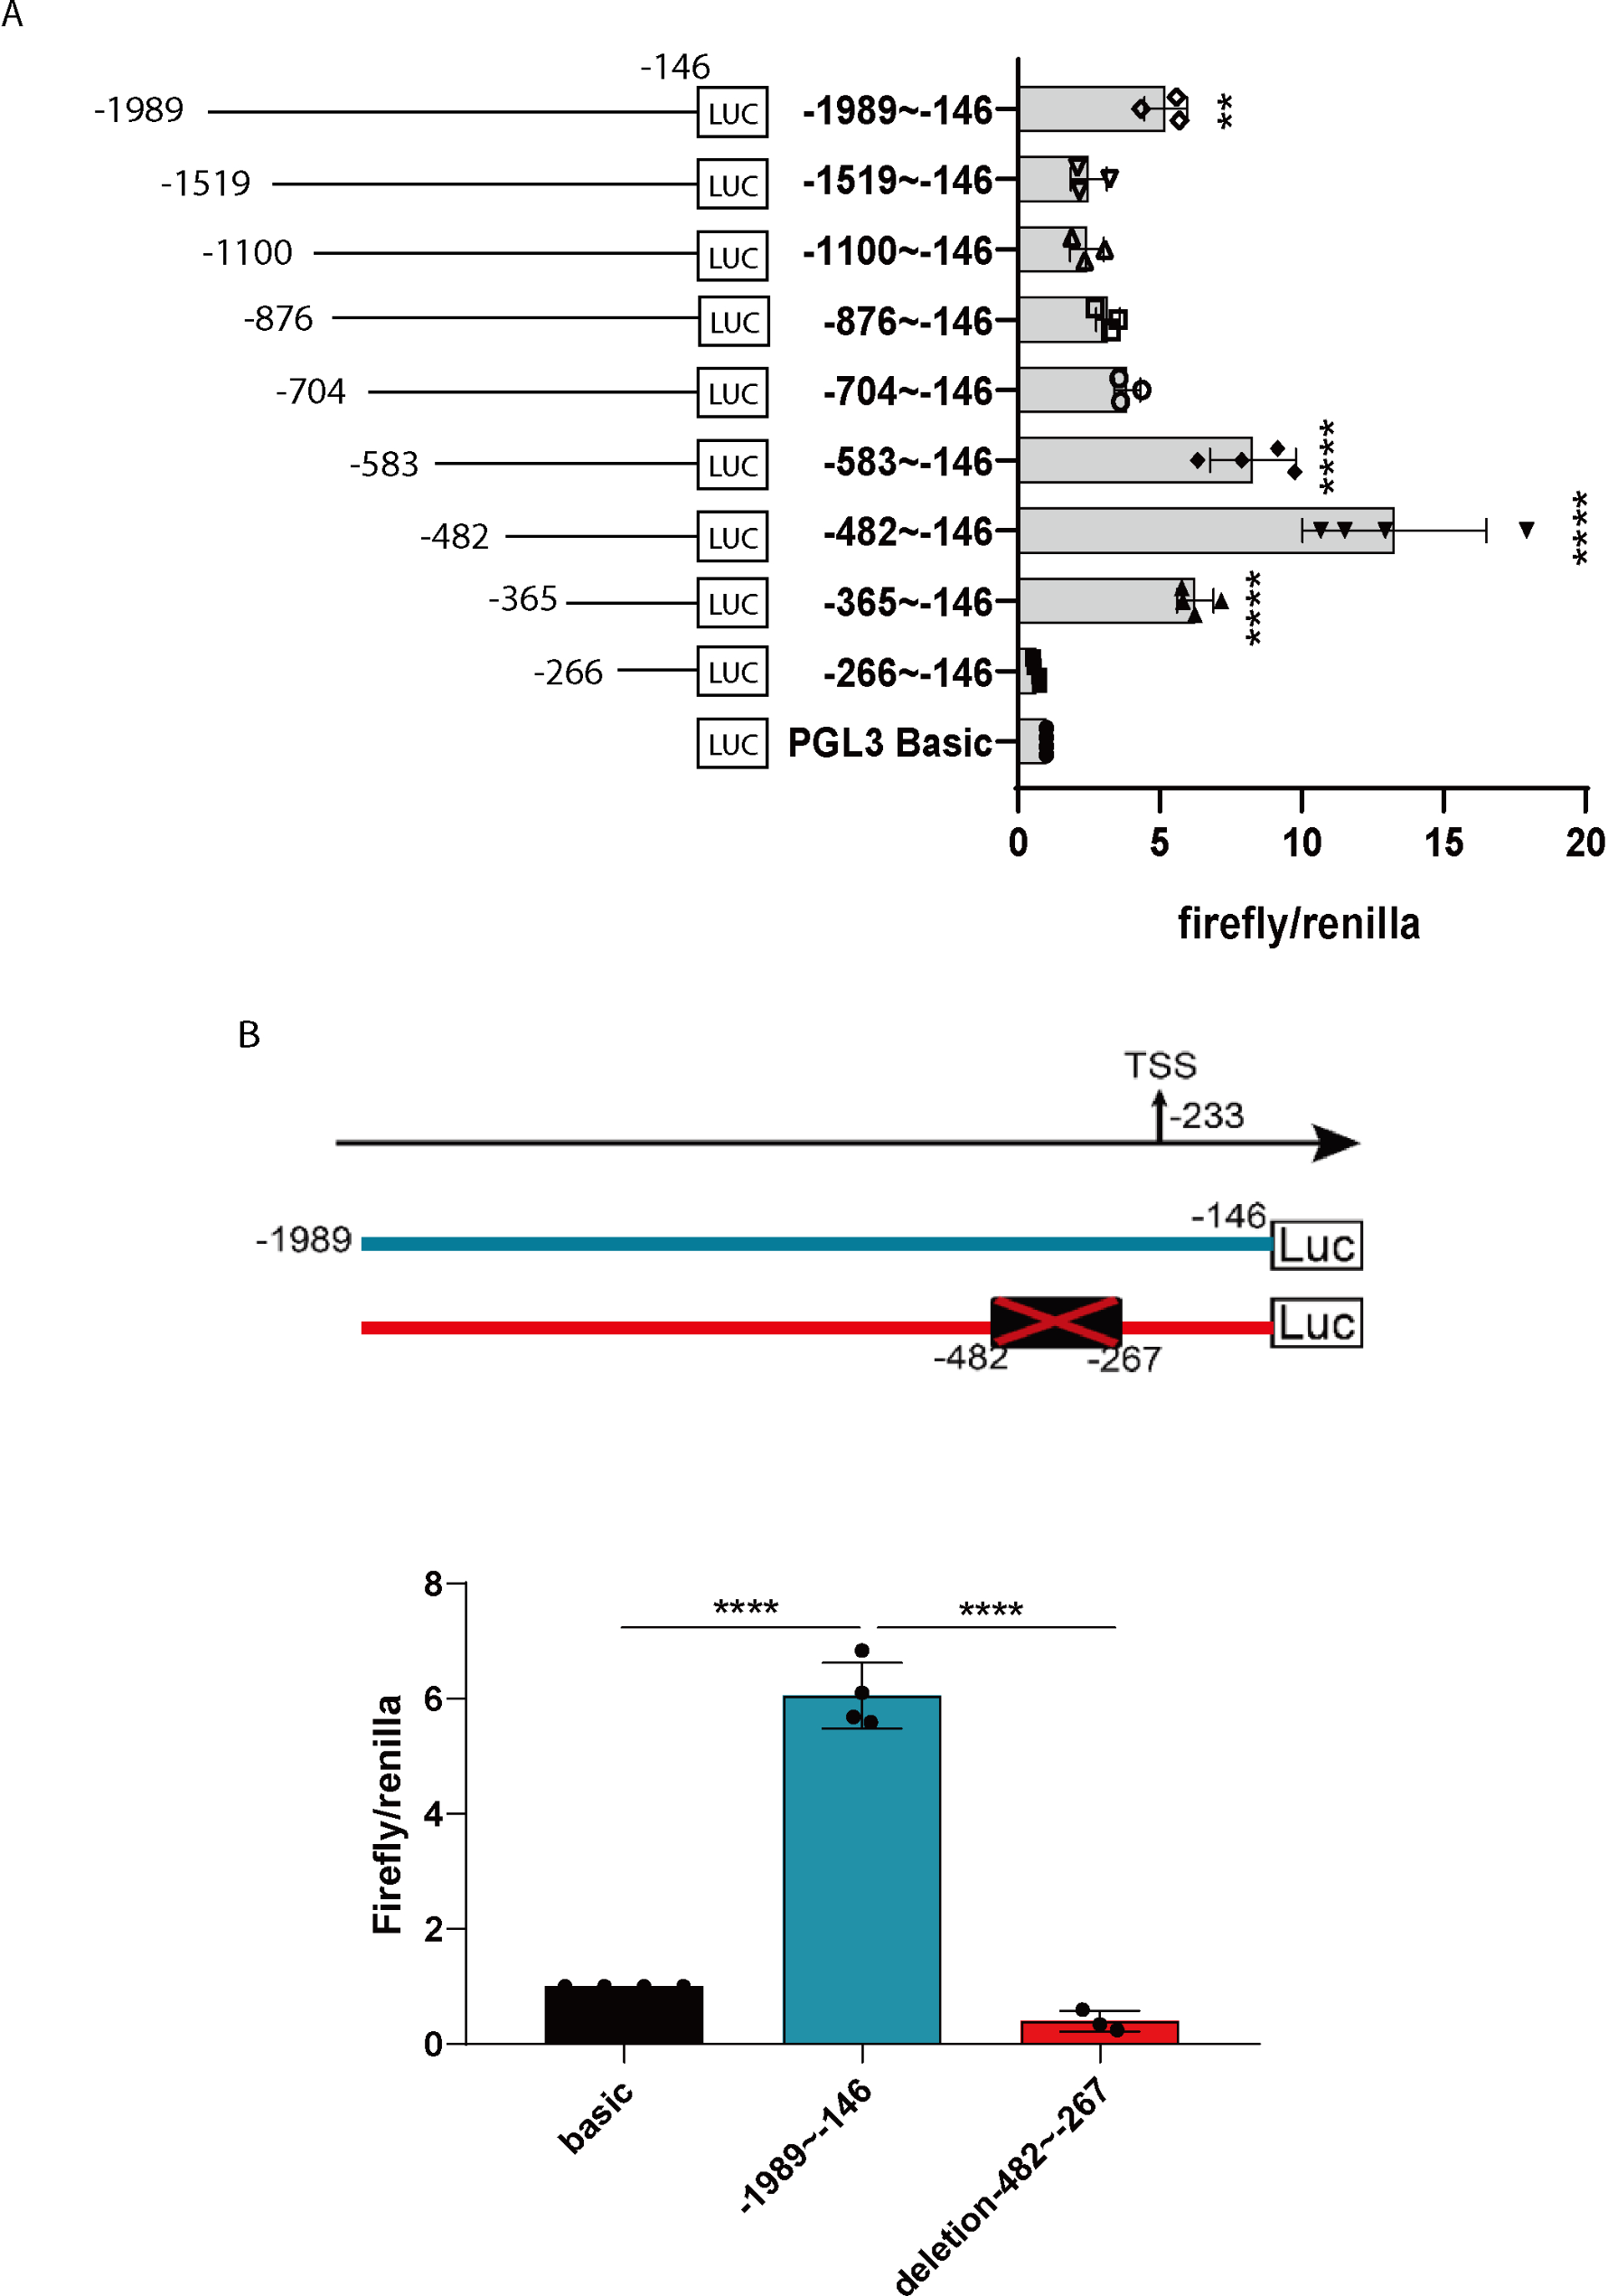
Construction of luciferase reporter gene vectors and luciferase reporter assaysThe luciferase reporter plasmids were constructed following these steps. First, CD200R1 promoter sequences were amplified from HEK293T genomic DNA using PCR. The primers used for amplification can be found in Table 1. The positions of the primers and the lengths of the products are listed in Table 2. A touchdown PCR was employed using a high-fidelity DNA polymerase (Takara, R045A, Dalian, China). This procedure consisted of an initial denaturation step at 94℃ for 3 min, followed by 10 cycles of denaturation at 98℃ for 15 s, annealing from 68℃ to 53℃ with a decrease of 1.5℃ per cycle, and extension at 72℃ for 60 s per cycle. This was followed by 20 cycles of denaturation at 98℃ for 15 s, annealing at 55℃ for 15 s, and extension at 72℃ for 60 s per cycle. Finally, an additional extension was performed at 72℃ for 5 min. The PCR products were then purified and cloned into pGL3-basic luciferase plasmids (Promega, Beijing, China).
For the generation of the plasmic containing the − 1989 to -146 bp promoter fragment with deletion of -482 to -267 bp region, specific primers (CD200R1p Deletion-482 to -267 Forward/Reverse) were designed. One fragment was amplified using “CD200R1p-1989 Forward” as the forward primer and “CD200R1p Deletion-482 to -267 Reverse” as the reverse primer while the other fragment was produced with “CD200R1p Deletion-482 to -267 Forward” as the forward primer and “CD200R1 Reverse” as the reverse primer. CD200R1p Deletion-482 to -267 Reverse” is the reverse primer with the sequence of -502 bp to -483 bp with a 20 bp homologous arm sequence at the 5’ end ranging from − 266 bp to -247 bp. Similarly, “CD200R1p Deletion-482 to -267 Forward” is the forward primer with the sequence of -266 bp to -247 bp with a 20 bp homologous arm sequence at the 5’ end ranging from − 502 bp to -483 bp. The clones were subjected to sequencing analysis to confirm the accuracy of the sequence.
For the luciferase assay, the Firefly luciferase reporter plasmids, which contain various truncated fragments of the CD200R1 promoter, were co-transfected with the Renilla luciferase control plasmid PRL-SV40. The ratio of Firefly to Renilla plasmids used was 49:1. An empty pGL3-basic plasmid was used as the negative control. The expression level of the Firefly luciferase is directly proportional to the promoter activity of the CD200R1 fragments, while the Renilla signal serves as an internal control for variations in transfection efficiency. The transcriptional activity was measured using the Dual-Luciferase Reporter Assay System (Promega, E1980) on a Synergy™ H4 Hybrid Microplate Reader (Biotek, Shanghai, China). Each sample was read in duplicate, and the results were reported as the ratio of Firefly to Renilla luciferase activity.
Quantitative RT-PCR (qRT-PCR)Total RNA was extracted from approximately 1.5 × 10⁵ human PBMCs (initially seeded at a concentration of 2 × 10⁵ cells per well in 24-well plates) or about 5 × 10⁵ mouse primary microglia using the HiPure RNA Mini kit (Magen, Shanghai, China). The quality and concentration of the RNA were confirmed using a Synergy™ H4 Hybrid Microplate Reader (Biotek, Shanghai, China), an A260/280 ratio between 1.9 and 2.1 indicating high purity.
Reverse transcription was performed using the PrimeScript RT reagent kit with gDNA Eraser (Takara) in a 20 µL reaction volume, using 1 µg total RNA, following the manufacturer’s protocol with an incubation at 50 °C for 15 min, followed by 85 °C for 5 s to inactivate the enzyme.
For qRT-PCR, the reaction mixture was consisted of 10 µL SYBR Premix Ex Taq II (Takara, RR420), 5 µL of 10-fold diluted cDNA from the above reverse transcription, 0.2 µM of each primer, and nuclease-free water to a final volume of 20 µL. The 7500 Real-Time PCR System (Applied Biosystems, USA) was used with the following setting: initial denaturation at 95℃ for 30 s, followed by 40 cycles of denaturation at 95℃ for 5 s and annealing /extension at 60℃ for 34 s. The stability of expression of the endogenous reference genes (SRPS6, B2M, HMBS, HPRT1, OAZ1, ACTB, TBP, UBC, 18s_rRNA and GAPDH [24]) in the NFKB1 knockdown PBMC model was analyzed using the online tool RefFinder [25], which integrates the results of analyses performed by four algorithms: the comparative ΔCt method, BestKeeper, NormFinder, and GeNorm. Normalized relative quantities (NRQ) of CD200R1 and NFKB1 were calculated by the 2 − ΔΔCt method [26]. The Coefficient of Variation (CV) of the obtained Ct values for GAPDH was calculated to assess the stability of GAPDH expression across our experimental conditions. The amplicon sizes for relevant qPCR products, validated by agarose gel electrophoresis, are provided in the legend of Table 1.
Chromatin immunoprecipitation (ChIP)-qPCRChIP experiments were conducted on PBMCs using the SimpleChIP Plus Sonication ChIP Kit (Cell Signaling Technology, USA) following the manufacturer’s protocols. Cells were cross-linked with 37% formaldehyde (Sangon, Shanghai, China) for 10 min at room temperature and then quenched with 0.125 mol/L glycine. Chromatin was fragmented by sonication using an Ultrasonic Signal Transmitting Instrument (Xianou, Nanjing, China) equipped with a 1/8-inch diameter microprobe. Sonication parameters were adjusted as follows: 40% of the maximum power output with 1-second on/off pulses for a total of 8 min to achieve the desired fragment size of 200–1000 bp. In our pre-experiments, 30% power for 5 min and 30 min, as well as 40% power for 6 min, were found to be unsatisfactory (Figure S3A).
Sonicated chromatin was incubated overnight at 4 °C with ChIP-grade antibodies, including anti-NFKB1 (CST, #13586) and anti-CREB (CST, #9197) antibodies. Anti-Histone H3 (CST, #D2B12) served as the positive control, and anti-IgG (CST, #2729) as the negative control. The amount of antibody was fixed at 10 µL. For chromatin, the recommended amount was 5–10 µg. Comparative analysis showed that 10 µg of chromatin yielded better ChIP results compared to 5 µg (higher yield of IP DNA). The detailed information can be found on the manufacturer’s website (https://www.cellsignal.com/products/chip-kits/simplechip-plus-sonication-chromatin-ip-kit/56383) or obtained by contacting the manufacturer directly.
The antibody-chromatin complex was incubated with protein A beads at 4 ℃ for 2 h. This was followed by three washes using a low salt buffer, and a final wash with a high salt buffer. All materials were supplied in the SimpleChIP Plus Sonication Chromatin IP Kit. Following the washing regimen, the complex was exposed to an enzymatic digestion process involving 2 uL of proteinase K and 6 uL of 5 M NaCl at an elevated temperature of 65 °C for a period of 2 h. Purified DNA was extracted for qPCR analysis. The qPCR reaction was prepared with 10 µL SimpleChIP® Universal qPCR Master Mix, 2 µL 5 µM primers (sequences provided in Table 1), 20 ng of purified DNA and Nuclease-free H2O up to a final volume of 20 µl. The cycling procedure was set as follows: initial denaturation at 95℃ for 3 min, followed by 40 cycles of denaturation at 95℃ for 15 s and annealing/extension at 60℃ for 60 s. The qPCR was performed using an Applied Biosystems ABI-Q7 instrument. IgG was used as control and IP efficiency was compared based on index of the Percent Input, which was calculated following the formula below: Percent Input = 2% x 2(C[T] 2%Input Sample - C[T] IP Sample)
C[T] = CT = Average threshold cycle of PCR reaction.
Electrophoretic mobility shift assay (EMSA)HEK293T cells were transfected with either the pcDNA3.1 vector or the NFKB1 overexpression plasmid. The overexpression plasmid was constructed using a pcDNA3.1 vector with a CMV promoter and the NFKB1 expression was verified via Western blot analysis (Supplementary Figure S1b). Total protein was extracted and quantified using the BCA Protein Assay Kit (Pierce Biotechnology, USA), with freshly extracted protein yielding a concentration of approximately 5 µg/µL.
The EMSA was performed using biotin 5’-end-labeled complementary oligonucleotides synthesized by Biosune (Shanghai, China; sequences in Table 3). Probes were prepared via annealing, followed by a binding reaction with double-stranded oligonucleotides. Through a systematic exploration of varying concentrations, our optimized condition for binding assays is 2 mg/mL protein and 0.2 µM probe. The incubation time was 30 min at 22℃, in accordance with the standard protocol (GS005, Beyotime). The optimal incubation mix included 2 µL of EMSA/Gel-Shift binding buffer (5X) (GS005, Beyotime), 4 µL of total extracted protein, and 4 µL of labeled probe. We employed a reported sequence with affinity to NFKB1 (GTA GGG GGC CTC CCC GGC TCG AGA TCC TAT G) [27] as the positive control. The negative control was the reaction mixture without protein. The reaction mixtures were separated with electrophoresis on a 5% nondenaturing polyacrylamide gel at a constant voltage of 80 V for 1 h at 4 °C. Subsequently, the DNA-protein complexes were transferred onto a nylon membrane. The membrane was irradiated with a handheld UV detector (EUV002, Beyotime) at a distance of 5–10 cm for at least 20 min.
Table 3 5’-end-labelled complementary oligonucleotides for EMSAaThe membrane was then blocked and washed, followed by incubation with streptavidin-conjugated horseradish peroxidase in accordance to manufacturer’s instructions (https://www.beyotime.com/product/GS009.htm). Visualization was achieved using a chemiluminescent substrate. Chemiluminescent signals were obtained using a ChemiDoc MP system (Bio-Rad, USA) with exposure times set at 1s, 5s, 10s, and 30s. Images characterized by optimal clarity and minimal background noise were chosen for band comparison.
To address normalization, the grayscale value of each lane was divided by that of the positive control lane (with reported probe which can bind to NFKB1). For background subtraction, we first subtracted the grayscale values of the surrounding areas for each lane and then applied the background subtraction feature in Fiji to refine the measurements. For the statistical analysis of EMSA, ANOVA was used to compare the binding affinity ratios across different probes, based on normalized grayscale values.
Cell-based enzyme-linked immunosorbent assay (ELISA) of CD200R1CD200R1 expression in PBMCs was quantified via a cell-based ELISA. Prior to seeding, 96-well plates were coated with poly-lysine, incubated at 37 °C for one hour and then quickly rinsed three times with 200 µL of PBS per well each time. PBMCs were plated at a concentration of 4 × 10⁴ cells per well (detailed seen in “Isolation and Culturing of Peripheral Blood Mononuclear Cells (PBMCs)” section and in “siRNA and Transfection” section). Following transfection with siRNA or a control sequence (detailed in the “siRNA and Transfection Protocol” section), cells were centrifuged at 1,000 rpm for 10 min using a Beckman Coulter Microplus Carrier adapted for rotor GH 3.8, designed for micro-titer plates. Subsequently, supernatants were aspirated and cells were fixed with a 4% paraformaldehyde solution for 30 min at ambient temperature.
After washing each well twice with 200 µL of PBS for 5 min per wash, non-specific binding sites were blocked by adding 5% BSA and incubating at room temperature for 1 h. The cells were then incubated with the anti-CD200R1 antibody (catalog: AF3414, R&D Systems) at a concentration of 0.5 µg/mL in 1% BSA in PBS at 4 °C overnight. The validity of the antibody for ELISA assay was confirmed by the manufacturer with recombinant CD200R1 protein (https://www.rndsystems.com/cn/products/human-cd200r1-antibody_af3414). We did not include specific controls in our experiment. After washing each well three times with 200 µL of PBS, allowing 5 min per wash, a horseradish peroxidase (HRP)-conjugated secondary antibody (A0181, Beyotime, Shanghai, China) was added at a 1:300 dilution in 3% BSA in PBS and incubated at room temperature for 1 h. The plate was then washed three times with 200 µL of PBS per well, each wash lasting 5 min. Afterwards, the plate was added with the substrate 3,3’,5,5’-Tetramethylbenzidine (TMB) for reaction initiation. After incubation at room temperature for 15 min, the reaction was stopped by H2SO4. The absorbance at 450 nm was detected using an ELISA plate reader (Softmax 190, Molecular Devices). After the initial reading, the fixed cells were washed with 200 µL of PBS per well for 30 min and then stained with crystal violet. The reading for absorbance at 598 nm was recorded.
The expression level of CD200R1 was represented by the absorbance ratio of 450 nm/598 nm. Each experiment was performed in triplicate wells and independently repeated three times to ensure the reliability of the results. A series of experiments were carried out before the optimal condition was determined. The primary antibody concentration was set at 0.5 µg/mL, as per the manufacturer’s recommendations. After evaluating a range of incubation times, the most suitable durations were found to be an overnight period at 4 °C for the primary antibody, 1 h at room temperature for the secondary antibody, and 15 min at room temperature for the TMB incubation.
Animals and treatmentsThis study was approved by the Animal Ethics Committee of Shanghai Ruijin hospital affiliated to Shanghai Jiaotong University School of Medicine on June 8, 2018, and the relevant approval document has been provided as an attachment. All animal procedures were conducted in strict adherence to the NIH guidelines and the “Guide for the Care and Use of Laboratory Animals” (8th Edition, 2011), along with our institutional guidelines for animal care and use. The Institutional Animal Care and Use Committee (IACUC) approval documentation is available upon reasonable request, subject to institutional policies and confidentiality considerations. Eight-week-old homozygous NFKB1-/- and NFKB1+/+ (B6,129NFKB11tm1Bal and B6,129 2/J; Jackson Laboratory, Bar Harbor, ME) mice were used in the experiments. The animals were group-housed, three or four per cage, with ad libitum access to food and water. They were maintained in a temperature-controlled environment at 22 ± 2 °C with a 12:12 light-dark cycle, with lights on at 7:00 AM and off at 7:00 PM to provide a precise description of the animals’ circadian rhythm. Regular health checks were conducted by veterinary staff, and all personnel were properly trained and certified.
Mice were randomly divided into four groups, (i) Saline/NFKB1+/+ group: 0.2 ml saline intraperitoneal (IP) injection in NFKB1+/+ mice; (ii) Saline/NFKB1-/- group: 0.2 ml saline IP injection in NFKB1-/- mice; (iii) MPTP/NFKB1+/+ group: 20 mg/kg MPTP IP injection in NFKB1+/+ mice; (iv) MPTP/NFKB1-/- group: 20 mg/kg MPTP IP injection in NFKB1-/- mice.
Prior to treatment, the mice underwent a pre-training phase involving a battery of behavioral tests, including the rotarod test, swim test, and traction test, over a period of five consecutive days (for detailed methodologies, refer to the Behavioral Test section). Following the pre-training phase, the animals received once-daily treatments of either saline or MPTP for five consecutive days, administered between 08:00 and 09:00 in the morning. Subsequently, the swim test and traction test were carried out on the 6th day after the ultimate treatment while the rotarod started on the next day posterior to the final administration, lasting for 6 days. The experimental animals were humanely euthanized at 7 days post-MPTP treatment (Figure S1a).
Each experimental group consisted of 12 mice. The sample size was determined using PASS 2021 software (for detailed methodologies, refer to the Statistic Analysis section). Six mice from each group were used for immunofluorescence, as detailed in the “Tissue Preparation” and “Immunofluorescence and Confocal Microscopy Analysis” section.
Tissue preparationAfter completing behavioral testing, mice were anesthetized with 10% chloral hydrate intraperitoneally (300 mg/kg) [28]. Subsequently, the animals were subjected to intracardiac perfusion. They were first perfused with 100 mL of 0.9% saline solution at a rate of 2.5-3.0 mL/min, immediately followed by 100 mL of 4% paraformaldehyde (PFA, P0099, Beyotime) in 0.1 M phosphate buffer (PB; pH 7.4) at the same flow rate, the procedure which helps clear fluorescent substances and impurities from the blood, thus reducing autofluorescence. Brains were dissected and further fixed with 4% PFA for 48 h. The brains were then placed in 15%, 22.5% and 30% sucrose solutions at 4℃ until they sank to the bottom and afterwards embedded in optimal cutting temperature contained material. These blocks were stored in -80 °C freezer to prevent any degradation until ready for staining. Using a cryostat (Leica), coronal brain sections were obtained from the anterior region to the midbrain. The SN, located between 2.9 mm and 4.1 mm posterior to the bregma, was specifically targeted. To ensure complete coverage of the SN area and avoid missing any part of it, sections were harvested continuously until approximately 2.5 to 4.5 mm posterior to the bregma, as in reference [29]. These sections, sliced at a 20-um thickness, were transferred onto slides and subjected to air-drying at room temperature until securely adhered to the slides.
Immunofluorescence and confocal microscopy analysisBrain sections were thoroughly rinsed with PBS three times for 5 min each, followed by permeabilization in PBS containing 0.5% Triton X-100 for 30 min and antigen retrieval using antigen retrieval solution (P0090, Beyotime) at pH 7.4 and room temperature for 5 min. After three additional PBS washes, sections were blocked with 5% BSA in TBST for 60 min at room temperature. Primary antibodies, anti-tyrosine hydroxylase (TH, AB152, Millipore, https://www.sigmaaldrich.cn/CN/en/product/mm/ab152) and anti-IBA1 (019-19741, Wako, https://labchem-wako.fujifilm.com/asia/product/detail/W01W0101-1974.html) were then applied. The anti-TH antibody has been verified by the manufacturer with positive controls including brain (corpus striatum, sympathetic nerve terminals) and adrenal glands, and a negative control using liver tissue. Additional validation of the antibody was performed using Western Blot analysis. This antibody has also been employed in multiple investigations for detecting dopaminergic neurons in the SN [30,31,32]. Examples of applying anti-Iba1 antibody in immunofluorescence were available on the Wako’s website. Previous study has demonstrated its efficacy in detecting microglial activation in the SN of mice treated with MPTP [33]. These two antibodies have also been validated in our previous publication [34]. We did not include positive and negative controls in our study. The concentrations for these primary antibodies were chosen based on manufacturer recommendations and previous studies. For primary antibodies, we selected concentrations within the recommended range: 1:1000 for TH and 1:1000 for IBA1, as reported in prior studies (for IBA1 [35, 36]; for TH [37, 38]). The incubation was performed overnight at 4 °C (approximately 16 h). Afterwards, sections were washed three 5-minute PBS-T and then incubated with fluorescently labeled secondary antibodies Alexa Fluor 488 (Thermo Fisher Scientific, A-11008, 1:500) and Alexa Fluor 594 (Thermo Fisher Scientific, A-11012, 1:1000), and DAPI (2 µg/mL) for 1 h at room temperature. After five 5-minute PBST washes, the sections were mounted with ProLong™ Diamond Antifade Mountant (Thermo Fisher Scientific, P36961) to minimize photobleaching during imaging.
Confocal imaging was obtained using a Leica TCP SP8 laser scanning confocal microscope (Leica Biosystems) at a 40x magnification. We used a 405 nm semiconductor laser for blue fluorescence, a 488 nm argon laser for green fluorescence, and a 561 nm semiconductor laser for red fluorescence. The excitation and emission bandpass wavelengths were set at 405/420–480 nm (DAPI), 488/505–550 nm (Alexa Fluor 488), and 561/600–650 nm (Alexa Fluor 594). The pinhole size used was 1.00 Airy units (AU). The digital resolution of the acquired images was 1024 × 1024 pixels. To reduce photobleaching during observation, we also utilized a light shield to protect the samples. Imaging times were kept as short as possible for each session. Image acquisition was performed using the Leica Application Suite X. No post-processing steps were performed on the images, as we adjusted the focus and laser intensity before acquisition to meet the requirements for analysis. Image analysis was conducted with Fiji software (http://fiji.sc; software version 2.0.0-rc-68/1.52e). Quantitative analysis of TH-positive neurons or IBA1-positive microglia was conducted on the left side of the SN, consistently chosen for all animals to ensure uniformity and reproducibility. This decision was aligned with previous studies [29] and based on evidence that the MPTP mouse model induces bilateral lesions of dopaminergic neurons [39] and MPTP-induced Parkinsonism in humans is more symmetrical both in clinical manifestations and imaging findings compared to idiopathic Parkinson’s disease [40, 41]. Cell counting was performed using Fiji software, totaling approximately 24 sections per mouse. We did not employ the stereological approach due to equipment limitation. To maintain accuracy, only cells with clearly identifiable nuclei which were TH-positive or IBA1-positive were included in the count. As for the estimation of the collective number of TH-positive neurons, Konigsmark formula was applied. The evaluation was performed independently by two researchers, who underwent unified training to standardize the criteria for identifying TH-positive and IBA1-positive cells. The average of the independent counts was used for analysis.
Behavioral testThe literature describes various well-established behavioral tests for evaluating PD models, such as the rotarod [42,43,44], traction [45], swim [46, 47], open field [48], and pole tests [49, 50]. While effective in assessing motor impairments, each test has its own limitations, and the choice of tests can vary among research teams [51]. In our experiments, we used the traction, swim, and rotarod tests. The traction test assesses forelimb strength and coordination [52] but can be influenced by anxiety or motivation. The swim test measures endurance, motor coordination, and balance, though it may induce stress and miss subtle motor deficits. The rotarod test evaluates balance, coordination, and motor learning [53] but can be affected by factors like body weight and learning effects, and may not detect subtle gait or fine motor control issues. Despite these shortcomings, these tests are widely used in MPTP mouse models of PD, allowing comparison with existing research. Using multiple tests will reduce the risk of bias from any single method and offer a more comprehensive assessment of motor deficits.
The traction test involves gently holding mice by the base of their tails, allowing them to grasp a 5 mm diameter rope with their forelimbs. Upon having a secure grip, the mouse is released, and the time until falls is recorded. The mice were trained familiar with the test for five consecutive days before MPTP injection. The traction test was executed on the sixth day subsequent to the final MPTP injection.
Utilizing the YLS-4 C apparatus from the Academy of Medical Sciences in Shandong, China, up to five mice can be tested simultaneously on a five-lane rotating rod. The test was performed prior to the MPTP injection to establish baseline motor performance. Subsequently, the test was conducted daily for six consecutive days following the final MPTP injection [54]. During evaluation, the rod accelerates from 5 to 20 rpm over 2 min, and the duration each mouse remains on the rod is recorded. This test is repeated three times per mouse with 10-minute intervals to mitigate stress and fatigue.
The swim test was performed in a water tub (length, 40 cm; width, 25 cm; height, 25 cm), filled to a depth of 15 cm with warm water at a temperature of 27 ± 2 °C to avoid hypothermia. The mice stayed in the water tub twice daily for acclimatization for five consecutive days prior to experimentation. The test was executed on the sixth day subsequent to the final MPTP injection. The score system was set as follows: 0, the rear part dips while the head remains above water; 1, intermittent use of hind legs for swimming, with the body tilted to one side; 2, sporadic floating but predominantly engaged in swimming; 3, continuous swimming activity [55]. This test is repeated three times for each mouse, and average scores are calculated for statistical analysis.
Statistical analysisData normality was assessed using the Shapiro-Wilk test, and homogeneity of variances with Levene’s test. The Student’s t-test was used for normally distributed two-group comparisons, and the Mann-Whitney U test for non-normal distributions. For multiple group comparisons, one-way ANOVA was used if normality was met, otherwise, the Kruskal-Wallis H test served as the non-parametric alternative. Pairwise comparisons after ANOVA were conducted using the two-stage linear step-up procedure of Benjamini, Krieger, and Yekutieli to control the false discovery rate (FDR). Effect sizes were reported with p-values, using Cohen’s d for two-group and Cohen’s f for ANOVA comparisons. The correlation between CD200R1 and NFKB1 mRNA expression was evaluated across tissues from the GTEx database, using Spearman’s correlation analysis in R (version 4.0.2), with p < 0.05 considered statistically significant.
Outliers were identified using the Robust Regression and Outlier Removal (ROUT) method with a Q value of 1% and were retained to preserve data integrity. Sensitivity analyses were conducted to assess the robustness of our findings by varying key parameters. This included testing the stability of results with and without outliers and employing alternative statistical models, such as both parametric and non-parametric tests. Post-hoc power analysis was performed using G * Power to evaluate whether the study had sufficient power to detect true effects, based on observed effect sizes, sample sizes, and the specified alpha level. A power above 0.8 (or 80%) indicates more reliable results. Sample size for animal experiments was determined using PASS 2021 software to achieve 90% power, with alpha level set at 0.05. Based on literature data [56], an initial sample size of 10 animals per group was chosen, with an additional 20% to account for exclusions, resulting in a final sample size of 12 per group.
留言 (0)