
記住我


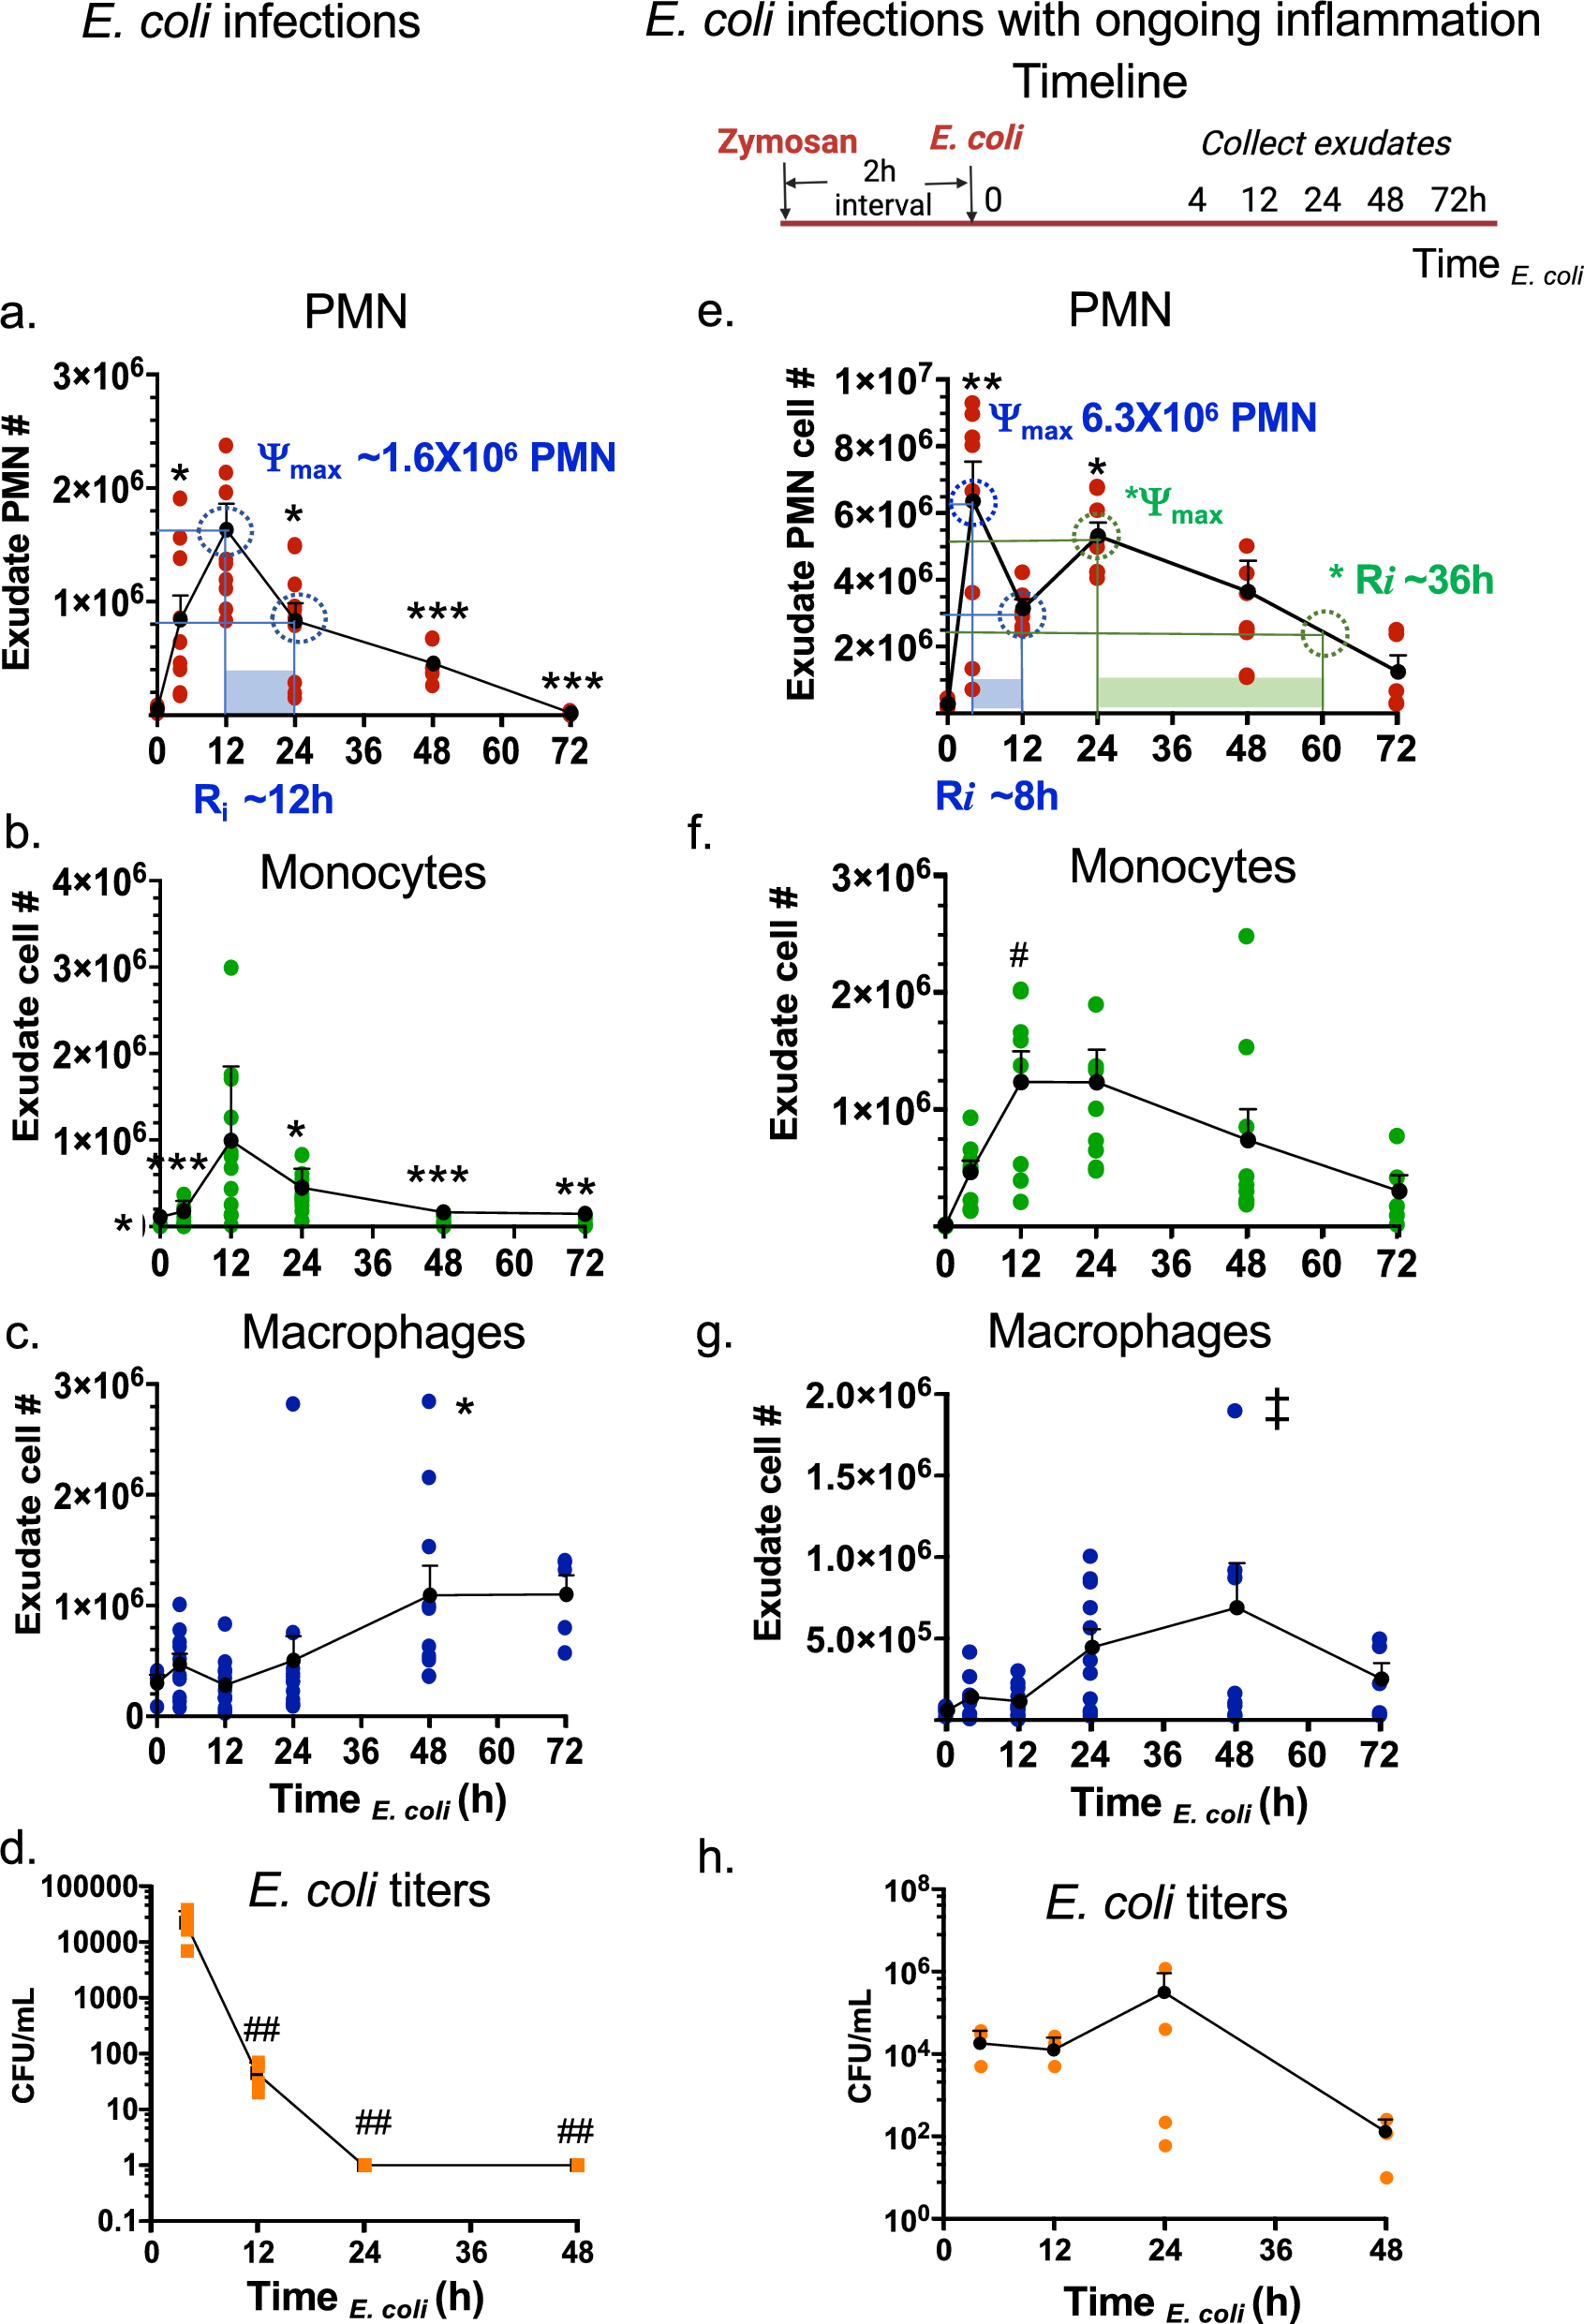


During self-resolving E. coli infectious inflammation, the pro-resolving mediators, i.e., SPMs, are produced and activate endogenous resolution programs (Chiang et al. 2012). Here, we questioned if consecutive challenge with E. coli infection would alter the temporal sequence of SPM production and the resolution programs. To address this, we used a well-established murine peritonitis model (Winyard and Willoughby 2003), relevant to human peritonitis (Moore 1959). Inoculation of E. coli (105 CFU, i.p.) initiated a self-limited innate acute inflammation, characterized by a time-dependent neutrophil infiltration as expected (Fig. 1a and Fig. S1a-b). With these results, we calculated the resolution indices from the present results using equations defined earlier in Schwab et al. (2007). The PMN (CD45 + CD11b + Ly6G + Ly6C-) infiltration into the peritoneum was monitored throughout the time course of the experiments; PMN reached maximum ψmax ~ 1.8 × 10⁶ PMN at 12 h, followed by a rapid decline associated with the resolution response. The resolution interval (Ri) was 12 h (Fig. 1a). The infiltration of monocytes (CD45 + CD11b + Ly6G-Ly6C +) was initially low in numbers at 4 h (Fig, 1b). These monocytes reached maximum at 12 h, and macrophages (MΦ; CD45 + CD11b + F4/80 +) gradually increased between 12 to 48 h (Fig. 1c). In these experiments, exudate E. coli titers were determined and expressed as colony forming units (CFUs). E. coli titers (CFUs) were the highest at 4 h, demonstrating robust infection that was cleared by 12 h (Fig. 1d). These results demonstrated a self-resolving E. coli infection (Fig. 1a–d). These present results are consistent with our earlier findings (Chiang et al. 2012) that enable us to investigate the impact of sequential challenge.
Fig. 1
Resolution intervals for E. coli infections shift with ongoing zymosan inflammation. (a-d) E. coli infection. Mice (C57B6, 6-wk old male) were given saline (1 ml, i.p.) two hours prior to inoculation of E. coli (105 CFU, i.p.). Peritoneal exudates were collected by lavaging at indicated time points (Time E. coli). Total leukocytes were enumerated, and leukocyte composition determined using flow cytometry (see representative dot plots in Supplementary Fig. 1). a Exudate PMN time course and resolution indices (ψmax and Ri, see Methods). b exudate monocyte, c macrophage and d E. coli titer time course. e–h E. coli infection with ongoing inflammation. Timeline: Mice were given zymosan (1 mg/ml, i.p.) two hours prior to inoculation of E. coli (105 CFU, i.p.). Peritoneal exudates were collected by lavaging at indicated time points (Time E. coli). e Exudate PMN time course and resolution indices (ψmax and Ri, see Methods). f exudate monocyte, g macrophage and h E. coli titer time course. a–c, e–g Three independent experiments were carried out and 3-4 mice were used for each time point in each experiment. Results are cell numbers/mouse exudate; mean ± SEM; each dot denotes the value obtained from individual mice. (d,h) One dataset from two independent experiments are shown, and in each experiment, E. coli titers of 3-4 mice for each time point were determined. Results are E. coli titers/mouse exudate; mean ± SEM; each dot is the value obtained from one mouse. (a-d) *P < 0.05, **P < 0.01, ***P < 0.001 vs 12 h; ##P < 0.01 vs 4 h. e–g *P < 0.05, **P < 0.01 vs. 0 and 72 h; #P < 0.05 vs 0 h; ‡P < 0.05 vs 4 h using one-way ANOVA with Tukey's post-test
To gain insight into which of the SPM pathways, i.e., resolvins, protectins or maresins, are most critical to activation of the resolution response, we devised a protocol of ongoing zymosan-induced inflammation followed by E. coli infection (Fig. 1e-h). Next, we challenged mice using self-resolving E. coli peritonitis with ongoing sterile yeast-derived zymosan (Fig. 1e), a classic inflammatory stimulus (Winyard and Willoughby 2003). With zymosan challenge prior to E. coli, PMN infiltration was accelerated with a higher magnitude, reaching maximum ψmax 6.3 × 10⁶ PMN (Fig. 1e and Fig. S1 c-d) following E. coli inoculation, compared to ψmax 1.8 × 10⁶ PMN on E. coli challenge alone (Fig. 1a). PMN numbers then declined to half ψmax at 12 h, giving a resolution interval (Ri) of 8 h (Fig. 1e). In these studies, there was a second increase of PMN numbers with *ψmax 5.3 × 10⁶ PMN at 24 h that gradually declined to half *ψmax at ~ 60 h, thus giving a biphasic response with two resolution intervals Ri = 8 h and *Ri = 36 h. In these exudates, monocytes reached maximum at 12 h, macrophages continued to increase till 48 h then declined (Fig. 1f and g). Exudate E. coli titers reached maximum at 24 h then gradually cleared at 48 h (Fig. 1h). These results demonstrated that a self-resolving E. coli peritonitis initiated during ongoing inflammation was reset temporally, thus shifting the exudate leukocyte numbers, E. coli clearance, and resolution intervals (Fig. S2).
Temporal exudate LM-SPM signature profilesTargeted metabololipidomics profiling was carried out with E. coli exudates from Fig. 1, using mass spectrometry-based lipid mediator metabololipidomics (see Methods), focusing on local-acting lipid mediators including SPMs (Fig. 2 and S3). For identification of exudate lipid mediators, retention times (TR) and prominent MS–MS fragmentation ions present on MS–MS for each eicosanoid and SPM were matched to those obtained with both synthetic and authentic standards, which were in accordance with original published criteria for each molecule (Hong et al. 2007; Serhan and Petasis 2011; Serhan and Chiang 2023; Serhan 2014). Screen captures of the MRM chromatograms for each identified mediator in exudates together with those of validated synthetic standards are shown in Fig. 2. In these experiments, lipid mediators identified in exudates included the arachidonic acid-derived PGE2, LTB4 (both inflammatory (Majno and Joris 2004; Lammermann et al. 2013)) and the resolving mediator LXA4 (Serhan 2007), the eicosapentaenoic acid-derived RvE4 and 18-HEPE, as well as the docosahexaenoic acid-derived RvD1, RvD5, PD1, PDx, MaR1 and MaR2. Each of these pro-resolving mediators is a potent agonist of the resolution of inflammation (Serhan 2007; Fredman and Serhan 2024; Schwab et al. 2007).
Fig. 2

Identification of exudate lipid mediators (LM): SPMs and eicosanoids. Exudate SPMs and eicosanoids were identified using LC–MS-MS-based metabololipidomics (see Methods). Screen captures of MRM chromatograms and MS–MS of identified LMs. For each LM, MRM of exudate LM (top panel) and synthetic standards (middle panel) as well as MS–MS of synthetic standard (bottom panel) are shown. See Fig. S3 for the enlarged MS–MS. The retention time (TR) of individual LM matched that obtained with synthetic standard. In MRM chromatograms, shaded blue areas denote the area under the curve used for quantitation. Dark blue data points indicate where the spectra were collected. a AA-derived LMs. PGE2: TR 8.32 min, MRM of m/z 351 > 189, S/N ratio 643; LTB4: TR 12.58 min, MRM of m/z 335 > 195, S/N ratio 402; LXA4: TR 9.21 min; MRM of m/z 351 > 115; S/N ratio 69. b EPA-derived SPMs. RvE4: TR 10.71 min, MRM of m/z 333 > 115, S/N ratio 159; 18-HEPE: TR 14.22 min, MRM of m/z 317 > 259, S/N ratio 730. c DHA-derived Rvs, PDs, and MaRs. RvD1: TR 10.81 min, MRM of m/z 375 > 215, S/N ratio 39; RvD5: TR 12.14 min, MRM of m/z 359 > 199, S/N ratio 332; 17-HDHA: TR 15.64 min, MRM of m/z 343 > 245, S/N ratio 1,610; PD1: TR 12.31 min, MRM of m/z 359 > 153, S/N ratio 127; PDx: TR 12.16 min, MRM of m/z 359 > 153, S/N ratio 409; MaR1: TR 12.48 min, MRM of m/z 359 > 221, S/N ratio 148; MaR2: TR 14.58 min, MRM of m/z 359 > 221, S/N ratio 269
The MS–MS prominent ions used for identification of eicosanoids and SPMs were as follows and shown in Fig. 2 and S3. After extraction of the peritoneal exudates, targeted LC–MS-MS demonstrated the presence of the arachidonic acid inflammation-resolution metabolome. The MS–MS spectra of exudate LXA4 matched those of both synthetic and authentic LXA4 (Fig. 2a) and consisted of a parent ion at m/z 351 = M-H and ions at m/z 315 = M-H-2H2O, 307 = M-H-CO2, 289 = M-H-H2O-CO2, 271 = M-H-2H2O-CO2, 251 = M-H-CHOH-(CH2)4-CH3 + H, 235 = M-H-CHOH-(CH2)3-CO2, 233 = 251-H2O, 217 = 235-H2O, 199 = 235-2H2O, 189 = 251-H2O-CO2, 135 = M-H-115-CHOH-(CH2)4-CH3, 115 = M-H-CHOH-(CH)8-CHOH-(CH2)4-CH3-H. These ions matched those of LXA4 documented in Clish et al. (2000). In the eicosapentaenoic acid metabolome: 18-HEPE is a SPM and precursor to E-series resolvins (RvE), uncovered in resolving inflammatory exudates (reviewed in Serhan and Petasis (2011); Serhan (2014)). Also, 18-HEPE is a potent bioactive SPM that, for example, prevents maladaptive cardiac remodeling (Endo et al. 2014). The MS–MS spectra of exudate 18-HEPE matched those of authentic 18-HEPE (Fig. 2b) that gave a parent ion at m/z 317 = M-H and daughter ions at m/z 299 = M-H-H2O, 273 = M-H-CO2, 259 = M-H-CHOH-CH2-CH3 + H, 255 = M-H-H2O-CO2, 215 = 259-CO2. The MS–MS spectra of exudate RvE4 matched those of authentic RvE4 (Fig. 2b) that gave a parent ion at m/z 333 = M-H and daughter ions at m/z 315 = M-H-H2O, 271 = M-H-H2O-CO2, 253 = M-H-2H2O-CO2, 235 = CHOH-CH2-(CH)2-CH2-CH3 + H, 217 = M-H-CHOH-(CH2)3-CO2, 199 = 217-H2O, 173 = 235-H2O-CO2, 115 = M-H-(CH)4-CH2-(CH)4-CHOH-CH2-(CH)2-CH2-CH3-H, and matched those of synthetic validated RvE4 (cf. (Serhan et al. 2022) and references within).
In the inflammatory exudate docosahexaenoic acid metabolome, the MS–MS spectra of exudate RvD1 matched those of authentic synthetic RvD1 (Fig. 2c), which MS–MS fragmentation consisted of a parent ion at m/z 375 = M-H and daughter ions at m/z 357 = M-H-H2O, 305 = M-H-CH2-(CH)2-CH2-CH3, 277 = M-CHOH-CH2-(CH)2-CH2-CH3 + H, 259 = 277-H2O, 243 = 305-H2O-CO2, 233 = M-H-CHOH-CH2-(CH)2-(CH2)2-CO2, 215 = 233-H2O, 171 = M-H-(CH)8-CHOH-CH2-(CH)2-CH2-CH3-H, 141 = M-H-CHOH-(CH)8-CHOH-CH2-(CH)2-CH2-CH3-H, 135 = 171-2H2O. These ions matched those of synthetic validated RvD1 documented in Hong et al. (2007). The MS–MS spectra of exudate RvD5 also matched those of synthetic RvD5 (Fig. 2c), consisting of a parent ion at m/z 359 = M-H with the daughter ions at m/z 341 = M-H-H2O, 315 = M-H-CO2, 297 = M-H-H2O-CO2, 289 = M-H-CH2-(CH)2-CH2-CH3-H, 279 = M-H-2H2O-CO2, 246 = M-H-CH2-(CH)2-(CH2)2-CO2, 227 = 289-H2O-CO2, 217 = M-H-CHOH-CH2-(CH)2-(CH2)2-CO2, 199 = 217-H2O, 141 = M-H-(CH)4-CH2-(CH)4-CHOH-CH2-(CH)2-CH2-CH3-H. These ions matched those of authentic RvD5 documented in ((Hong et al. 2007; Serhan and Petasis 2011; Serhan and Chiang 2023) and original references within) and Chiang et al., 2012 (Chiang et al. 2012). 17-HDHA is a SPM and pathway marker of both D-series resolvins and protectins (Hong et al. 2007). The MS–MS spectra of exudate 17-HDHA matched those of synthetic 17-HDHA (Fig. 2c) that gave a parent ion at m/z 343 = M-H with daughter ions at m/z 325 = M-H-H2O, 299 = M-H-CO2, 281 = M-H-H2O-CO2, 273 = M-H-CH2-(CH)2-CH2-CH3-H, 255 = 273-H2O, 245 = M-CHOH-CH2-(CH)2-CH2-CH3 + H, 229 = 273-CO2, 227 = 245-H2O, 201 = 245-CO2 (Fig. 2c). These fragmentation ions (Fig. 2c) matched those of authentic 17-HDHA reported earlier in Hong et al. (2007).
In the inflammatory exudates, we also identified protectins (PD) and maresins (MaR). The MS–MS spectra of exudate PD1 matched those of authentic and synthetic PD1 (Fig. 2c), which gave a MS–MS parent ion at m/z 359 = M-H and daughter ions at m/z 341 = M-H-H2O, 315 = M-H-CO2, 297 = M-H-H2O-CO2, 279 = M-H-2H2O-CO2, 261 = M-H-CHOH-CH2-(CH)2-CH2-CH3 + H, 217 = 261-CO2, 177 = M-H-CHOH-CH2-(CH)2-CH2-(CH)2-(CH2)2-CO2, 153 = M-H-CHOH-(CH)6-CHOH-CH2-(CH)2-CH2-CH3 + H (Fig. 2c). These ions matched those of validated synthetic PD1 as documented in Hong et al. (2007); Serhan and Petasis 2011). PDx is a stereoisomer of PD1 and a double dioxygenation product (Hong et al. 2007; Serhan and Petasis 2011). The MS–MS spectra of exudate PDx matched those of synthetic PDx (Fig. 2c), consisting of a parent ion at m/z 359 = M-H and daughter ions at m/z 341 = M-H-H2O, 315 = M-H-CO2, 297 = M-H-H2O-CO2, 290 = M-H-CH2-(CH)2-CH2-CH3, 261 = M-H-CHOH-CH2-(CH)2-CH2-CH3 + H, 181 = M-H-(CH)6-CHOH-CH2-(CH)2-CH2-CH3-H, 177 = M-H-CHOH-CH2-(CH)2-CH2-(CH)2-(CH2)2-CO2, 153 = M-H-CHOH-(CH)6-CHOH-CH2-(CH)2-CH2-CH3 + H, 137 = 181-CO2. In the maresin pathway, the MS–MS spectra of MaR1 obtained from exudates matched those of synthetic authentic MaR1 (Fig. 2c). These consisted of the parent ion at m/z 359 = M-H and daughter ions at m/z 341 = M-H-H2O, 315 = M-H-CO2, 297 = M-H-H2O-CO2, 250 = M-H-CH2-(CH)2-CH2-(CH)2-CH2-CH3, 246 = M-H-CH2-(CH)2-(CH2)2-CO2, 228 = 246-H2O, 221 = M-H-CHOH-CH2-(CH)2-CH2-(CH)2-CH2-CH3 + H, 177 = 221-CO2, 201 = 221-H2O-2H, 123 = 141-H2O. These fragmentation ions matched those of validated synthetic MaR1 as documented in (Lau et al. 2023 and original references within). The MS–MS spectra of MaR2 identified in the inflammatory exudates matched those obtained from synthetic MaR2 (Fig. 2c), which consisted of a parent ion at m/z 359 = M-H and daughter ions at m/z 341 = M-H-H2O, 323 = M-H-2H2O, 313 = M-H-CO2-2H, 297 = M-H-CO2-H2O, 279 = M-H-2H2O-CO2, 249 = M-H-CH2-(CH)2-CH2-(CH)2-CH2-CH3-H, 221 = M-H-CHOH-CH2-(CH)2-CH2-(CH)2-CH2-CH3 + H, 203 = 221-H2O, 191 = M-H-(CHOH)2-CH2-(CH)2-CH2-(CH)2-CH2-CH3 + H, 177 = 221-CO2, 167 = M-H-(CH)6-CH2-(CH)2-(CH2)2-CO2-2H, 159 = 221-H2O-CO2, 147 = 191-CO2. These fragmentation ions matched those of MaR2 ((Serhan and Chiang 2023) and original reports within).
During self-resolving E. coli infection in the DHA metabolome, RvD5 was present at time 0, increased at 4 h followed by a sharp decline (Fig. 3a and Table S2). By comparison, PD1 gradually increased and reached maximum at 48 h, while levels of PDx, the double dioxygenation product (Serhan 2007) were highest at 4 h. MaR1 was also present at time 0, and gradually reduced between 4-24 h, then reached the highest levels in the resolution phase at 48 h, giving a time course akin to that of macrophages (cf. Figure 1c). EPA-derived RvE4 appeared in resolution phase at 48 h, while AA-derived LXA4 remained from 12-48 h. Prostaglandin and leukotriene levels were also determined; both PGE2 and LTB4 reached the highest levels at 4 h (Fig. 3a), preceding maximal PMN infiltration at 12 h (Fig. 1a). Together, these results established the exudate LM temporal profiles in self-resolving E. coli peritonitis. These present results are consistent with the lipid mediator class switching (Serhan 2007; Liu et al. 2019). The lipid mediator class switch defines the temporal appearance and relation of pro-inflammatory lipid mediators such as PGE2 and LTB4 and their time-dependent switch in LM classes to the pro-resolving LMs, e.g. LXA4, resolvins, protectins and maresins (Serhan 2007).
Fig. 3
Time course of exudate SPMs and eicosanoids. Exudate SPMs and eicosanoids obtained from mice with a E. coli infections and b E. coli infections with ongoing inflammation were each quantified using LC–MS-MS-based metabololipidomics. See Fig. 2 for screen captures of MRM chromatograms of identified SPMs and eicosanoids. Three independent experiments were carried out. In each experiment, 3–4 mouse exudates collected from the same time point were pooled for lipid mediator extraction and LC–MS-MS. Results are expressed as pg/mouse exudate (2 mL); mean ± SEM, each dot denotes the value obtained from one experiment. *P < 0.05 (RvD5), **P < 0.01 (MaR1) vs. 0 h; #P < 0.05 (PDx) vs. 12, 24 and 48 h; +P < 0.05 (PGE2) vs. 0 h, ‡‡‡P < 0.001 (LTB4) vs. 4, 12, 24 and 48 h using one-way ANOVA with Tukey's post-test
We next questioned whether a sterile stimulus zymosan altered these SPM and eicosanoid profiles during E. coli infection. Upon zymosan challenge, select SPMs are rapidly generated, including RvD1, RvD5, MaR1 and PDx (Fig. 3b); RvD5 and MaR1 reached the highest levels at early inflammation phase, i.e. 0-4 h after E. coli inoculation (TE. coli; see Timeline in Fig. 1), and remained in the exudates in the late resolution phase at 48 h (Fig. 3b and Table S3). In comparison, PD1 and LXA4 reached the maximum at TE. coli 12 h then gradually declined. LTB4 levels quickly reached maximum upon zymosan challenge TE. coli 0 h, while PGE2 levels peaked at TE. coli 4 h (Fig. 3b), coinciding with maximal exudate PMNs (Fig. 1e).
PLS-DA was carried out (Fig. 4 and S4) with the identified SPMs in exudates. In E. coli infections with ongoing inflammation, the score plot (Fig. 4c) showed distinct separation of different time points from TE. coli 0-48 h. The loading plot (Fig. 4d) showed correlations where the measured SPMs contributed to the cluster separation in the score plot. For example, in the early time points following sequential challenge, TE. coli 0 h (red) and 4 h (green) clusters were correlated with select SPMs including RvD5 and MaR1 (Fig. 4c, d). The hierarchical clustering Heatmap (Fig. 4e) further indicated clear separation of two SPM clusters: RvD1, RvD5, MaR1, MaR2 and PDx were associated with early time points 0 and 4 h, denoted Cluster I; PD1, LXA4 and RvE4 are associated with later time points 12, 24 and 48 h, denoted Cluster II (Fig. 4e). The Variable Importance in Projection (VIP) scores obtained by PLS-DA showed highest scores for MaR1 and RvD5 in the SPM cluster I (Fig. 4f).
Fig. 4
Exudate SPM profiles and clusters on sequential activation. PLS-DA and heatmaps of a, b E. coli infections and (c-f) E. coli infections with ongoing inflammation. a, c, d Partial Least Squares Discriminant Analysis (PLS-DA) of identified SPMs. a, c The score plot (each dot represents profiles from each time point in each experiment) shows clustering among groups (i.e., time points 0, 2, 12, 24 and 48 h), where closer clusters present higher similarity in the data matrix; d the loading plot demonstrates correlations in which the measured SPMs contribute to the cluster separation in the score plot. b, e The hierarchical clustering heatmaps were generated using normalized data with autoscale features. Euclidean distance was used for distance measure and Ward's method was applied in hierarchical cluster analysis (see Methods). Averages of n = 3 for each SPM in each time point are shown. f Variable Importance in Projection (VIP) score plot of exudate SPMs, depicting the relative levels of each mediator across the 5 experimental groups (0, 4, 12, 24 and 48 h). RvD5 and MaR1 give highest VIP scores > 1. The colored boxes on the right indicate the relative concentrations (red: high, blue: low) of the corresponding SPMs in each group
We also carried out PLS-DA with identified exudate SPMs and eicosanoids including LTB4 and PGE2, which also gave distinct separation of different time points from 0-48 h, as shown in the score plot (Fig. S4). With ANOVA, MaR1, MaR2, RvD5, PDx, 17-HDHA, 18-HEPE, and LTB4 were regulated in a temporal manner from 0-48 h that was statistically significant (P < 0.05; Fig. S4a). Hierarchical Clustering Heatmaps (Fig. S4b) also showed two distinct clusters: (Cluster I) PGE2, LTB4, 18-HEPE, 17-HDHA, RvD1, RvD5, MaR1, MaR2 and PDx associated with early time points 0 and 4 h, and (Cluster II) PD1, LXA4 and RvE4 associated with later time points 12, 24 and 48 h. Together, the metabololipidomics results identified select SPM clusters temporally activated when the host was challenged with E. coli infection during ongoing zymosan-induced inflammation.
Very low dose SPMs program the resolution response in vivoSince zymosan-induced inflammation with subsequent E. coli infections initiated production of a SPM cluster in vivo within the infectious exudates (Fig. 4), we set out to investigate whether repetitive dosing of these SPMs would impact the resolution response. We selected a SPM panel that included RvD1, RvD5 and MaR1 because they were identified in the SPM Cluster I. We also included RvD2 and RvE2 in this panel because RvD2 exhibits potent actions increasing survival as we found earlier in sepsis models (Spite et al. 2009), and RvE2 limits PMN infiltration in sterile inflammation (Serhan and Chiang 2023). SPMs in this panel accelerate resolution of acute inflammation, shortening resolution intervals. For example, in self-resolving E. coli infection reported in Chiang et al. (2012), RvD1 at 50 ng/mouse shortens Ri by ~ 40%. With zymosan peritonitis, earlier results (Arnardottir et al. 2016) showed that RvD2 and MaR1 at 50 ng/mouse each shortened Ri by ~ 75%. In the present experiments, we first carried out zymosan-initiated murine peritonitis where mice were given an SPM panel consisting of RvD1, RvD2, RvD5, MaR1 and RvE2, i.p. at 0.1, 1 or 10 ng each, compared to vehicle control, to emulate the consequence of daily SPM dosing in humans as in Möller et al. (2023); Ramirez et al. 2019). These SPMs were authenticated prior to experiments (Fig. S5); physical properties of each synthetic SPM were examined and compared to published criteria for authentication (Chiang et al. 2012; Serhan and Petasis 2011; Serhan and Chiang 2023; Spite et al. 2009). This SPM panel at dose of 0.1 ng each reduced exudate PMN ~ 25% at 12 h, albeit did not reach statistical significance (Fig. S6). At 1 or 10 ng each, this SPM panel reduced ~ 45 and ~ 65% exudate PMN, respectively (P < 0.05; Fig. S6).
Next, we carried out consecutive treatments with this SPM panel at subthreshold doses (RvD1, RvD2, RvD5, MaR1 and RvE2, 0.1 ng each) for 5 times from days 0–12. On day 12, the subthreshold SPM panel or vehicle control was given together with zymosan to initiate peritonitis. See the timelines of single (1X) and repetitive (6X) SPM dosings in Fig. S7a. At 12–48 h, peritoneal exudates were collected, and cellular composition determined by flow cytometry (see gating strategy and leukocyte compositions in Fig. 5a and Table S4). At 12 and 24 h, a single dose of subthreshold SPMs did not reduce exudate PMN in a statistically significant manner (Fig. 5b). Repetitive SPMs reduced exudate PMN by ~ 45% (P < 0.01) at 12 h, and ~ 60% (P < 0.05) at 24 h (Fig. 5c). Resolution indices were calculated. At 12 h, ψmax was ~ 9.6 × 10⁶ PMN, that reduced to 50% at ~ 28 h, giving a resolution interval Ri ~ 16 h. With repetitive subthreshold SPMs, Ri markedly reduced 75% to only ~ 4 h. The repetitive SPMs did not significantly alter percentages of exudate macrophages (Table S4). These results indicated that low-dose SPM repetitive dosing regimen accelerated resolution of acute inflammation, as evidenced by shortening the resolution interval (Fig. 5c).
Fig. 5
SPM programming in vivo accelerates resolution of inflamm
留言 (0)