
記住我
Solitary fibrous tumor (SFT) represents a form of invasive soft tissue sarcoma (1). Previously grouped with hemangiopericytomas (HPC) under the term "solitary fibrous tumor/hemangiopericytoma" by the CNS WHO in 2016, the classification was revised in 2021, exclusively designating these lesions as SFT (2, 3). Meningioma, the most common adult intracranial tumor, is categorized into three WHO grades (3, 4). Angiomatous meningioma (AM), a grade 1 meningioma, poses diagnostic challenges owing to its histological resemblance to SFT (5, 6). Unlike AM, which generally has a favorable prognosis following surgical resection, SFT often manifests with extracranial metastasis and local recurrence (6–8). Accurate preoperative differentiation between these tumors is paramount for treatment planning.
Magnetic Resonance Imaging (MRI) is a primary tool for evaluating central nervous system malignancies (9). Contrast-Enhanced T1-Weighted Imaging (CE-T1WI) is instrumental in evaluating blood-brain barrier integrity and delineating tumor characteristics. T2-Weighted Imaging (T2WI) is valuable for superior soft tissue resolution in tumor detection (10). Preoperative imaging methods, including the intratumoral flow void sign and apparent diffusion coefficient (ADC) map, have been explored for differentiating SFT from AM (11, 12). However, these techniques are subjective and heavily reliant on radiologist expertise, underscoring the necessity for more objective and quantitative diagnostic approaches.
Radiomics, an emerging field in medical imaging, leverages data-characterization algorithms to extract quantitative features from radiological images, thereby augmenting prognostic monitoring and treatment strategies in oncology (13). Central to this domain, machine learning, particularly deep learning, plays a critical role in feature analysis, significantly contributing to advancements in medical imaging (14). By objectively assessing tumor heterogeneity, radiomics propels the development of precision oncology (15). Numerous studies have demonstrated that its application spans various cancer types, including stomach and esophageal cancers, and extends to intracranial tumors like gliomas and meningiomas (16, 17). In addition, radiomics has proven effective in differentiating between SFT and AM (5, 18, 19). According to Li et al. (19), the area under the receiver operating characteristic curve (AUC) of the CE-T1WI-based radiomics algorithm for distinguishing SFT and AM was 0.90, significantly higher than the AUCs of three neuroradiologists (AUC=0.69, 0.70, and 0.73). Nevertheless, MRI-based radiomics nomograms, integrating both conventional imaging features and radiomics for differentiating SFT and AM, remain underexplored.
Here, our research aims to ascertain the diagnostic performance of MRI-based radiomics nomogram in preoperative differentiation between SFT and AM, using data from four centers to enhance the precision of therapeutic decision-making.
2 Materials and methods2.1 Study participantsThe multicenter study was approved by the Institutional Review Board of our hospital, and written informed consent was waived on account of its retrospective nature. MRI data of SFT and AM were retrieved from picture archiving and communication systems via the radiology database. Patient recruitment occurred at four medical centers: the First Affiliated Hospital of Qingdao University (Medical Center A), Guangxi Medical University (Medical Center B), the Frist Affiliated Hospital of Zhengzhou University (Medical Center C), and Qilu Hospital of Shandong University (Medical Center D), over the time period extending from January 2009 to September 2020. The inclusion criteria were as follows: (1) pathological diagnosis of SFT or AM; (2) preoperative MRI examination performed without image artifacts; and (3) no prior treatment at the initial diagnosis. The exclusion criteria comprised: (1) artifacts on MRI images; (2) previous history of brain surgery or biopsy; and (3) previous history of intracranial diseases, such as subarachnoid hemorrhage or cerebral infarction.
Ultimately, the study comprised 94 patients with SFT and 77 with AM. The training cohort, selected from all of Medical Center A, B and a part of C, consisted of 75 SFT and 62 AM patients (n = 137), while the validation cohort from the remaining part of Medical Center C and D included 19 SFT and 15 AM cases (n = 34). The clinical characteristics of the 171 patients are shown in Table 1. The workflow of this study is illustrated in Figure 1.
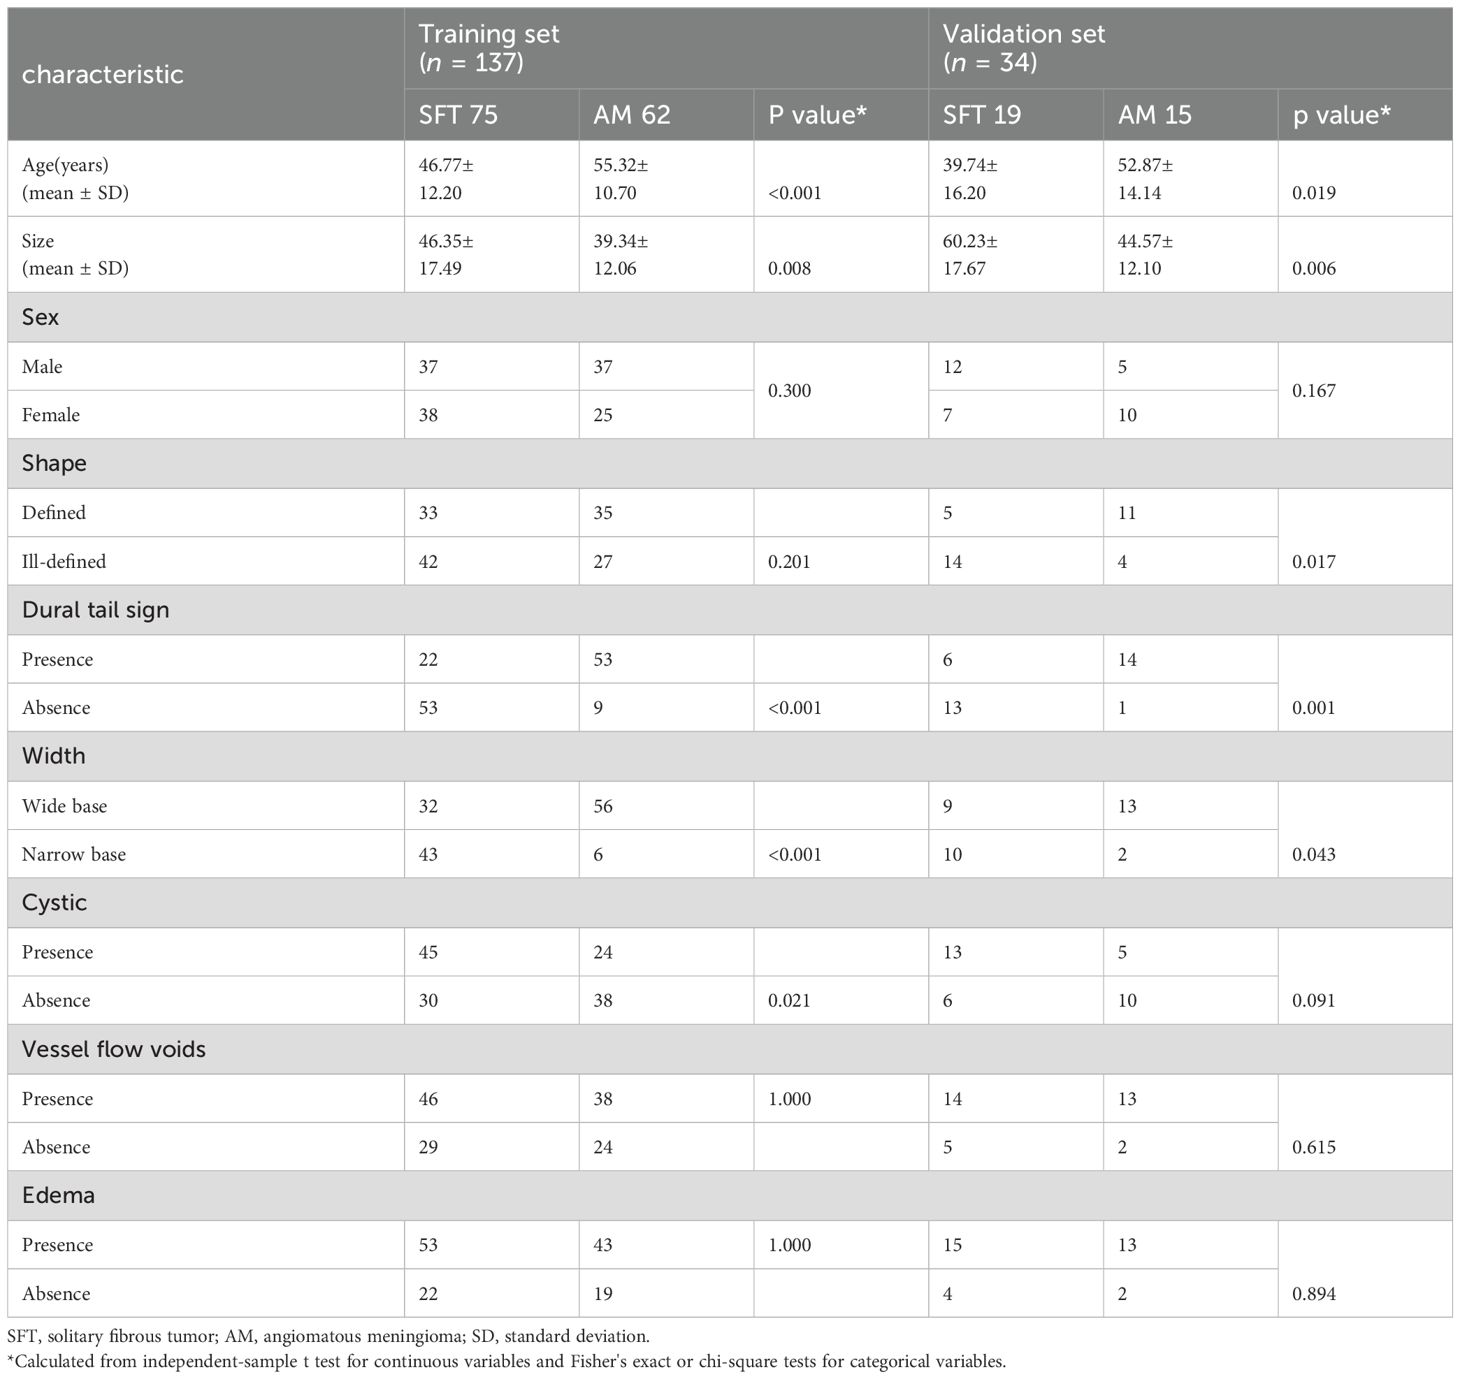
Table 1. Patients' demographic information and morphological characteristics of SFT and AM in the training and validation sets.
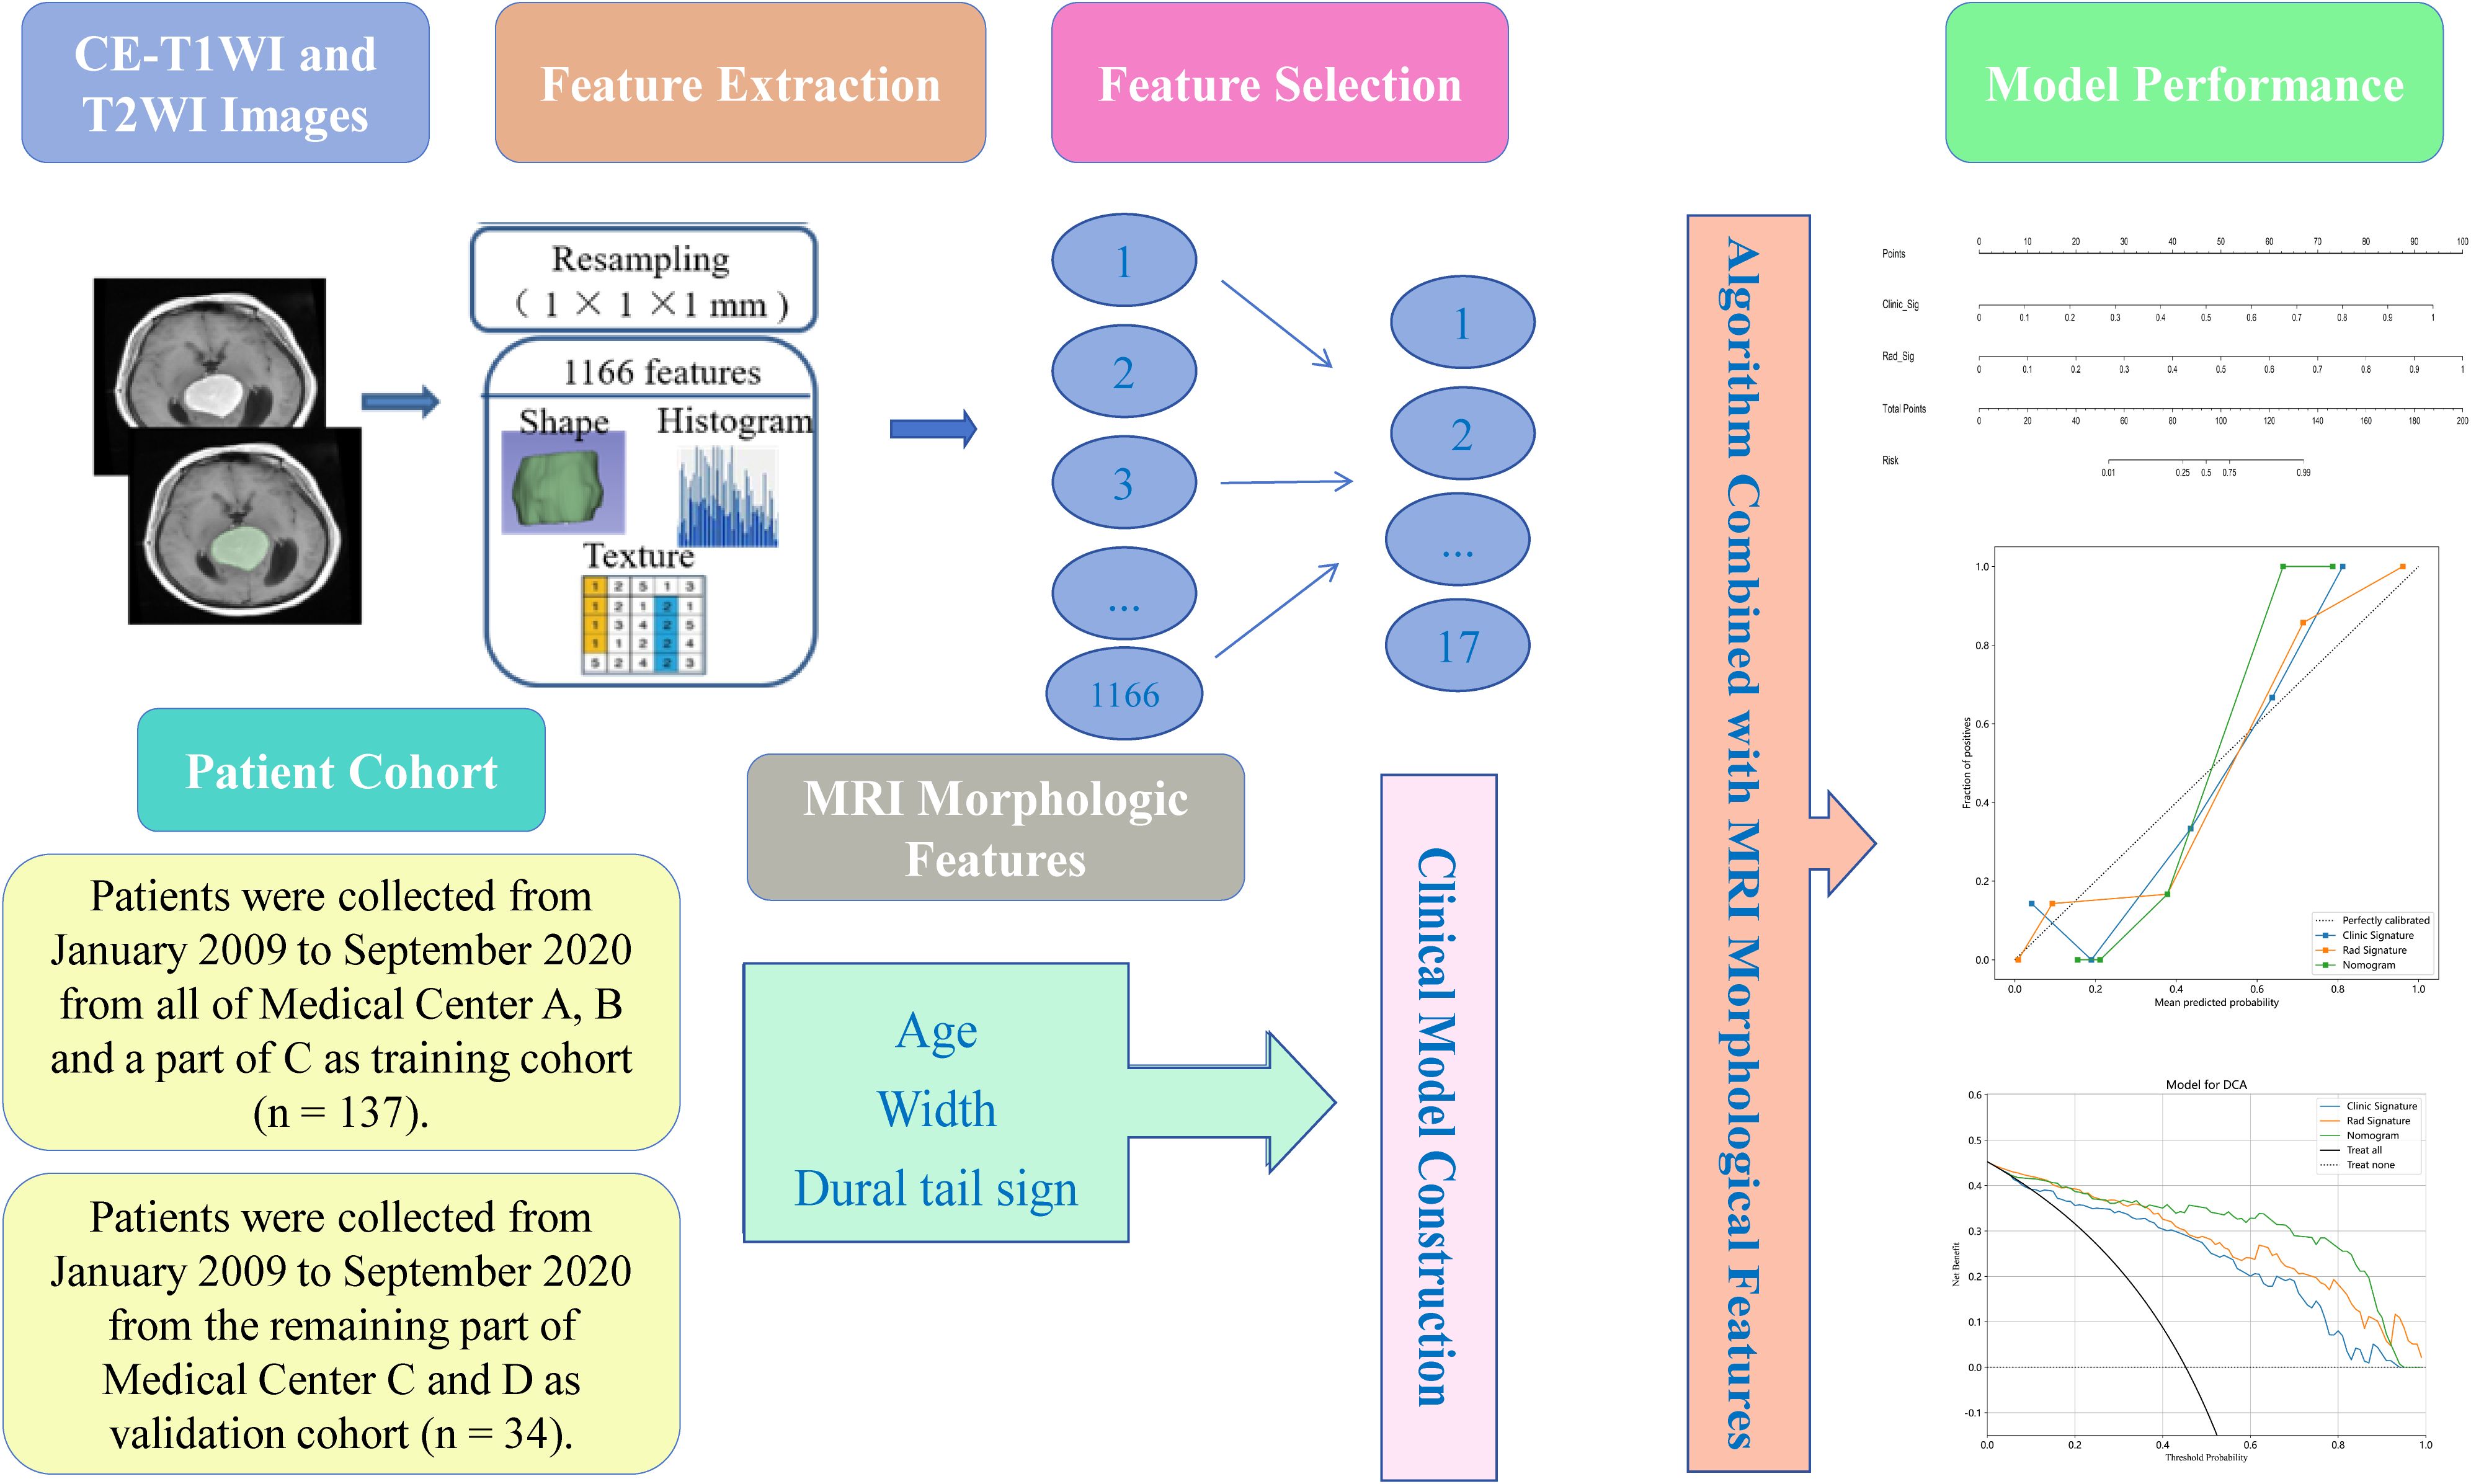
Figure 1. Workflow of the study.
2.2 Image acquisitionThe whole imaging data encompassed preoperative T2WI and CE-T1WI images, obtained using either a 3.0 T Siemens or a 3.0 T GE scanner. For CE-T1WI, images were acquired post-contrast injection through the cubital vein (gadopentetate dimeglumine, 0.1 mmol/kg), covering axial, coronal, and sagittal planes. The scanning parameters for each scanner were as follows: 3.0 T Siemens: relaxation time / echo time (TR/TE) 1800/8.5 ms; 3.0 T GE: TR/TE 2250/24 ms. The T2WI scanning parameters were: TR/TE, 700–6370/40–120 ms. The following imaging acquisition parameters were used for both Siemens and GE scanners: field of view (FOV) of 23 cm, slice thickness of 5 mm and slice gap of 1 mm.
2.3 MRI morphologic characteristicsTwo experienced radiologists (7 and 25 years of neuroimaging experience, respectively) independently analyzed the images, blinded to the clinical data. Intraclass correlation coefficients (ICCs) were calculated to assess intraobserver reliability, with one radiologist repeatedly identifying signs, while interobserver reliability was determined by comparing analyses between different radiologists. For intraobserver reproducibility assessment, radiologist 1 conducted a second region of interest (ROI) delineation one week later. The morphologic signs evaluated included: (1) size (maximum diameter of mass); (2) shape (defined or ill-defined); (3) dural tail sign (presence or absence); (4) width (wide base or narrow base); (5) cystic area (presence or absence); (6) vessel flow voids (presence or absence); and (7) peritumoral edema (presence or absence).
2.4 ROI segmentationThe images were imported into 3D-slicer software (v.4.8.1, http://www.slicer.org/) in DICOM format. Utilizing axial images, two radiologists delineated the ROI along the tumor edge in a stepwise manner. After delineating the ROI on each slice around the tumor periphery, a three-dimensional (3D) ROI was constructed. The ROIs comprised cystic and hemorrhagic areas while avoiding the edema area, aorta, venous sinus and enhanced meninges (20). Any discrepancies were reconciled through discussion.
2.5 Image normalization and feature extractionDue to the heterogeneity of the dataset, resulting from varying scanners and protocols, standardization processes such as resampling, noise reduction, and wavelet transform were applied to both CE-T1WI and T2WI images to minimize this impact. 3D Slicer was used for resampling to a voxel size of 1 × 1 × 1 mm and for performing Gaussian filtering with sigma values of 0.5, 1.0, and 1.5 (21). For further analysis, radiomics features with acceptable interobserver and intraobserver reproducibility (intraclass correlation coefficients [ICC] > 0.75) were chosen.
An internal MATLAB script (MATLAB R2017b, The MathWorks, Inc., Natick, MA, USA) was employed for the extraction of radiomics features in conjunction with 3D Slicer (22). A comprehensive set of 1,166 features, encompassing shape, first-order, gray level co-occurrence matrix (GLCM), gray level run length matrix (GLRLM), gray level size zone matrix (GLSZM), gray level dependence matrix (GLDM), and neighboring gray tone difference matrix (NGTDM) features, were extracted from CE-T1WI and T2WI images.
2.6 Feature selectionThe Mann-Whitney U test and univariate logistic regression analysis were performed to examine whether these features were any significant differences between SFT and AM. To reduce redundancy in features, the least absolute shrinkage and selection operator (LASSO) and the minimum redundancy maximum relevance (mRMR) methods were applied. Only features exhibiting the highest predictive value and significant association with the differentiation of SFT and AM were retained. In this study, three machine-learning classifiers were employed: support vector machine (SVM), logistic regression (LR) and k-nearest neighbor (KNN).
2.7 Developing the radiomics model, adding the clinical model, and constructing the radiomics nomogramClinical morphology signs were selected through univariate logistic regression, and clinical features with P < 0.05 were incorporated into a multivariate logistic regression to develop a clinical model with backwards stepwise selection and Akaike’s information criterion as the stopping rule. Subsequently, radiomics features selected by mRMR and LASSO were combined with SVM, LR and KNN respectively to develop the radiomics models. Utilizing the best classifier and feature selection approach, a radiomics score (Rad-score) was determined. After that, combining the morphologic features identified through multivariable logistic regression analysis and the rad-score to construct a nomogram.
The performance of the models was evaluated by calculating the AUC, accuracy, sensitivity, specificity, negative predictive value (NPV), and positive predictive value (PPV). Calibration curves and decision curve analysis (DCA) were utilized for assessing the nomogram’s calibration ability and clinical utility, respectively. The dependability of models was evaluated at the net benefit level using DCA, with a higher standard net benefit indicating greater clinical applicability across various threshold probabilities (23).
2.8 Statistical analysisAll statistical analyses were executed using R statistical software (https://www.Rproject.org). The independent-sample t test assessed continuous variables (such as age), while categorical variables, like gender, were analyzed using Fisher's exact or chi-square tests. A value of P < 0.05 was considered statistically significant.
3 Results3.1 Clinical characteristics screening and model developmentTable 1 presents the clinical characteristics of the training set and validation set. The assessment of intraobserver and interobserver reliability yielded ICCs for MRI morphological features that consistently exceeded 0.75. Univariate and multivariate logistic regression analysis results are presented in Table 2. Notably, multivariate logistic regression analysis identified age, width, and dural tail sign as independent risk factors for discriminating between SFT and AM. A clinical model incorporating these variables was developed, demonstrating AUCs of 0.875 (95% confidence interval [CI], 0.814-0.936) in the training set and 0.911 (95% CI, 0.794-1.000) in the validation set. A list of results is displayed in Table 3 and Figure 2.
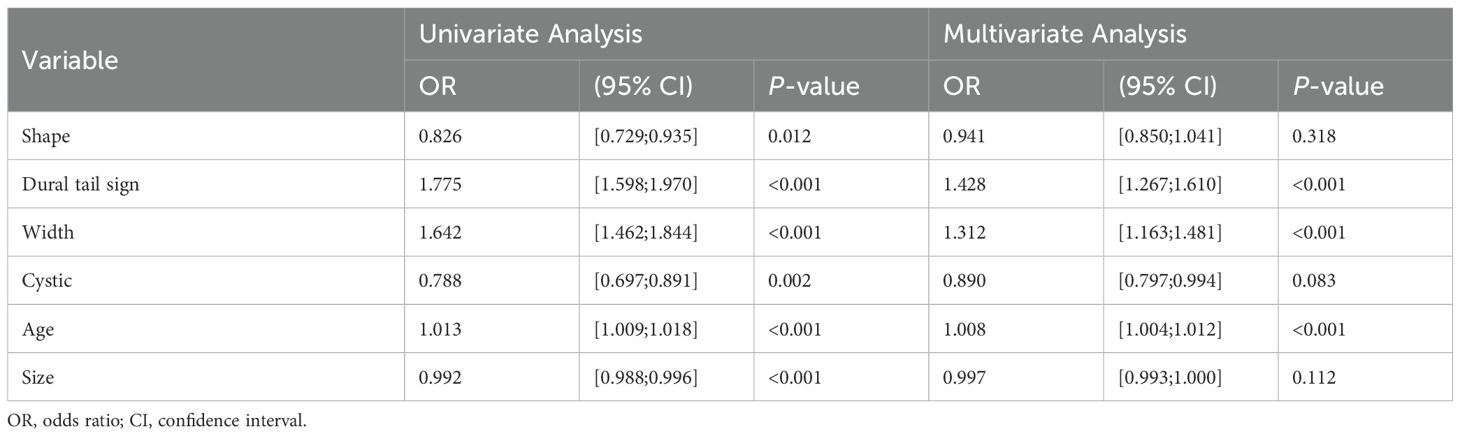
Table 2. Results of univariate and multivariate logistic regression analysis in SFT and AM.
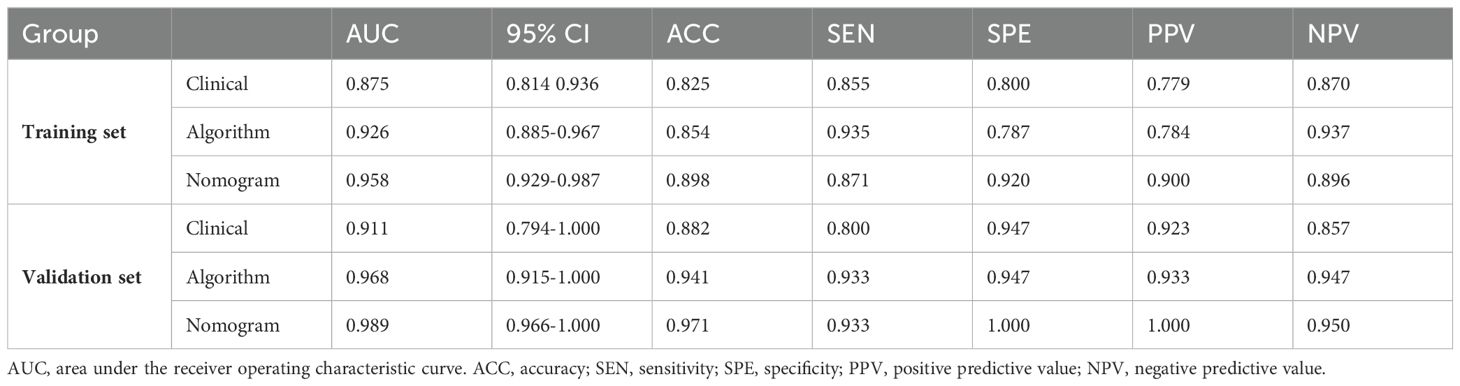
Table 3. Results of Clinical Model, Radiomics Algorithm and the Radiomics Nomogram Predictive Performance.
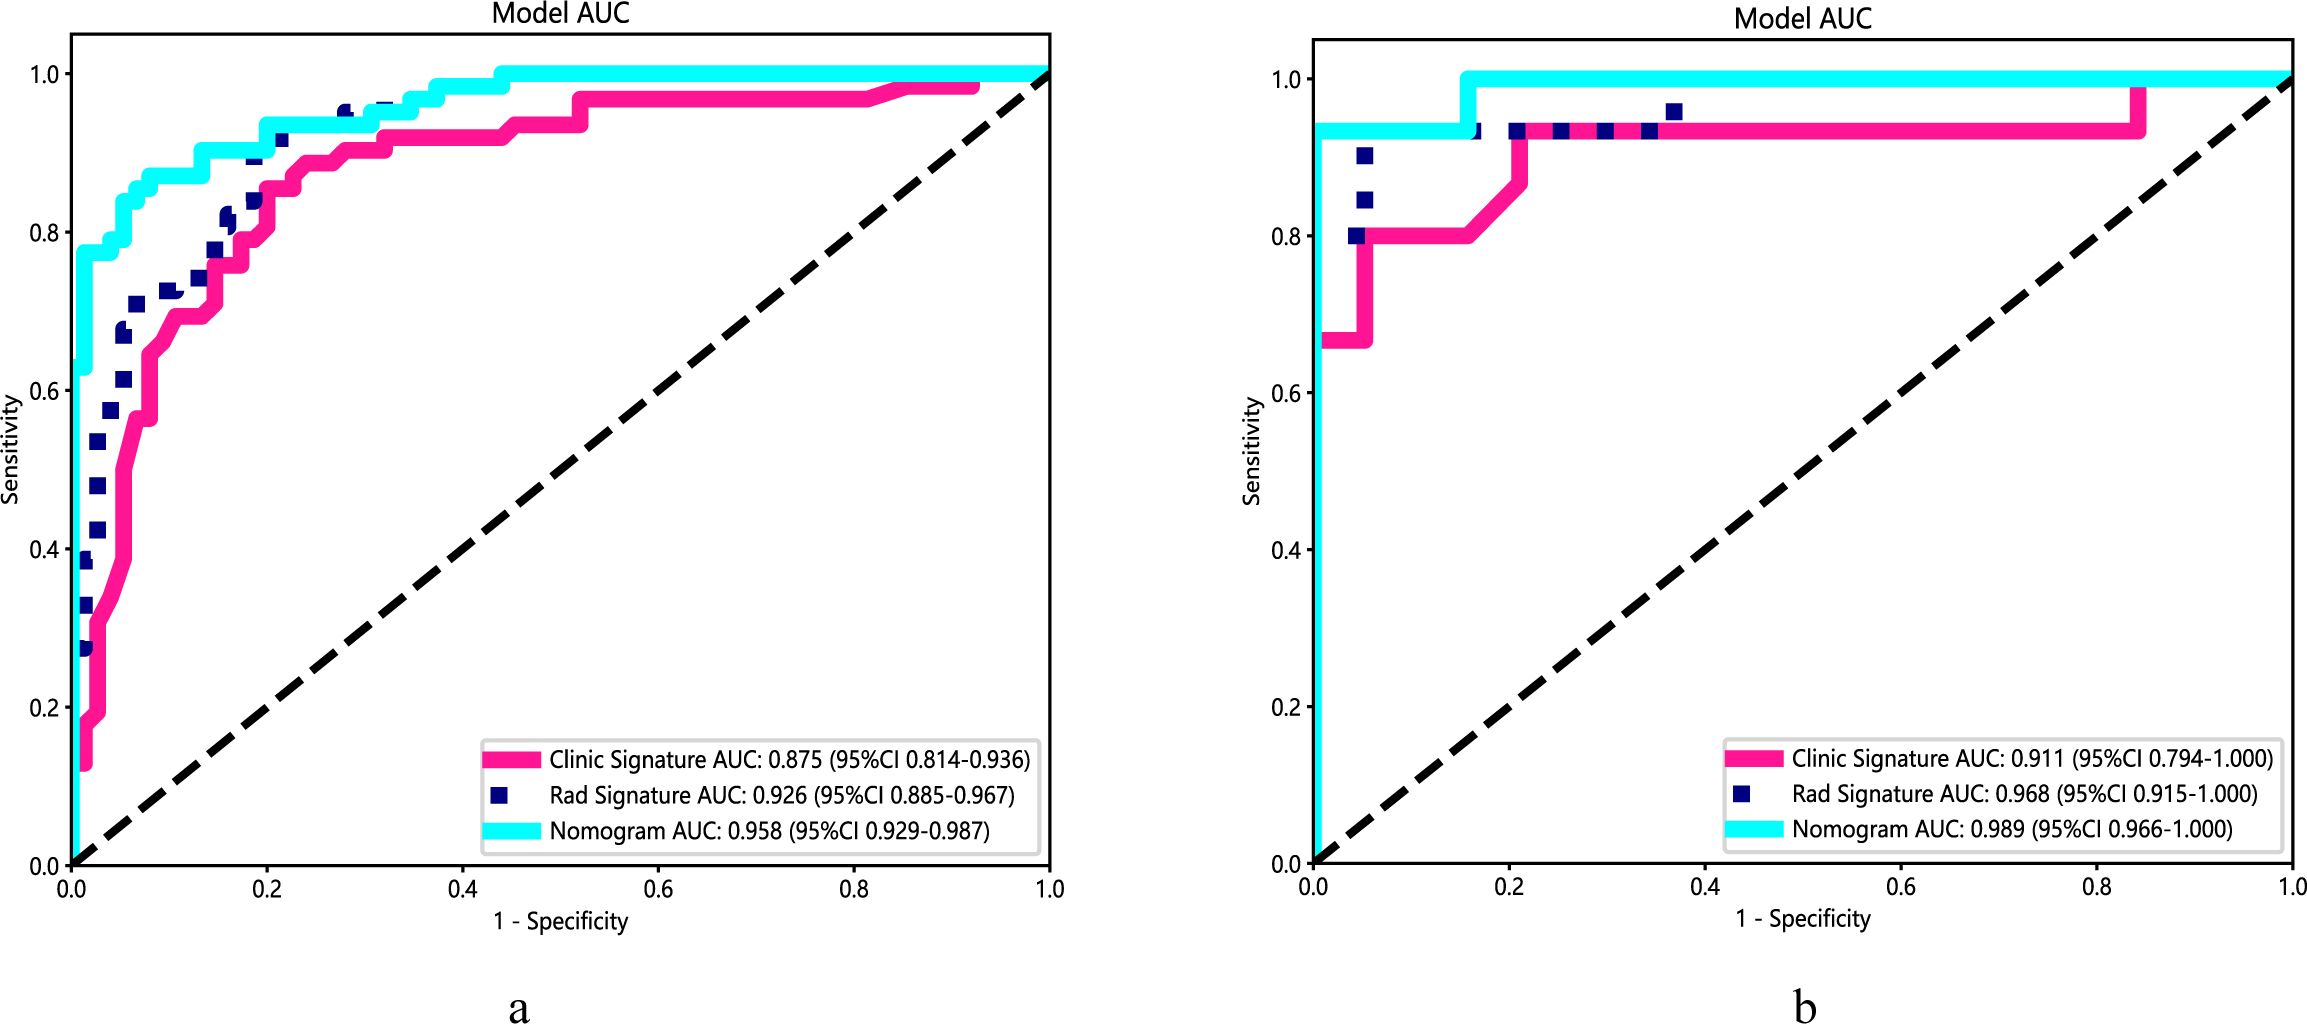
Figure 2. Performance of the clinical model, radiomics algorithm and the radiomics nomogram. (A) Training set. (B) Validation set.
3.2 Radiomics feature selection and radiomics models developmentA total of 1,166 radiomics features, after confirming that both intraobserver and interobserver ICCs exceeded 0.750, were analyzed using the mRMR method, LASSO method and the Mann-Whitney U test. Ultimately, seventeen features revealed significant differences, encompassing 1 shape-based, 4 first-order statistics features, 2 GLCM features, 3 GLRLM features, 4 GLSZM features, and 3 GLDM features (Figure 3). Shape feature describes geometric parameters such as location and size of the lesion. The first-order feature describes the distribution of gray values of each voxel in the region of interest. Matrix-based features are second-order statistics that analyze the complexity of the structure inside and around the tumor, the variation of the layers, and the thickness of the texture. Regression analysis confirmed these features as independent predictors (P < 0.05). To establish the radiomics models, these seventeen characteristics were combined with SVM, KNN and LR. In regard to AUC and accuracy performance, the LR classifier achieved the maximum performance, yielding an AUC of 0.926 (95% CI, 0.885-0.967) in the training set and 0.968 (95% CI, 0.915-1.000) in the validation set. Correspondingly, accuracy rates were recorded at 0.854 and 0.941, respectively (Table 4). The texture feature model formula was as follows:
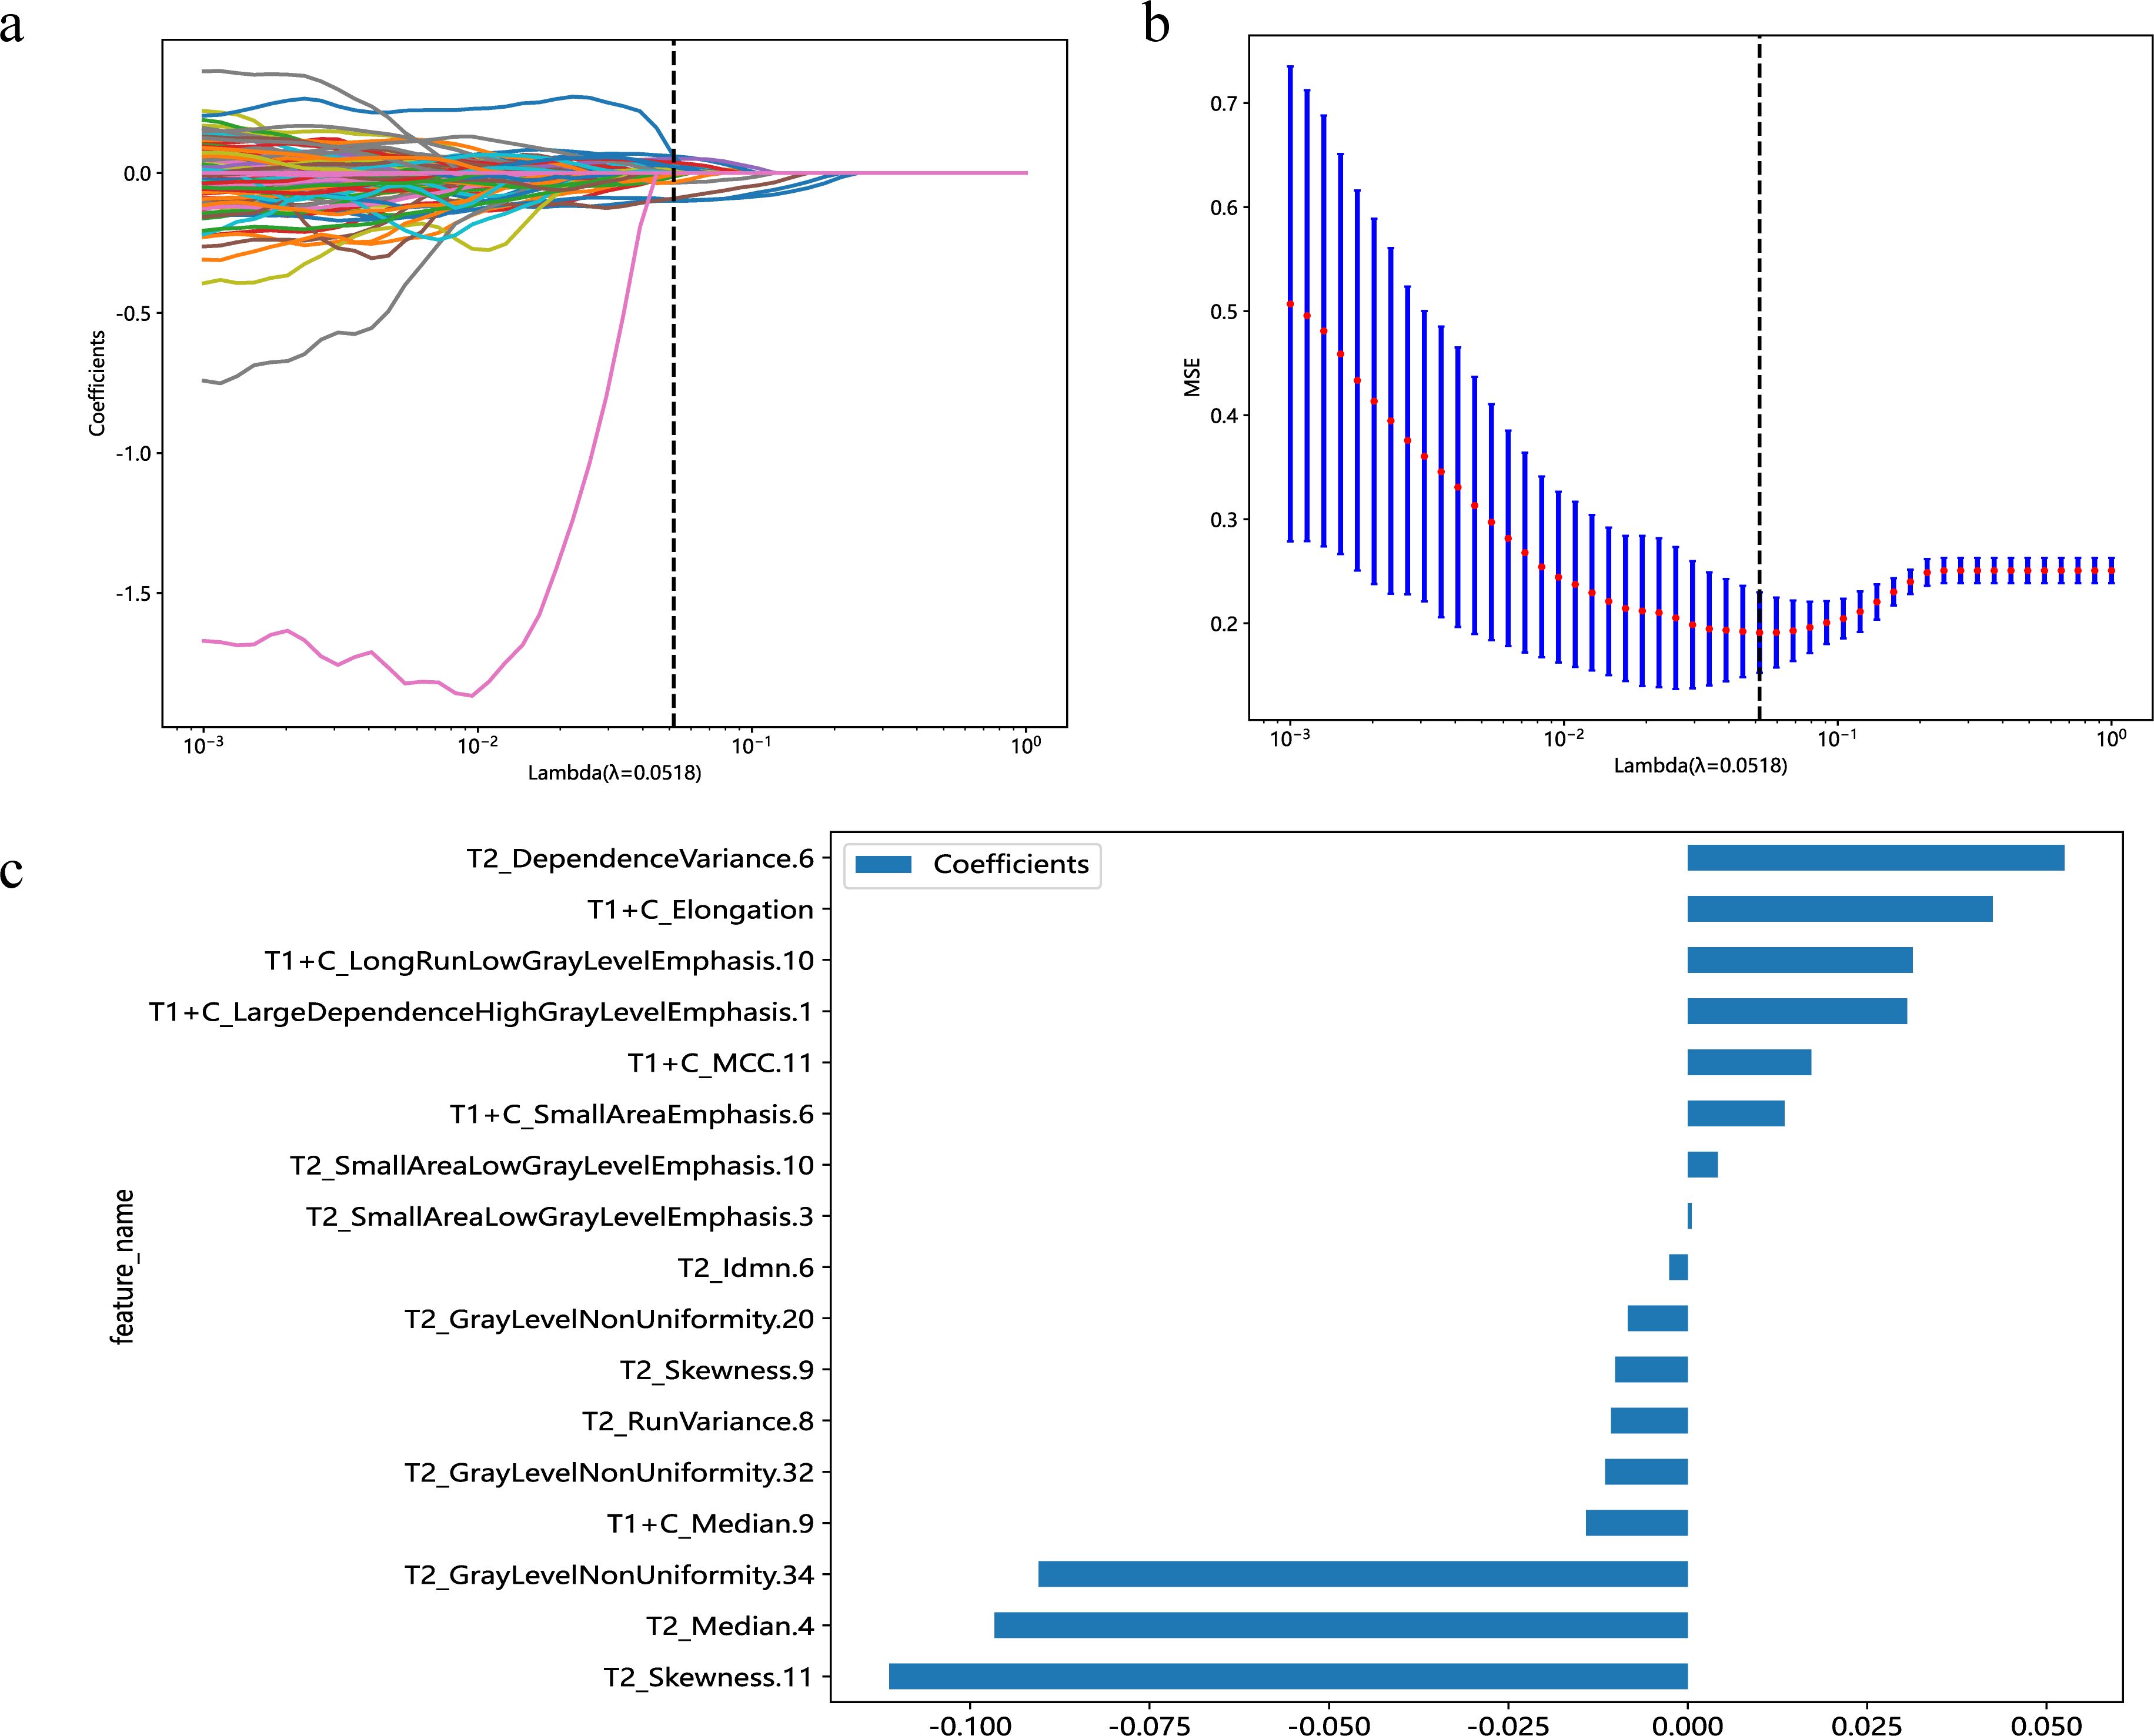
Figure 3. Predicated on the premise of an optimal λ value, delineated by a perpendicular line, a suite of 17 radiomic features was identified (A). With modulation parameters (λ values), the various characteristics will affect the LASSO coefficients (B). The selected 17 radiomics features and their nonzero coefficients (C).

Table 4. Performance of the three machine-learning methods.
Radscore = 0.438967728381277+0.000521*T2_SmallAreaLowGrayLevelEmphasis.3−0.096624*T2_Median.4+0.052464*T2_DependenceVariance.6−0.002580*T2_Idmn.6−0.008362*T2_GrayLevelNonUniformity.20−0.010714*T2_RunVariance.8−0.010133*T2_Skewness.9−0.011496*T2_GrayLevelNonUniformity.32+0.004185*T2_SmallAreaLowGrayLevelEmphasis.10−0.111251*T2_Skewness.11−0.090475*T2_GrayLevelNonUniformity.34+0.042483*T1+C_Elongation+0.030545*T1+C_LargeDependenceHighGrayLevelEmphasis.1+0.013493*T1+C_SmallAreaEmphasis.6−0.014165*T1+C_Median.9+0.031357*T1+C_LongRunLowGrayLevelEmphasis.10+0.017206*T1+C_MCC.11ccccc−4.130
3.3 Establishment and performance of nomogramA radiomics nomogram, integrating age, width, dural tail sign, and rad-score, was established (Figure 4). Compared to the individual performance metrics of the radiomics algorithm (AUCs of 0.926 and 0.968 for the training and validation sets, respectively) and the clinical model (AUCs of 0.875 and 0.911), the nomogram exhibited superior predictive capabilities, with AUCs of 0.958 (95% CI, 0.929-0.987) and 0.989 (95% CI, 0.966-1.000) for the respective sets. Additionally, the nomogram demonstrated high accuracy (0.898), sensitivity (0.871), and specificity (0.920) in the training set, and similarly outstanding performance in the validation set (accuracy of 0.971, sensitivity of 0.933, specificity of 1.000) (Table 3, Figure 2). In the training group, the AUC of the nomogram was higher than that of both the clinical model and the radiomics model according to DeLong test. In the test group, there was no significant difference in AUC among the three groups (P > 0.05).
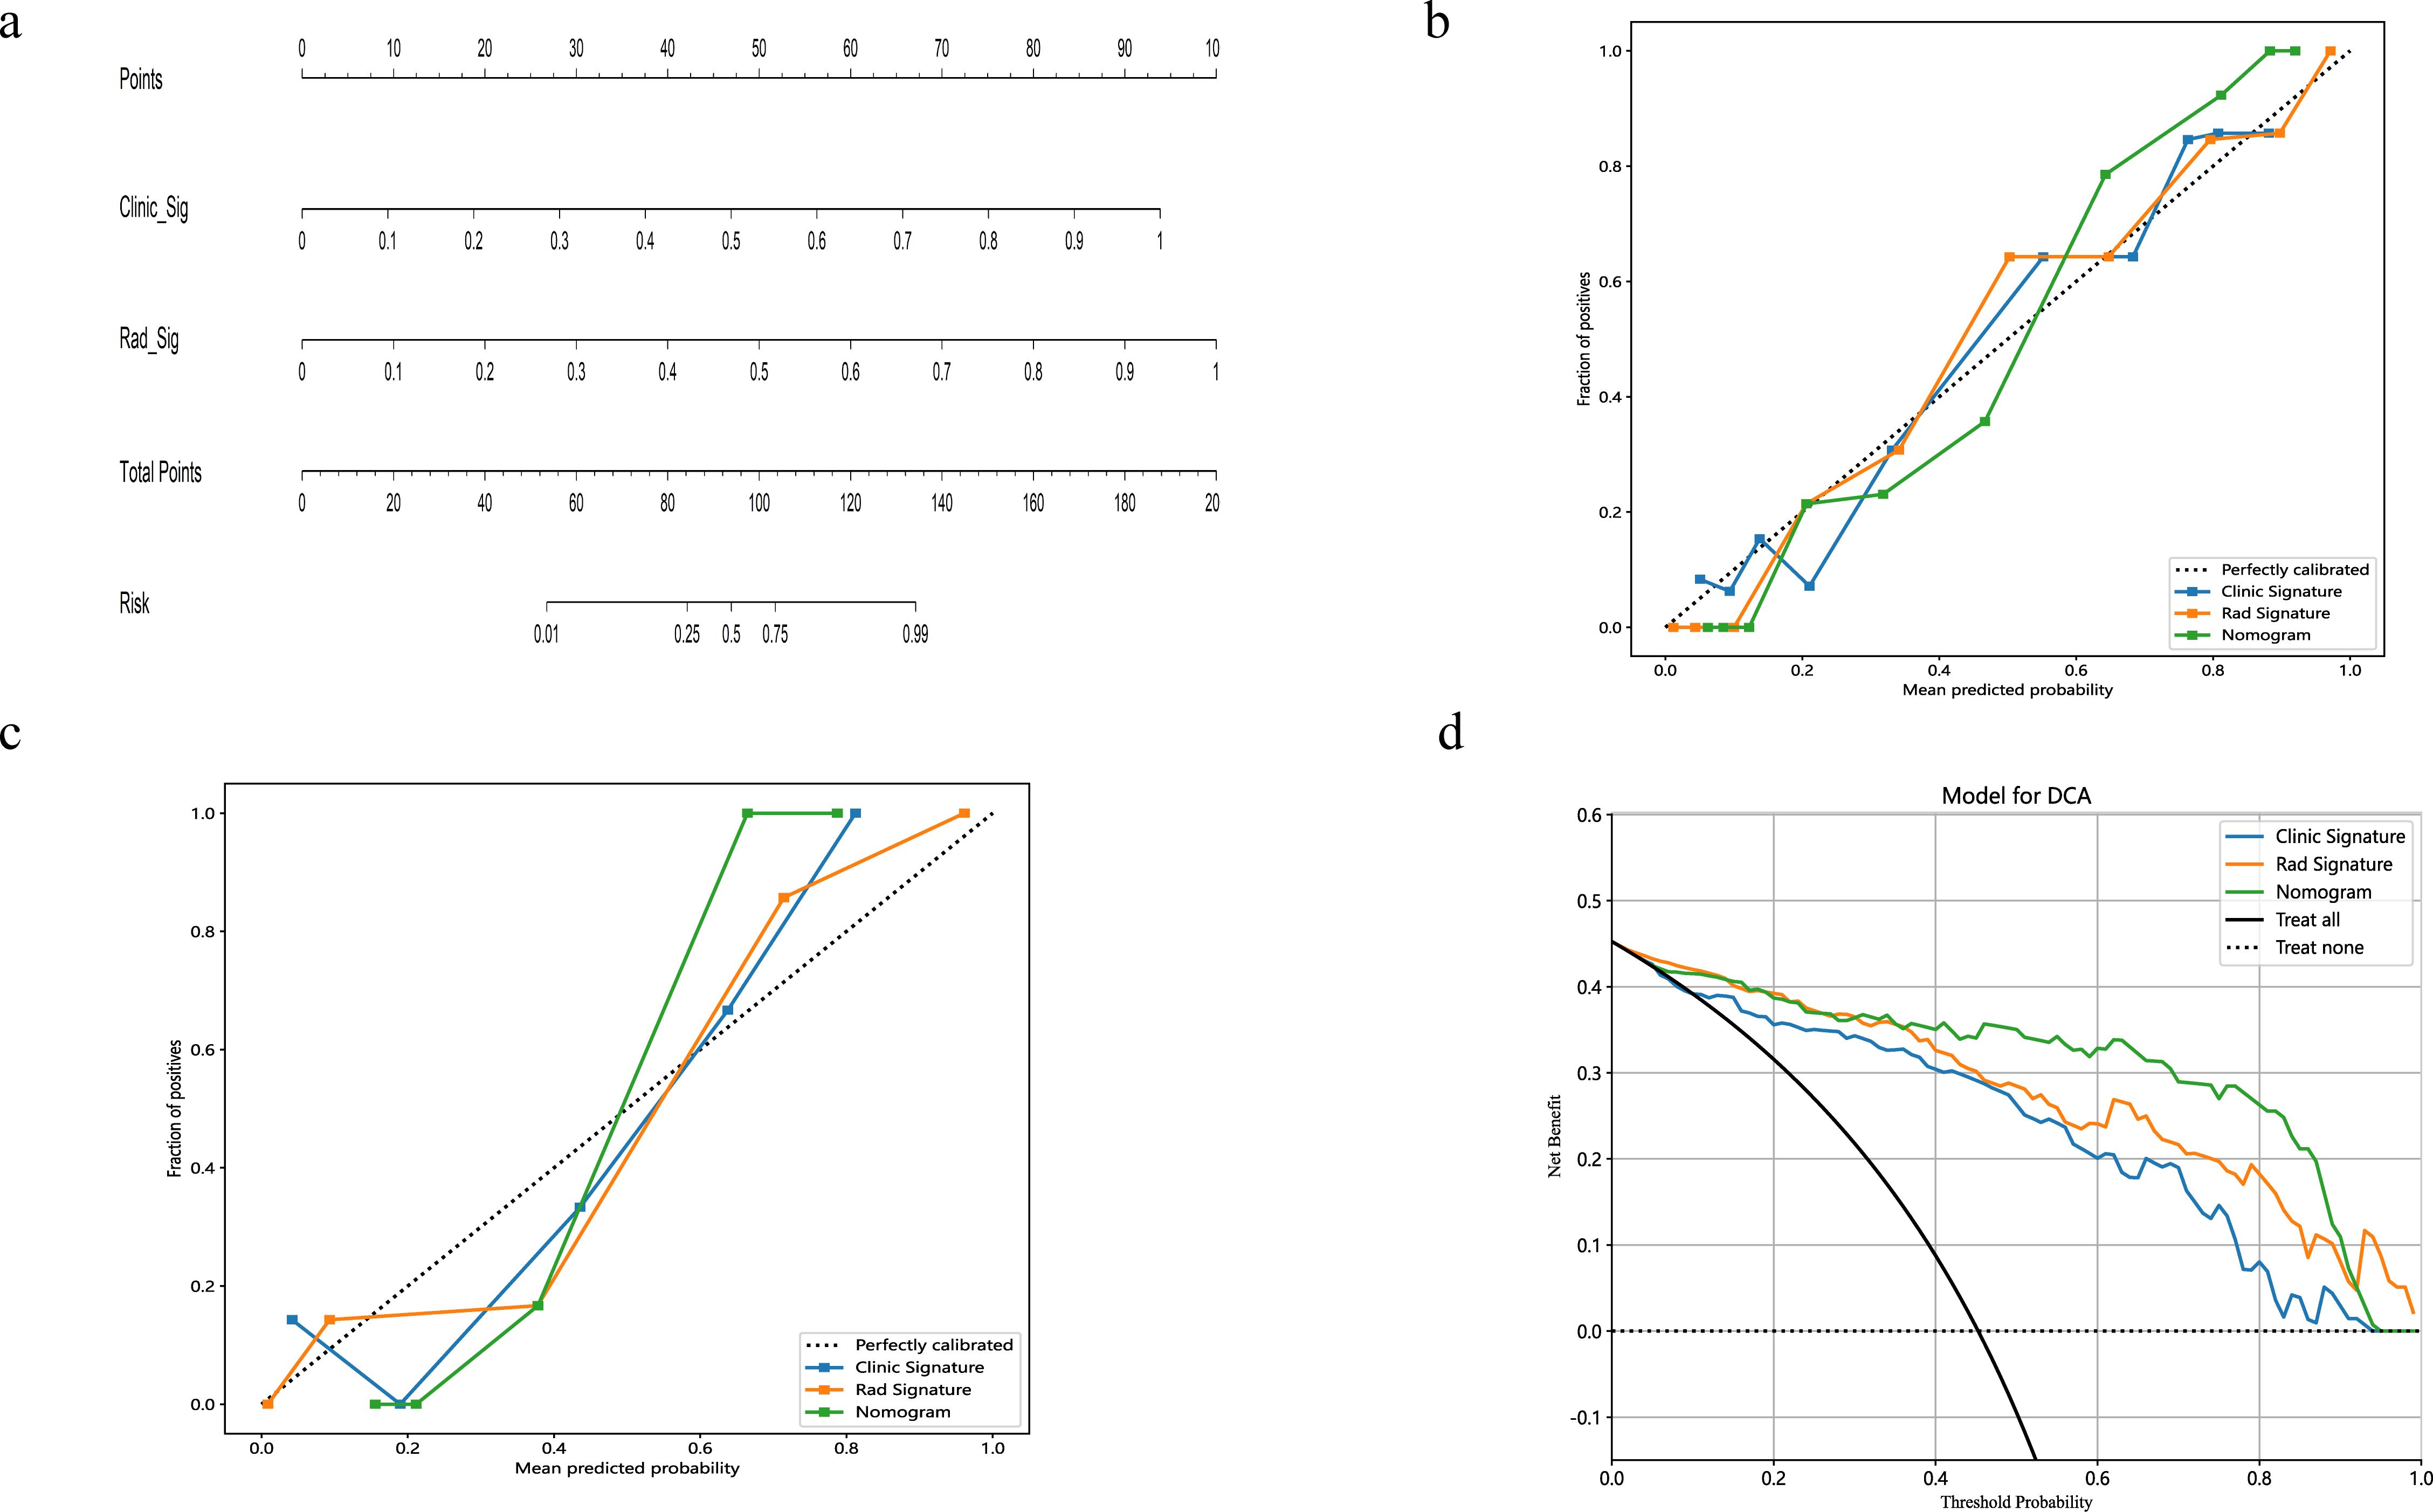
Figure 4. The nomogram integrates radiomic features with morphological characteristics (A). Calibration curves for the radiomic nomograms in the training and validation cohorts are presented in (B, C). A 45-degree line indicates perfect prediction; the closer the curve approximates this line, the greater the nomogram's predictive accuracy. Decision curve analysis (DCA) was employed for the radiomic nomogram (D), with the net benefit plotted on the y-axis. In the nomogram, this is represented by a black line. The line labeled "All" assumes every patient has SFT, while the "None" line assumes no patients have SFT.
The calibration curves for the radiomics nomogram indicated excellent performance in both the training and validation sets (Figure 4). Furthermore, DCA of the nomogram revealed that within a threshold probability range of 0.15 to 0.85, and when comparing strategies of 'treat none' versus 'treat all', the nomogram consistently outperformed the clinical model (Figure 4).
4 DiscussionThe preoperative distinction between SFT and AM is of paramount clinical significance. SFT, characterized by its invasive nature, has a propensity for recurrence and metastasis to extracranial organs post-surgical resection. Typically, the primary therapeutic strategy encompasses postoperative radiotherapy or chemotherapy, supplemented by regular clinical follow-ups to monitor patient prognosis (24). Conversely, AM exhibits a benign pathology, with low aggressive growth potential and recurrence rates, often resulting in favorable outcomes after gross total resection (25). SFT and AM exhibit similar MRI findings. Although previous studies have demonstrated that certain MRI features—such as tumor size, signal intensity, vascular flow voids, and the dural tail sign—can aid in differentiating between SFT and AM (26). However, traditional MRI features are susceptible to the influence of physician experience due to the lack of objectivity and quantitative analysis, so differentiating between these two entities using conventional MRI poses a considerable challenge. In our study, we selected the radiomics algorithm with superior predictive performance, integrating it with the clinical model to construct a radiomics nomogram specifically for distinguishing SFT from AM. The radiomics nomogram AUC was 0.989 in the validation set, outperforming the clinical model and the radiomics algorithm in predictive capability. Demonstrating satisfactory calibration and net benefits, the radiomics nomogram appears reliable for differentiating AM from SFT.
Image segmentation in machine learning for intracranial tumors, a crucial step, demands high reproducibility. Current methodologies range from manual to semiautomatic and fully automatic approaches (27, 28). Hu et al. (29) implemented a semiautomatic method based on a signal intensity threshold and edge-based algorithms via 3D Slicer, achieving efficient tumor segmentation. This approach automatically aligned the ROIs with multimodal MRI images, proving more efficient than manual sketching. However, despite its efficiency, automatic mapping encounters challenges, particularly with the variability in tumor morphology. In our study, manual segmentation was meticulously conducted using 3D Slicer to ensure precise tumor delineation.
The efficacy of morphological features in differentiating between AM and SFT remains contentious. Various studies advocate for their diagnostic relevance, noting characteristics typical of SFT such as large volume, irregular shape, uneven enhancement, vascular flow voids, dural stenosis, necrosis, and bone deterioration (19, 30–33). Contrarily, our research suggests a divergence from these findings, potentially due to the subjective nature of clinical observations. Our multivariate logistic regression analyses identified age, width, and dural tail sign as independent predictors in distinguishing SFT from AM. In addition, the AUC of the clinical model in our validation set was inferior to that of the radiomics algorithms and nomograms, underscoring the dependency of the clinical model's performance on radiologist expertise and emphasizing the superior discriminative performance of machine learning algorithms (33).
Radiomics, a constantly evolving new subject in medical imaging, refers to the quantitative extraction of radiological features from two-dimensional or three-dimensional medical images. Its integration with clinical data has proven beneficial in monitoring tumor progression and aiding personalized treatment strategies (34). Machine learning plays a crucial role in analyzing brain tumor MRI imaging data, facilitating deeper exploration of patterns that can aid in diagnosis. At present, domestic and foreign scholars have applied machine learning based on radiomics methods to study SFT and AM. Fan et al. (35) utilized SVM to develop a model for distinguishing SFT from AM using CE-T1WI, T2WI, and a combined CE-T1WI and T2WI sequence. The combined CE-T1WI and T2WI model demonstrated the highest predictive performance, achieving an AUC of 0.90. Kong et al. (36) assessed various algorithms' effectiveness in differentiating SFT from AM using multiparameter MRI sequences. Their results indicated that the performance improvements offered by the different algorithms were limited. However, most studies typically utilize only one machine learning algorithm or a single traditional MRI sequence to construct their models, often using data from a single center. Validating the generalizability of these models necessitates the inclusion of multicenter data. Therefore, in line with previous research, we integrated data from multiple centers and employed LR, SVM, and KNN algorithms in conjunction with conventional MRI sequences to establish radiomics models, and the models ultimately showed robust predictive capabilities. Furthermore, our integrated model demonstrated superior diagnostic accuracy, outperforming the individual LR, SVM, and KNN models, as well as the clinical model. This underscores that while tumor radiomics models possess enhanced predictive abilities compared to the clinical model alone, the integration of clinical data is indispensable. The synergy of these elements effectively differentiates between SFT and AM. A radiomics nomogram, established by Wei et al. to differentiate SFT from AM, showcased remarkable diagnostic capability, with AUCs of 0.985 and 0.917 in the training and validation sets, respectively (37).
In our study, 1,166 radiomics features, predominantly texture features representing second-order attributes that reflect voxel/pixel relationships, were extracted. Texture features illustrate not only pixel intensity distribution, but also how quantized pixels position each other (38). The feature selection process in machine learning, crucial for the reliability of radiomics algorithms, involved the use of mRMR and LASSO. LASSO is particularly effective in datasets with numerous features but limited samples without noticeably increasing the bias, while mRMR facilitates the selection of features with minimal redundancy and maximum relevance (39, 40). Subsequently, seventeen features were selected to develop radiomics models using SVM, LR, and KNN classifiers. SVM is adept at analyzing high-dimensional, small-scale data. KNN excels in processing nonlinear data, identifying multiple predictive biomarkers in clinical datasets. LR, as a classification method, investigates the relationship between specific outcome probabilities and features (41, 42). Our results indicated that LR yielded the highest accuracy and AUC, prompting their adoption for the optimal radiomics model. Integrating this model with the clinical model to create the radiomics nomogram resulted in excellent calibration and accurate differentiation between SFT and AM in the validation set, affirming its efficacy and reliability in diagnosing these conditions.
Multicenter studies, essential for obtaining extensive sample sizes and enhancing classifier generalization, encounter challenges like data heterogeneity and variability arising from different scanners and methodologies. To mitigate these issues, we implemented preprocessing steps such as resampling, denoising, and wavelet transformation. In the validation set, clinical model, radiomics algorithm, and the nomogram demonstrated AUCs of 0.911, 0.968, and 0.989, respectively, suggesting robust generalizability (43).
This investigation had certain restrictions. Firstly, its retrospective nature and relatively small size might introduce selection bias. Considering the retrospective design, scanner and protocol heterogeneity were addressed through resampling to stabilize model performance. Additionally, patient distributions varied between training and validation sets. Lastly, our analysis was confined to images from the CE-T1WI and T2WI. Future studies aim to include a broader range of imaging sequences to further enhance the predictive accuracy and generalizability of the model.
5 ConclusionsIn summary, compared to conventional MRI, the MRI-based radiomics nomogram demonstrates greater efficacy in differentiating SFT and AM, offering significant information for the subsequent treatment and detection. Furthermore, the study of a larger prospective dataset is needed to certify the real value of nomogram.
Data availability statementThe raw data supporting the conclusions of this article will be made available by the authors, without undue reservation.
Ethics statementThe studies involving humans were approved by The Affiliated Hospital of Qingdao University. The studies were conducted in accordance with the local legislation and institutional requirements. The ethics committee/institutional review board waived the requirement of written informed consent for participation from the participants or the participants' legal guardians/next of kin because Written informed consent was waived on account of its retrospective nature.
Author contributionsML: Writing – original draft. SF: Writing – original draft. JD: Data curation, Writing – original draft. XH: Data curation, Writing – original draft. CD: Formal analysis, Writing – original draft. YR: Supervision, Writing – review & editing. YQ: Data curation, Writing – original draft. YT: Data curation, Writing – original draft.
FundingThe author(s) declare that no financial support was received for the research, authorship, and/or publication of this article.
Conflict of interestThe authors declare that the research was conducted in the absence of any commercial or financial relationships that could be construed as a potential conflict of interest.
Publisher’s noteAll claims expressed in this article are solely those of the authors and do not necessarily represent those of their affiliated organizations, or those of the publisher, the editors and the reviewers. Any product that may be evaluated in this article, or claim that may be made by its manufacturer, is not guaranteed or endorsed by the publisher.
Abbreviations3D, Three-dimensional; ACC, Accuracy; ADC, Apparent diffusion coefficient; AM, Angiomatous meningioma; AUC, Area under the receiver operating characteristic curve; CE-T1WI, Contrast-Enhanced T1-Weighted Imaging; CI, Confidence interval; DCA, Decision curve analysis; FOV, Field of view; GLCM, Gray level co-occurrence matrix; GLDM, Gray level dependence matrix; GLRLM, Gray level run length matrix; GLSZM, Gray level size zone matrix; HPC, Hemangiopericytomas; ICCs, Intraclass correlation coefficients; KNN, K-nearest neighbor; LASSO, Least absolute shrinkage and selection operator; LR, Logistic regression; MRI, Magnetic Resonance Imaging; mRMR, Minimum redundancy maximum relevance; NGTDM, Neighboring gray tone difference matrix; NPV, Negative predictive value; PPV, Positive predictive value; Rad-score, Radiomics score; ROI, Region of interest; SEN, Sensitivity; SFT, Solitary fibrous tumor; SPE, Specificity; SVM, Support vector machine; T2WI, T2-Weighted Imaging; TE, Echo time; TR, Relaxation time.
References1. Wang L, Yu J, Shu D, Huang B, Wang Y, Zhang L. Primary endodermal hemangiopericytoma/solitary fibrous tumor of the cervical spine: a case report and literature review. BMC Surg. (2021) 21:405. doi: 10.1186/s12893-021-01399-6
PubMed Abstract | Crossref Full Text | Google Scholar
2. Louis DN, Perry A, Reifenberger G, von Deimling A, Figarella-Branger D, Cavenee WK, et al. The 2016 world health organization classification of tumors of the central nervous system: a summary. Acta Neuropathol. (2016) 131:803–20. doi: 10.1007/s00401-016-1545-1
PubMed Abstract | Crossref Full Text | Google Scholar
3. Louis DN, Perry A, Wesseling P, Brat DJ, Cree IA, Figarella-Branger D, et al. The 2021 WHO classification of tumors of the central nervous system: a summary. Neuro Oncol. (2021) 23:1231–51. doi: 10.1093/neuonc/noab106
PubMed Abstract | Crossref Full Text | Google Scholar
4. Yan PF, Yan L, Hu TT, Xiao DD, Zhang Z, Zhao HY, et al. The potential value of preoperative MRI texture and shape analysis in grading meningiomas: A preliminary investigation. Transl Oncol. (2017) 10:570–7. doi: 10.1016/j.tranon.2017.04.006
PubMed Abstract | Crossref Full Text | Google Scholar
5. He W, Xiao X, Li X, Guo Y, Guo L, Liu X, et al. Whole-tumor histogram analysis of apparent diffusion coefficient in differentiating intracranial solitary fibrous tumor/hemangiopericytoma from angiomatous meningioma. Eur J Radiol. (2019) 112:186–91. doi: 10.1016/j.ejrad.2019.01.023
PubMed Abstract | Crossref Full Text | Google Scholar
6. Hwang J, Kong DS, Seol HJ, Nam DH, Lee JI, Choi JW. Clinical and radiological characteristics of angiomatous meningiomas. Brain Tumor Res Treat. (2016) 4:94–9. doi: 10.14791/btrt.2016.4.2.94
PubMed Abstract | Crossref Full Text | Google Scholar
7. Bi YZ, Bai J, Bai PR, Li XR, Fu SL, Wang J, et al. Machine learning models based on radiomics in differentiating solitary fibrous tumor from angiomatous meningioma. Chin J Magn Reson Imaging. (2023) 14:50–5. doi: 10.12015/issn.1674-8034.2023.09.009
Crossref Full Text | Google Scholar
8. Sung KS, Moon JH, Kim EH, Kang SG, Kim SH, Suh CO, et al. Solitary fibrous tumor/hemangiopericytoma: treatment results based on the 2016 WHO classification. J Neurosurg. (2018) 130(2):418–25. doi: 10.3171/2017.9.JNS171057
PubMed Abstract | Crossref Full Text | Google Scholar
9. Bi WL, Hosny A, Schabath MB, Giger ML, Birkbak NJ, Mehrtash A, et al. Artificial intelligence in cancer imaging: Clinical challenges and applications. CA Cancer J Clin. (2019) 69:127–57. doi: 10.3322/caac.21552
PubMed Abstract | Crossref Full Text | Google Scholar
10. Wang X, Dai Y, Lin H, Cheng J, Zhang Y, Cao M, et al. Shape and texture analyses based on conventional MRI for the preoperative prediction of the aggressiveness of pituitary adenomas. Eur Radiol. (2013) 33:3312–21. doi: 10.1007/s00330-023-09412-7
Crossref Full Text | Google Scholar
11. Kanazawa T, Minami Y, Jinzaki M, Toda M, Yoshida K, Sasaki H. Preoperative prediction of solitary fibrous tumor/hemangiopericytoma and angiomatous meningioma using magnetic resonance imaging texture analysis. World Neurosurg. (2018) 120:e1208–16. doi: 10.1016/j.wneu.2018.09.044
PubMed Abstract | Crossref Full Text | Google Scholar
12. Wang C, Xu Y, Xiao X, Zhang J, Zhou F, Zhao X. Role of intratumoral flow void signs in the differential diagnosis of intracranial solitary fibrous tumors and meningiomas. J Neuroradiol. (2016) 43:325–30. doi: 10.1016/j.neurad.2016.06.003
PubMed Abstract | Crossref Full Text | Google Scholar
13. Li G, Li L, Li Y, Qian Z, Wu F, He Y, et al. An MRI radiomics approach to predict survival and tumour-infiltrating macrophages in gliomas. Brain. (2022) 145:1151–61. doi: 10.1093/brain/awab340
PubMed Abstract | Crossref Full Text | Google Scholar
15. Lambin P, Zindler J, Vanneste BG, De Voorde LV, Eekers D, Compter I, et al. Decision support systems for personalized and participative radiation oncology. Adv Drug Delivery Rev. (2017) 109:131–53. doi: 10.1016/j.addr.2016.01.006
Crossref Full Text | Google Scholar
17. Zhu Y, Man C, Gong L, Dong D, Yu X, Wang S, et al. A deep learning radiomics model for preoperative grading in meningioma. Eur J Radiol. (2019) 116:128–34. doi: 10.1016/j.ejrad.2019.04.022
PubMed Abstract | Crossref Full Text | Google Scholar
18. Fu SL, Ren YD, Li XR, Ma C, Zhang H, Ge YQ. The value of magnetic resonance imaging in differentiating grade ll solitary fibrous tumor/hemangiopericytoma from angiomatous meningioma. Chin J Magn Reson Imaging. (2022) 13:15–20. doi: 10.12015/issn.1674-8034.2022.01.004
Crossref Full Text | Google Scholar
19. Li X, Lu Y, Xiong J, Wang D, She D, Kuai X, et al. Presurgical differentiation between Malignant haemangiopericytoma and angiomatous meningioma by a radiomics approach based on texture analysis. J Neuroradiol. (2019) 46:281–7. doi: 10.1016/j.neurad.2019.05.013
PubMed Abstract | Crossref Full Text | Google Scholar
20. Kalasauskas D, Kronfeld A, Renovanz M, Kurz E, Leukel P, Krenzlin H, et al. Identification of high-risk atypical meningiomas according to semantic and radiomic features. Cancers (Basel). (2020) 12. doi: 10.3390/cancers12102942
Crossref Full Text | Google Scholar
21. Wang J, Liu X, Hu B, Gao Y, Chen J, Li J. Development and validation of an MRI-based radiomic nomogram to distinguish between good and poor responders in patients with locally advanced rectal cancer undergoing neoadjuvant chemoradiotherapy. Abdom Radiol (NY). (2021) 46:1805–15. doi: 10.1007/s00261-020-02846-3
PubMed Abstract | Crossref Full Text | Google Scholar
22. Fedorov A, Beichel R, Kalpathy-Cramer J, Finet J, Fillion-Robin JC, Pujol S, et al. 3D Slicer as an image computing platform for the Quantitative Imaging Network. Magn Reson Imaging. (2012) 30:1323–41. doi: 10.1016/j.mri.2012.05.001
PubMed Abstract | Crossref Full Text | Google Scholar
24. Ratneswaren T, Hogg FRA, Gallagher MJ, Ashkan K. Surveillance for metastatic hemangiopericytoma-solitary fibrous tumors-systematic literature review on incidence, predictors and diagnosis of extra-cranial disease. J Neurooncol. (2018) 138:447–67. doi: 10.1007/s11060-018-2836-2
PubMed Abstract | Crossref Full Text | Google Scholar
25. Verma PK, Nangarwal B, Verma J, Dwivedi V, Mehrotra A, Das KK, et al. A clinico-pathological and neuro-radiological study of angiomatous meningioma: Aggressive look with benign behaviour. J Clin Neurosci. (2021) 83:43–8. doi: 10.1016/j.jocn.2020.11.032
PubMed Abstract | Crossref Full Text | Google Scholar
26. He L, Li B, Song X, Yu S. Signal value difference between white matter and tumor parenchyma in T1- and T2- weighted images may help differentiating solitary fibrous tumor/hemangiopericytoma and angiomatous meningioma. Clin Neurol Neurosurg. (2020) 198:106221. doi: 10.1016/j.clineuro.2020.106221
PubMed Abstract | Crossref Full Text | Google Scholar
27. Bangalore Yogananda CG, Shah BR, Vejdani-Jahromi M, Nalawade SS, Murugesan GK, Yu FF, et al. A fully automated deep learning network for brain tumor segmentation. Tomography. (2020) 6:186–93. doi: 10.18383/j.tom.2019.00026
留言 (0)