
記住我


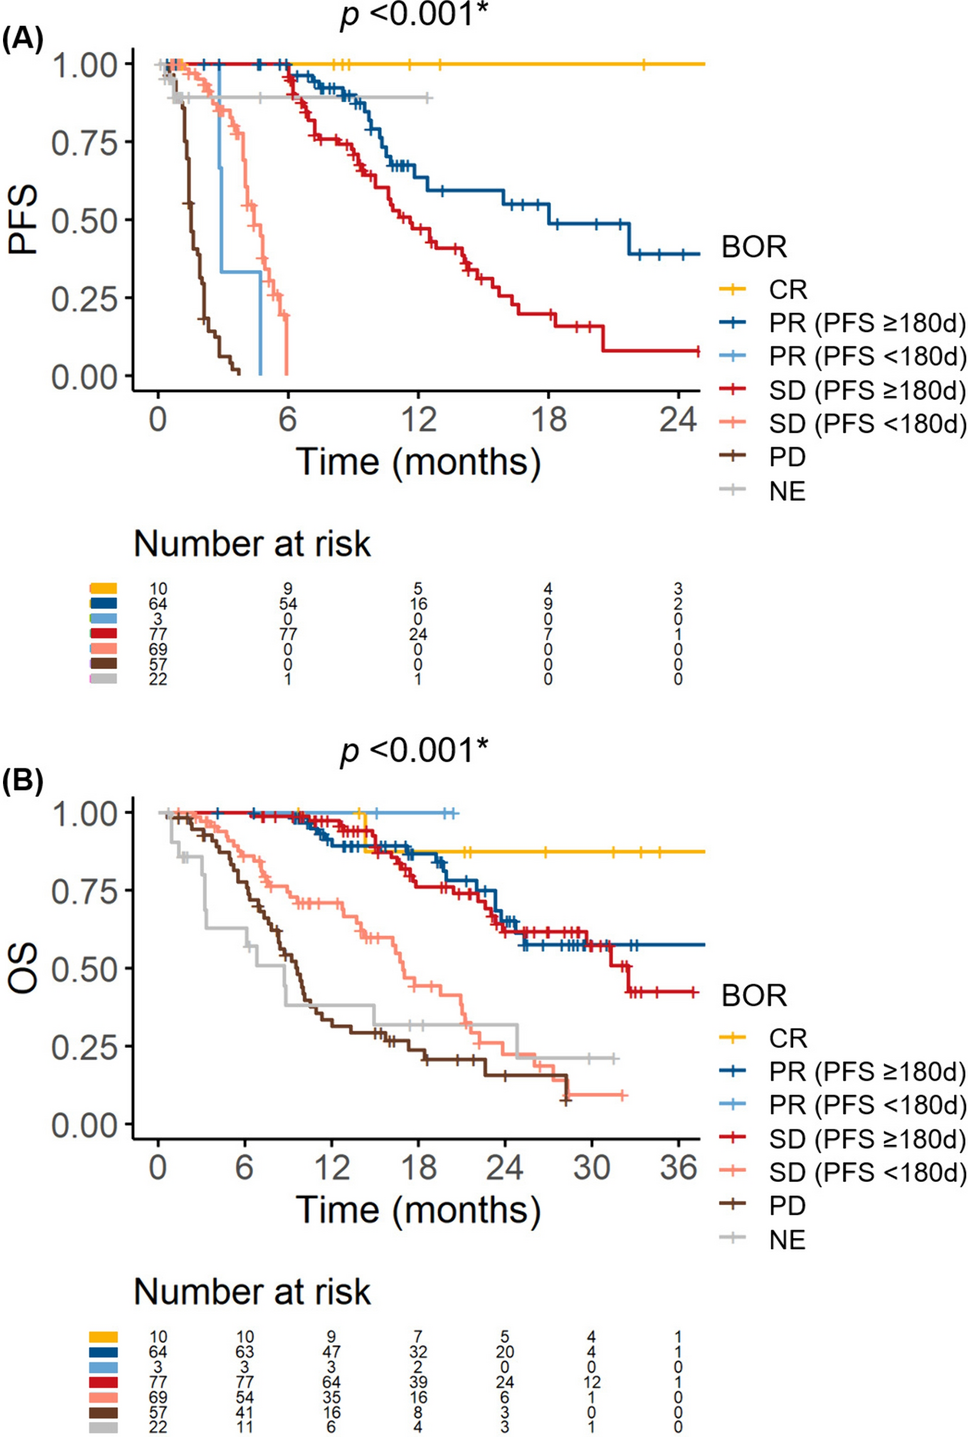


Table S1 presents an overview of the baseline characteristics of patients in both the overall and first-line cohorts. Within the entire cohort, the median age was 73 years, with 238 (78.8%) patients being male. Most patients exhibited a performance status of 0 or 1, and a Child–Pugh score of 5 or 6. A total of 214 (70.9%) patients underwent Atezo/Bev therapy as their first-line treatment for HCC, while 63 (20.9%), 17 (5.6%), 6 (2.0%), and 2 (0.7%) patients received this regimen as the second, third, fourth, and fifth-line treatments, respectively. Among patients receiving second-line or later Atezo/Bev therapy, 77 (87.5%) patients had received lenvatinib as a prior treatment. Baseline characteristics were similar between the overall and first-line cohorts. The median follow-up period was 355 days. The ORR, DCR, median PFS, and median OS were 27.5%, 79.6%, 9.5 months, and 23.0 months, respectively, in the overall cohort, and 33.3%, 85.4%, 10.6 months and 23.8 months, respectively, in the first-line cohort.
Association between BOR and survival outcomes in the overall and first-line cohortsFirst, we examined the relationships between BOR and PFS/OS in the overall cohort. Both PFS and OS were significantly stratified based on the BOR (Fig. S2). We further observed that patients with a stable disease could be divided into two subgroups based on the PFS duration: those with a PFS of ≥ 180 days had similar PFS and OS to those with a partial response, while those with progression or censoring within 180 days had similar PFS and OS to those with a PD (Fig. 1). Thus, we opted to compare the refractory and clinical benefit groups in the main analysis (Fig. S1). Three patients exhibited a partial response and progression within 180 days. As they showed similar OS to other patients with a partial response (Fig. 1b), we did not exclude these patients from the clinical benefit group. Similar associations were observed between BOR and PFS/OS in the first-line cohort (Fig. S3).
Fig. 1
Survival outcomes stratified by best overall survival (BOR) (overall cohort). A Progression-free survival (PFS). B Overall survival (OS). In both figures, patients with a stable disease (SD) and PFS ≥ 180 days had similar survival outcomes to those with a partial response (PR). Meanwhile, patients with a SD and PFS < 180 days had similar outcomes to those with a progressive disease (PD). CR complete response, NE not evaluable
Refractory rate and baseline characteristics related to refractoriness in the overall cohortIn total, 126 patients (41.7%) were refractory to Atezo/Bev therapy, while 154 patients (51.0%) experienced clinical benefit. This included 10 patients with complete response and 67 with partial response (Fig. S1). The overall cohort demonstrated a PD rate of 18.9% (57/302).
Baseline clinical characteristics were compared between the refractory and clinical benefit groups (see Table S2). In the univariate analysis, significant differences were observed in treatment line, performance status, Child–Pugh score, albumin-bilirubin (ALBI) score, modified ALBI (mALBI) grade, Barcelona Clinic Liver Cancer (BCLC) stage, and presence/absence of macrovascular invasion. As the second or later line of treatment showed a significant association with a higher refractory rate (54/82, 65.9% vs. 72/198, 36.4%; p < 0.001), and our focus was on identifying predictors for poor response to first-line Atezo/Bev therapy, we restricted the study population for subsequent analysis to those who received this therapy as their first-line treatment. In the first-line cohort, 72 patients (33.6%) were refractory to Atezo/Bev therapy, while 126 patients (58.9%) experienced clinical benefit (Fig. 2). The first-line cohort exhibited a PD rate of 13.6% (29/214).
Fig. 2
Patient allocation (1st-line cohort). Patients were classified into the refractory or clinical benefit group based on their best overall response (BOR) and progression-free survival (PFS). Patients with a progressive disease (PD) were categorized as the PD group. Some patients were not included in either group. Atezo/Bev atezolizumab plus bevacizumab, SD stable disease, PR partial response, CR complete response, NE not evaluable
Literature review of potential predictors for refractorinessThe results of the literature review are summarized in Table S3. The most validated marker was the neutrophil-to-lymphocyte ratio (NLR), originally reported from one of our affiliated institutions [10]. However, the associated cut-off values differed among studies. The second most validated marker was the (modified) ALBI grade/score, which was first reported by de Castro et al. [17]. The C-reactive protein (CRP) and AFP in immunotherapy (CRAFITY) score, in which the variables AFP ≥ 100 ng/mL and CRP ≥ 1 mg/dL are each assigned 1 point, was initially reported to be associated with the efficacy of programmed death 1 (PD-1)- or programmed death ligand 1 (PD-L1)-based immunotherapy [18]. Its association with the efficacy of Atezo/Bev therapy was subsequently reported by three groups [11, 19, 20]. Other predictive markers had either no or a limited number of validation reports. Among the extracted scoring systems, the CRAFITY score, modified ALBI grade and AFP (mALF) score, neo-Glasgow prognostic score, Atezo/Bev index, and geriatric nutritional risk index could be calculated without missing data in this study.
Predictors for refractoriness in the first-line cohortIn the first-line cohort, worse performance status, Child–Pugh score, ALBI scores, and mALBI grade, advanced BCLC stage, presence of macrovascular invasion, and certain laboratory data including CRP, AFP, and DCP were significantly associated with a higher refractory rate (Table 1). The performance of each potential predictor identified through the literature review is summarized in Table 2. Continuous markers tended to exhibit a good AUROC; however, their predictive values with a specific cut-off value were not sufficient. Among categorical predictors, both the mALF score and CRAFITY score demonstrated a good AUROC and a high PPV. Although the difference in the AUROCs of these two parameters in predicting refractoriness was not statistically significant (p = 0.142) (Figure S4A), a multivariate analysis using the Cox proportional hazard model identified a CRP of ≥ 1.0 mg/dL (a component of the CRAFITY scoring system) as the most significant factor for PFS, compared with mALBI grade 2b/3 (a component of the mALF scoring system) and an AFP of ≥ 100 ng/mL (a component of both systems) (Table S4). Therefore, the CRAFITY score was the optimal method for predicting poor responders to first-line Atezo/Bev therapy. Nonetheless, a multivariate analysis including the CRAFITY score, performance status, mALBI grade, BCLC stage, and macrovascular invasion revealed that both CRAFITY score and mALBI grade 2b/3 were independently and significantly associated with refractoriness in the first-line setting (Table 3). In addition, subgroup analyses consistently showed a negative impact of a CRAFITY score of 2 on the risk of refractoriness (Table S5).
Table 1 Comparison of the baseline characteristics between the refractory and clinical benefit groups in the first-line cohortTable 2 Performance of potential predictors for refractoriness to atezolizumab plus bevacizumab therapy in the first-line setting (main analysis cohort)Table 3 Multivariate analysis of the predictors for refractoriness in the first-line setting (main analysis cohort)As a sensitivity analysis, we compared the baseline characteristics between the PD and clinical benefit groups. Similar to the main analysis, the PD group had significantly worse ALBI score and mALBI grade, more advanced BCLC stage, higher frequency of macrovascular invasion, and higher levels of CRP, AFP, and DCP compared with the clinical benefit group (Table S6). The performance of each potential predictor in distinguishing between these two groups is summarized in Table S7. The CRP and AFP levels showed relatively robust AUROC values among the continuous variables, and the CRAFITY score demonstrated the highest PPV among all predictors. The AUROC values of the CRAFITY and mALF scores were not significantly different (p = 0.549) (Fig. S4B). These results supported the robustness of CRAFITY score’s high performance in predicting poor response to first-line Atezo/Bev therapy.
Associations between the CRAFITY score with BOR, OS and PFSFinally, we investigated the impact of the CRAFITY score on BOR, OS, and PFS; in this analysis, all patients were analyzed irrespective of their BOR or PFS. In the first-line setting, the refractory rate significantly increased along with the CRAFITY score, with rates of 24.6%, 44.6%, and 57.9% in patients with CRAFITY-0, 1, and 2, respectively (p < 0.001) (Fig. 3A). The PD rates were 7.7%, 16.9%, and 42.1% in patients with CRAFITY-0, 1, and 2, respectively (p < 0.001). Complete response was only achieved in CRAFITY-0 patients. The CRAFITY score significantly stratified OS and PFS. The median OS was not reached, 16.7 months, and 6.2 months in patients with CRAFITY-0, 1, and 2, respectively (p < 0.001) (Fig. 3B). Compared to CRAFITY-0 patients, hazard ratios of OS in CRAFITY-1 and 2 patients were 2.86 (95% confidence interval, 1.76–4.64) and 8.83 (4.63–16.86), respectively. The median PFS was 12.4 months, 9.5 months, and 1.5 months in patients with CRAFITY-0, 1, and 2, respectively (p < 0.001) (Fig. 3C). Hazard ratios of PFS in CRAFITY-1 and 2 patients were 1.49 (0.95–2.34) and 5.00 (2.55–9.81), respectively.
Fig. 3
Associations between the CRAFITY score and treatment outcomes with first-line atezolizumab plus bevacizumab therapy. A Best overall response (BOR) in patients stratified by CRAFITY score. Red and blue columns represent the refractory and clinical benefit groups, respectively. CR complete response, PR partial response, SD stable disease, PFS progression-free survival, NE not evaluable, PD progressive disease. B Overall survival (OS) stratified with the CRAFITY score. C PFS stratified with the CRAFITY score
Similarly, in the second- or later-line setting, the refractory rates significantly increased along with the CRAFITY score, with rates of 45.8%, 75.9%, and 90.0% in patients with CRAFITY-0, 1, and 2, respectively (p = 0.001) (Fig. 4A). The PD rates were 16.7%, 51.7%, and 50.0% in patients with CRAFITY-0, 1, and 2, respectively (p = 0.002). The median OS was 23.3 months, 20.9 months, and 6.1 months in patients with CRAFITY-0, 1, and 2, respectively (p < 0.001) (Fig. 4B). The median PFS was 9.4 months, 2.8 months, and 1.9 months in patients with CRAFITY-0, 1, and 2, respectively (p < 0.001) (Fig. 4C).
Fig. 4
Associations between the CRAFITY score and treatment outcomes with second- or later line atezolizumab plus bevacizumab therapy. A Best overall response (BOR) in patients stratified by the CRAFITY score. Red and blue columns represent the refractory and clinical benefit groups, respectively. CR complete response, PR partial response, SD stable disease, PFS progression-free survival, NE not evaluable, PD progressive disease. B Overall survival (OS) stratified with the CRAFITY score. C PFS stratified with the CRAFITY score
留言 (0)