We conducted a single-center study using a prospective cohort design.
Setting and Participants
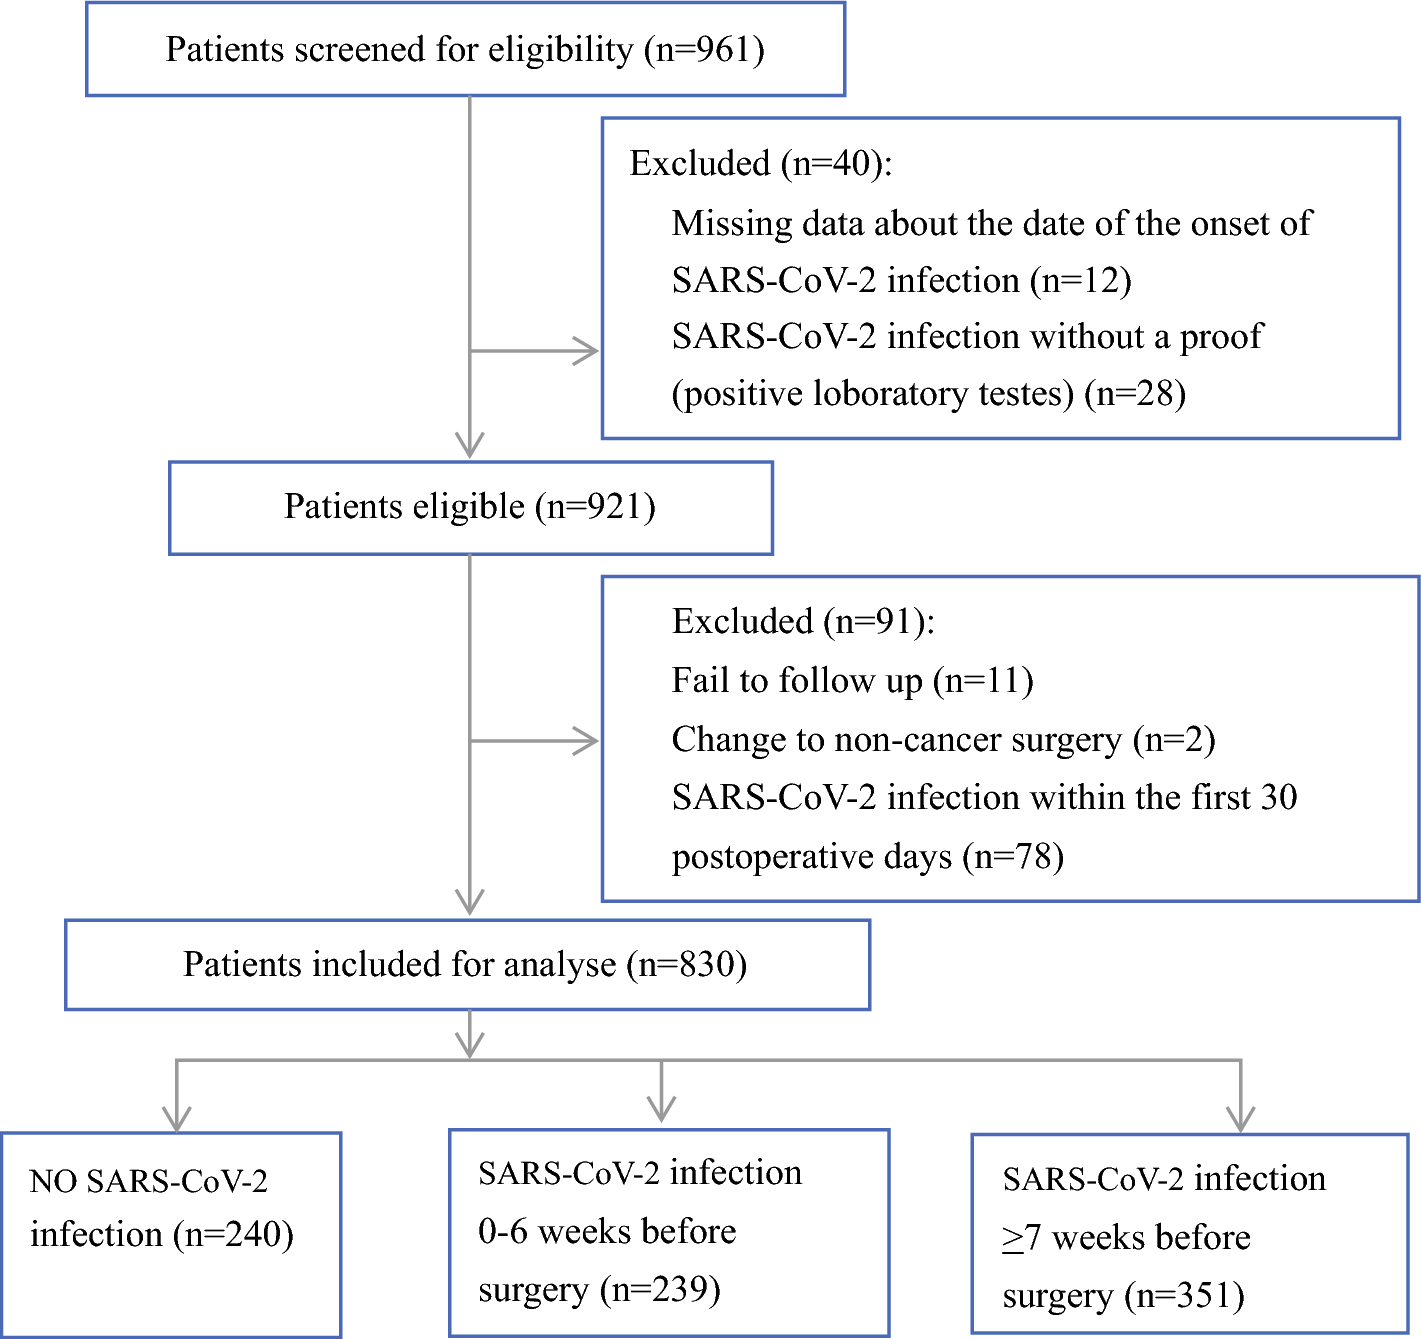
Using a consecutive sampling method, participants were recruited from the First Affiliated Hospital of Nanjing Medical University between September 2021 and May 2022. Study participants were adults (> 18 years of age) who were newly diagnosed with GI cancer and were to receive gastric, esophageal, or colorectal surgery as their primary treatment. Patients were excluded if they (1) had physical deformities or severe cardiopulmonary complications or current psychiatric illnesses, (2) were receiving palliative surgery, (3) were diagnosed with cancer cachexia at admission, or (4) were unavailable for follow-up. The trained nurses reviewed patients’ records and assessed their eligibility at admission. Eligible patients were invited to the study and those who expressed interest were referred to the first author (XX) for further study information and written consent. The consent process was completed before the surgery.
The sample size was first estimated on the basis of the prevalence of postoperative SML as reported in previous studies.12,15 The minimum sample size requirement was 345 assuming a prevalence of 34%. We also assumed there were at least two latent subgroups within the sample on the basis of the patterns of change in postoperative SMM. Growth mixture modeling was used to identify the subgroups, and a minimum of 200 participants was required for model construction.21 Assuming 10% of loss to follow up,22 the estimated sample size for this study was 384. Although recruitment reached the estimated sample size by February 2022, a decision was made to extend the recruitment period by 3 months to recruit as many participants as possible due to high dropout rate caused by coronavirus disease 2019 (COVID-19)-related restrictions at the participating site and nearby areas.
This study was approved by the Human Research Ethics Committees of the Nanjing Medical University (approval no. 2021-606) and the Queensland University of Technology (approval no. 2021-4223).
Measurements and Data CollectionSkeletal Muscle Mass
Participants’ SMM was the primary outcome of this study, assessed by bioelectrical impedance analysis (BIA) using Inbody 270 (Biospace, Seoul, Korea) at four timepoints: T0 (at admission/the day before surgery), T1 (7 days after surgery/at discharge), T2 (1 month after surgery), and T3 (3 months after surgery). All measurements were carried out by the first author (XX) following the instructions of the manufacturer.
Skeletal muscle index (SMI) was calculated by dividing the appendicular SMM (kg) by the square of the body height (m2).23 Since the definition of normal SMI is gender specific (i.e., SMI ≥ 7.0 kg/m2 for male participants and ≥ 5.7 kg/m2 for female participants) according to the Asian Working Group for Sarcopenia (AWGS) 2019 criteria,23 we proposed a new measure, namely, derived skeletal muscle index (dSMI), to count the difference between individual SMI and the gender-specific norm. dSMI ≥ 0 indicates that the individual’s SMM is normal, while dSMI < 0 indicates that the individual has low SMM. In addition, low SMM, low muscle strength, and/or low physical performance were considered as sarcopenia.23 Low muscle strength was defined as handgrip strength < 28 kg for male participants and < 18 kg for female participants, while low physical performance was defined as a gait speed < 1 m/s.23 The methods of handgrip strength and gait speed measurements were followed as suggested by AWGS.23 The postoperative skeletal muscle change (ΔSMI) at each timepoint was calculated using the following equation:
$$\Delta }(\% ) = \frac}\,}\,}\,(}\,}\,}2\,}\,}3) - }\,}\,}0}}}\,}\,}0}} \times 100\% .$$
Postoperative Complications
Postoperative complications were regularly monitored and assessed by the participant’s treating specialists. We obtained the data from participants’ medical records. According to the Clavien–Dindo classification (CDC), the severity of postoperative complications was graded from I to V, with total complications classified as CDC > II and severe complications as CDC ≥ IIIa.
Patient-Reported Quality of Life
The simplified Chinese version of the European Organisation for Research and Treatment of Cancer (EORTC) Quality of Life Core Questionnaire (QLQ-C30) was used to evaluate health-related QoL, including one global scale, five functional scales, and eight symptom scales.24 All scales score from 0 to 100. A higher score for the global health status or functional scale represents better QoL or functioning; a higher score for a symptom scale indicates more severe symptoms. All participants were asked to complete the questionnaire at each time of the BIA test. If the participant was not able to attend the follow-up BIA tests at the hospital, the questionnaires were completed by telephone interview. Different modes of administration (i.e., telephone interview versus self-administration at the hospital) did not impact the reliability of the questionnaire.25
Predictors of Postoperative Skeletal Muscle Loss
A range of potential predictors of postoperative SML (as presented in Tables 1 and 2) was identified through literature reviews, including participants’ general demographic and clinical characteristics and relevant biomarkers. All data were obtained from their medical records at admission. Information in relation to GI surgery method, operation time, and intraoperative blood loss was also obtained from their medical records after surgery.
Table 1 Demographic and clinical characteristics of study participants at admissionTable 2 Biomarkers of study participants at admissionStatistical Analyses
Descriptive statistics were used to summarize baseline characteristics and muscle assessment at each timepoint by presenting means and standard deviations for normally distributed variables, median, and range for non-normally distributed continuous variables, and frequencies and percentages for categorical variables.
Patterns of Change in Skeletal Muscle Mass
Independent sample t-tests (for normally distributed measures) or Mann–Whitney U tests (for non-normally distributed measures) were performed to test the difference between postoperative SMI/dSMI and baseline SMI/dSMI, and SMI by cancer site at each timepoint. Pearson’s chi-squared tests were conducted to compare the prevalences of low skeletal muscle index (dSMI < 0), sarcopenia, and postoperative SML by cancer site at each timepoint. Growth mixture modeling (GMM) was used to examine heterogeneity among participants in relation to the patterns of change in postoperative SMM. dSMI was used as an indicator for SMM in GMM. The models were estimated using maximum likelihood estimator. The model fit was assessed using a combination of indicators: the smaller the value of Akaike information criterion (AIC) and Bayesian information criterion (BIC), the better the model fit. Entropy value above 0.8 was acceptable. When the Lo–Mendell–Rubin likelihood ratio test (LMR) and bootstrapped likelihood ratio test (BLRT) showed p < 0.05, k number of latent classes was viewed to be significantly better than k-1 classes.26 GMM was conducted using Mplus (version 8.0, Muthén & Muthén, USA).27 The number of the subgroups was identified on the basis of the characteristics of muscle change in each class. The demographic and clinical features of subgroups were then described and compared. Factors that showed a significant difference between subgroups were considered as potential predictors of postoperative SML.
Relationship Between Postoperative Skeletal Muscle Loss and Health Outcomes
The prevalences of total and severe postoperative complications in each identified subgroup were compared using a Pearson’s chi-squared test. Scores for each QLQ-C30 scale of the subgroups were compared at each timepoint. If two subgroups were identified, independent sample t-tests (for normally distributed measures) or Mann–Whitney U tests (for non-normally distributed measures) were performed. If multiple subgroups were identified, parametric (e.g., one-way analysis of variance) or nonparametric (e.g., Kruskal–Wallis H test) tests were applied. A post hoc test was conducted to identify which groups differed from each other.
Predictors of Postoperative Muscle Loss
The correlations between potential predictors were explored to check collinearity. Highly correlated potential predictors were removed on the basis of theoretical reasons before being included in the next logistic regression analysis. Univariate logistic regression analysis was conducted first to explore the relationship between each potential predictor and SML. Then, a forward stepwise method was used to construct a multiple logistic regression model and identify independent predictors of SML. The predictive ability was assessed using the area under ROC curve (AUC). The higher the AUC value, the better its ability to distinguish between muscle loss and non-muscle loss groups.
All participants had observations at baseline. However, some participants had missing data on the primary outcome (i.e., SMM) at follow-up. Rates of missing data at each timepoint were calculated, and the reasons and patterns of missing data were investigated. We compared the characteristics of participants who completed muscle assessment at all timepoints with those who did not. Assuming data were missing at random, multiple imputation was applied using chained equations. For the participants who had missing SMM at follow-up, the SMM of the one previous timepoint and other covariates (i.e., age, gender, stage of cancer, and cancer site) were used to impute the missing values. The number of imputed datasets was based on the percentage of missing data at T3, as suggested by Van Buuren.28 For example, if the rate of missing data was 30% at T3, 30 imputed datasets would be generated. The matrix and seed were set using the default settings. Results of imputed datasets were pooled using Rubin’s rules.29 The imputation was conducted in R studio (version 4.1.3) using the Multivariate Imputation by Chained Equations (MICE) package. Further analysis was performed to compare whether there were differences between completed cases and imputed values in relation to baseline characteristics and QoL of the participants, and patterns of change in SMM. If the results of complete cases and imputed values were qualitatively the same, only the findings from complete cases analysis were reported.
All analyses were conducted in SPSS (version 26.0) unless specified. A two-tailed p value < 0.05 was considered statistically significant for all tests in this study.


留言 (0)