Antibody conjugation and characterization
Upon buffer exchange using an Amicon 50 kDa centrifugal filter, a commercially available anti-mouse CXCR3 mAb (clone: CXCR3-173, #Cat: BE0249, BioXcell) was site-specifically conjugated with NOTA according to a previously published protocol conjugated with (AbYlink™, Debiopharm) [22]. Briefly, the antibody (1 eq.) was resuspended in carbonate buffer (0.2 M, pH = 9). The conjugation mix (2.2 eq.) containing AbYlink-Bn-NOTA was added and the reaction was gently agitated for 2 h at RT. Next, the reaction mixture was quenched for 5 min at RT with glycine buffer (0.4 M, pH 2.5, 50 µL/mg antibody). Purification was performed using a EMP Biotech CentriPure PF10 centrifugal device. The product was eluted using glycine buffer (0.1 M, pH = 2.5) into a tube containing the neutralization buffer (0.22 mL/mL of eluate, 0.5 M phosphate buffer, pH = 8.5). The average degree of conjugation (DoC) was determined by mass spectrometry analysis operating in protein mode (Sion, EPFL) and the final antibody concentrations were determined by a NanoDrop One/One spectrophotometer (Thermo Fisher).
Radiolabeling
A solution of 64Cu dichloride in 0.1 N HCl was obtained from ARRONAX (Saint Herblain, France). To a defined volume of the 64CuCl2 solution supplied by the manufacturer, 1/10 (v/v) of metal free sodium acetate 2.5 M (pH = 8.5) was added. Then, the radiolabeling precursor (30–80 µg) in acetate buffer (0.1 M, pH = 5.5) was added. After 30 min incubation at 40 °C, 1 mM ethylenediaminetetraacetic acid (EDTA) (pH = 7.0, Sigma Aldrich, St. Quentin Fallavier, France) was added to obtain a final concentration of 0.01 mM to complex free 64Cu2+. Molar activity (MA) was calculated by the decay-corrected activity from the synthesis start divided by the molar mass of a full-size antibody (150 kDa).
Size exclusion chromatography
Size exclusion chromatography (SEC) was performed on a Shimadzu (LC20AT, SPD-M20A) system using a XBridge protein BEH 200 A Sect. 3.5 μm, 7.8 × 300 mm (Waters, Baden-Dättwil, Switzerland) size exclusion column and phosphate buffer (0.1 M, pH 6.8) containing 342 mM NaCl at a constant flow of 1 mL/min as mobile phase. UV detection was performed at 220, 254 and 280 nm, and the radioactivity signal was detected using a GABI well-type scintillation detector (Elisa-Raytest). Unconjugated α-CXCR3: Rt (retention time) 8.5 min, purity 99.2%; NOTA-α-CXCR3: Rt 8.5 min, purity 98.8%; [64Cu]Cu-NOTA-α-Cxcr3: Rt 8.6 min, radiochemical purity (RCP) > 99%.
Stability in human serum
To a volume of 500 µL of human serum, 50 µL of radiotracer were added. The mixture was incubated at 37 °C. SEC analyses were carried out after 24 and 48 h of incubation. Before injection, 100 µL of the sample were passed through a 0.2 μm filter.
[64Cu]Cu-NOTA-α- CXRCR3: Rt = 8.6 min, RCP after 24 and 48 h > 95%.
Instant thin layer chromatography (iTLC)
In-process reaction controls were performed using iTLC. The radiochemical yield (RCY) of [64Cu]Cu-NOTA-α-CXCR3 was determined by instant thin layer chromatography (iTLC) using dried iTLC-SG Glass microfiber chromatography paper impregnated with silica gel (Agilent Technologies, Folsom, CA 95630) as stationary phase and citrate buffer (0.1 M, pH = 4.5) as eluent. For iTLC evaluation, a Scan-RAM radio-TLC scanner (LabLogic) and Laura software (LabLogic, Version 6.0.3) were used.
[64Cu]Cu-EDTA, Rf = 1; [64Cu]Cu-NOTA-α-CXCR3, Rf = 0.
Saturation binding assay
Transfected CHO-CXCR3 cells were maintained and expanded using Ham’s F-12 Nutrient Mix cell culture media (Thermo Fisher Scientific) supplemented with 10% fetal bovine serum (FBS) and 1% penicillin/streptomycin in a cell incubator at 37 °C, 5% CO2. 2 × 10⁶ CHO-CXCR3 cells were seeded in in a 6-well plate one day before the experiment. On the day of the experiment, the growth medium was removed and the cells were washed once with cold assay buffer (0.5% BSA in PBS). Then, 800 µL of assay buffer were added into each well, and the radiolabeled antibody (100 µL, increasing concentrations, n = 3 per concentration) was added. Additionally, 100 µL assay buffer were added to the wells to reach a final volume of 1 mL. Final concentrations of [64Cu]Cu-NOTA-α-CXCR3 were as follows: 25, 10, 1, 0.5, 0.25, 0.125 and 0.063 nM (n = 3 per radioligand concentration). To determine non-specific binding at each radioligand concentration, radioligand binding was also investigated in the presence of a 100-fold excess of unlabeled α-CXCR3. Here, 100 µL of α-CXCR3 antibody in assay buffer was added to the well to reach a final volume of 1 mL (n = 3 per radioligand concentration). Plates were incubated for 2 h at 4 °C. The supernatant was removed and combined with 1 mL of assay buffer using for washing the cells. The cells were then lysed with 1 M NaOH. The cell lysate was then combined with 1 mL of assay medium using for washing the wells. Both the activities in the supernatants and the respective lysates were quantified using a y-counter (Wizzard 3, Perkin Elmer). Non-specific binding and total binding were analyzed by GraphPad prism version 9.1.0.
Animal experiments
Animal experiments were conducted according to the protocols approved by the Veterinary Authorities of the Canton Vaud (license VD 3781) and in accordance with the Swiss Animal Welfare Act. Six to eight week-old female Bl57/6 mice were purchased from Charles River Laboratories (France, L’Arbresle). MC38 cells were maintained in RPMI 1640 GlutaMAX™ cell culture media (Thermo Fisher Scientific) supplemented with 10% FBS and 1% penicillin/streptomycin in a cell incubator at 37 °C, 5% CO2. Tumor engraftment and the subsequent treatment schedule were conducted as described previously [23]. Briefly, MC38 tumors were engrafted on the right flank by subcutaneous injection of 2 × 10⁶ cells in 100 uL PBS. The first treatment with immune checkpoint inhibitors (ICIs) was initiated at day 7 post-engraftment. The checkpoint inhibitor combination consisted of 200 µg αCTLA-4 (clone: 9D9, #Cat: BP0164, BioXCell) and 200 µg αPD-1 (clone: 29 F.1A12, #Cat: BE0273, BioXCell) and was injected i.p. in a total volume of 100 µL of sterile PBS. Additional treatments were administered on day 10 and on day 13 after tumor inoculation. At day 10 (untreated and 1xICI treated) and day 12 (2xICI treated) post-inoculation, MC38 tumors were dissected for flow cytometry, immunofluorescence, or immunohistochemistry analysis. Tumor size was monitored using caliper measurements and by applying the following formula to calculate the tumor volume: tumor volume = (length/2)* width2.
Flow cytometry
After harvesting the MC38 tumors, single cell suspensions were immediately generated by cutting the tumor in small pieces and incubating the tissue in 1 mL FBS containing collagenase IV (0.2 mg/L) and DNAse I (2 µg/L). Upon incubation at 37 °C for 20 min, the tissue was passed through a cell strainer and the cell suspension was washed two times with cold PBS. The cells were stained at room temperature for 25 min in flow cytometry buffer (PBS suppl. with 1 mM EDTA, 1% FBS). Control and FMO stains were performed on splenocytes. The following antibodies were utilized: Fc block (clone: 93, #Cat: 101302, Biolegend), DAPI (Invitrogen), CD45 (clone: 30-F11, #Cat: 103132, Biolegend), CD3 (clone: 145-2c11, #Cat: 100306, Biologend), CD4 (clone: Gk-1.5, #Cat: 552051, Biolegend), CD8: (clone 53 − 6.7, #Cat: 100712, Biolegend), CXCR3 (clone: CXCR3-173, #Cat: 126502, Biolegend). The antibody concentrations were 1 µg/mL in flow cytometry buffer. DAPI was added to each sample to yield a final concentration of 0.5 µg/mL and the cells were washed once. The cells were fixed with 2% PFA in PBS on ice. Precision count beads (#Cat: 424902, Biolegend) were added to each tumor sample and compensation beads were used (#Cat: 01-3333-42, Thermo Scientific) to set up the panel. The analysis was performed on a BD FACSymphony A5 Flow Cytometer on the same day. The data was evaluated using FlowJo V10.7.1.
Immunofluorescence
Immunofluorescence staining was performed using acetone fixed tissue slices. The tissues were blocked with donkey and goat serum (10%) for 20 min. After washing the samples in 0.3% triton in PBS, tissues were incubated with the primary antibodies (1:50, diluent DAKO S3022) for 60 min at RT. After another washing step, the cells were incubated with the respective fluorescent secondary antibody (1:500, diluent DAKO S3022) for 30 min at room temperature. DAPI (Sigma, #Cat: D9542, 1:3000 dilution in PBS) was used to stain the cell nuclei. After the slices had been rinsed with distilled water, the slices were covered with water-based mounting media (DAKO S3023) and glass square coverslips. Negative controls were incubated with the fluorescent secondary antibodies only. For fluorescence microscopy image evaluation, the QuPath version 0.3.2 software for digital pathology image analysis was used by applying a trained object classifier for the positive cell annotation [24].
Immunohistochemistry
Immunohistochemistry was performed on acetone fixed slices. The tissues were blocked with goat serum (10%) for 20 min. After washing the samples in 0.3% triton in PBS, tissues were incubated with the respective primary antibodies (1:200, diluent DAKO S2022) at room temperature for 40 min. After another washing step, the slices were incubated with the secondary antibody (HRP-conjugated anti-rabbit, DAKO K4003) for 30 min at room temperature. After another washing step, the staining was completed by DAB chromogen revelation (DAKO K3468). Harris Gill II was applied as control color. Subsequently, the slides were dehydrated in xylol and covered with permanent mounting. Negative tissues were stained with the secondary antibody (HRP anti-rabbit) only.
Autoradiography
Autoradiography experiments were performed on a BeaQuant S real time autoradiography instrument (ai4R, Nantes). The radiotracer [64Cu]Cu-NOTA-α-CXCR3 (2–3 MBq, 3 µg, containing 50 µg polyclonal Armenian hamster IgG (BioXCell, #BE0091)) was injected, and at 24 h p.i., the spleens were harvested and transferred to optimal cutting temperature compound (O.C.T. Tissue-Tek, Sakura Finetek). Spleens were immediately frozen on dry ice. Slices (8 μm) were cut and left to dry on the glass plate for 2 h at RT. The autoradiography measurement was performed overnight for 24 h. Images were analyzed using BEAMAGE (v3.3.X) software.
Biodistribution study
ICI treated MC38 tumor bearing mice were injected intravenously into the tail vein with 1.5 µg (3 MBq) or 15 µg (1 MBq) [64Cu]Cu-NOTA-α-CXCR3 in 100 µL sterile 0.9% NaCl on day 9 (untreated and 1xICI treated) and on day 12 (2xICI treated) post-inoculation. To reduce Fc-mediated non-specific tracer accumulation, mice were coinjected with 50 µg polyclonal Armenian hamster IgG (BioXCell, #BE0091). To quantify CXCR3-specific tracer accumulation, an additional group of mice (n = 3–5) was coinjected with a 100-fold excess of unconjugated α-CXCR3. The animals were sacrificed 24 h (15 µg, 1 MBq injected activity) or 48 h (1.5 µg, 3 MBq injected activity) post-injection of the 64Cu-labeled antibody, and the organs of interest were dissected. The activity in the weighed tissue samples was quantified using a Wizard 3 y-counter (Perkin Elmer, Schwerzenbach). Data are expressed in %IA/g tissue (mean ± SD) and are corrected for residual injection-related activity in the tail.
PET/CT imaging
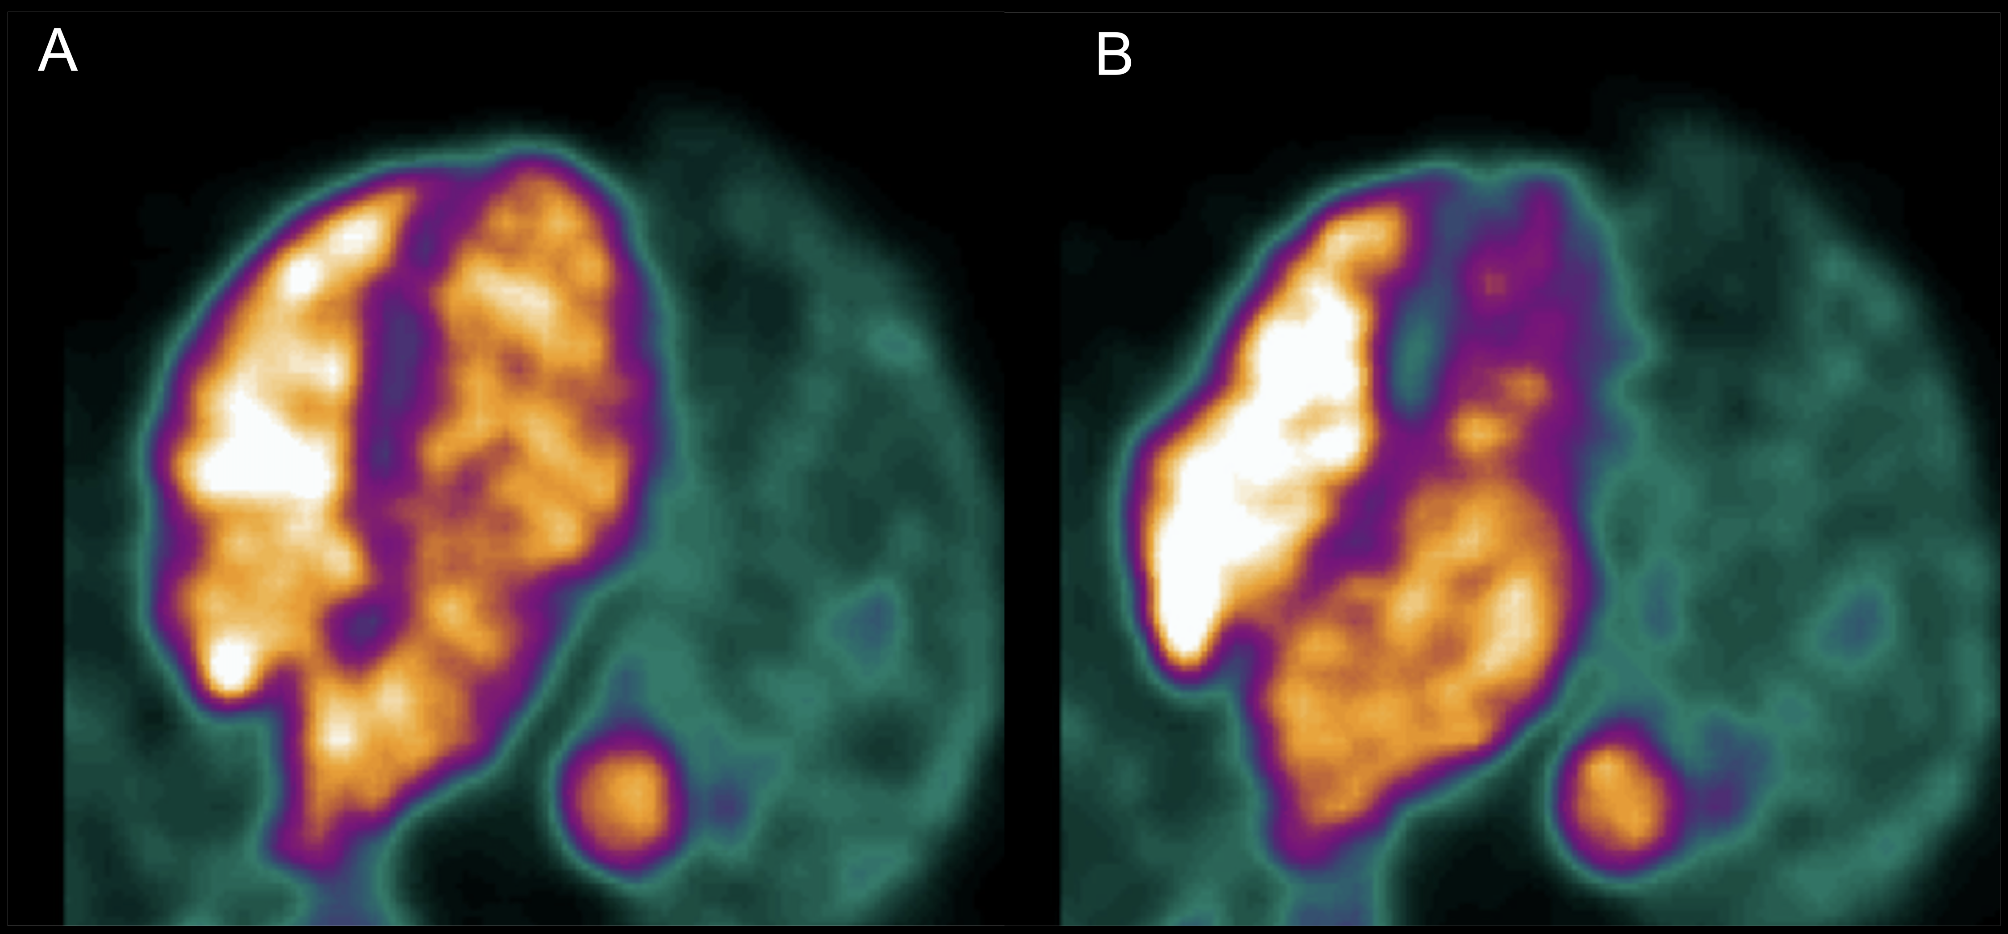
PET/CT images were acquired at 24 h p.i. on an Albira PET/SPECT/CT scanner (Bruker Biospin Corporation, Woodbridge, CT, USA) Mice were injected intravenously with [64Cu]Cu-NOTA-α-CXCR3 (3 MBq, 1.5 µg) in saline. As described for the biodistribution study, CXCR3-specificity of tracer accumulation was determined by coinjection of a 100-fold excess of unlabeled α-CXCR3 mAb. During image acquisition (static scan, 20 min, 32 × 32 0.5 mm, followed by a 10 min CT scan), the animals were anesthetized using isoflurane (1.5% alveolar concentration). During imaging, the body temperature and respiration rate was constantly monitored. Image reconstruction was performed by using Albira reconstructor (version NMI3.3), and the images were analyzed using PMOD software (V6.3.4, Bruker).
Statistical analysis
All data were evaluated using GraphPad Prism version 9.1.0 for Windows, GraphPad Software, San Diego, California USA. A two-way ANOVA test followed by a Tukey’s multiple comparisons test was applied to determine the significance (P < 0.05) of the differences in CXCR3 positivity between the respective flow cytometry sample groups. A two-way ANOVA test followed by a Dunnett’s multiple comparisons test was applied to determine the significance (P < 0.05) in the differences in tracer uptake between groups in the biodistribution experiments. A one-way ANOVA test followed by a Dunnett’s multiple comparisons test was equally applied to determine the significance (P < 0.05) of the differences in the organ/liver or organ/blood ratios.


留言 (0)