Study design and participant enrollment
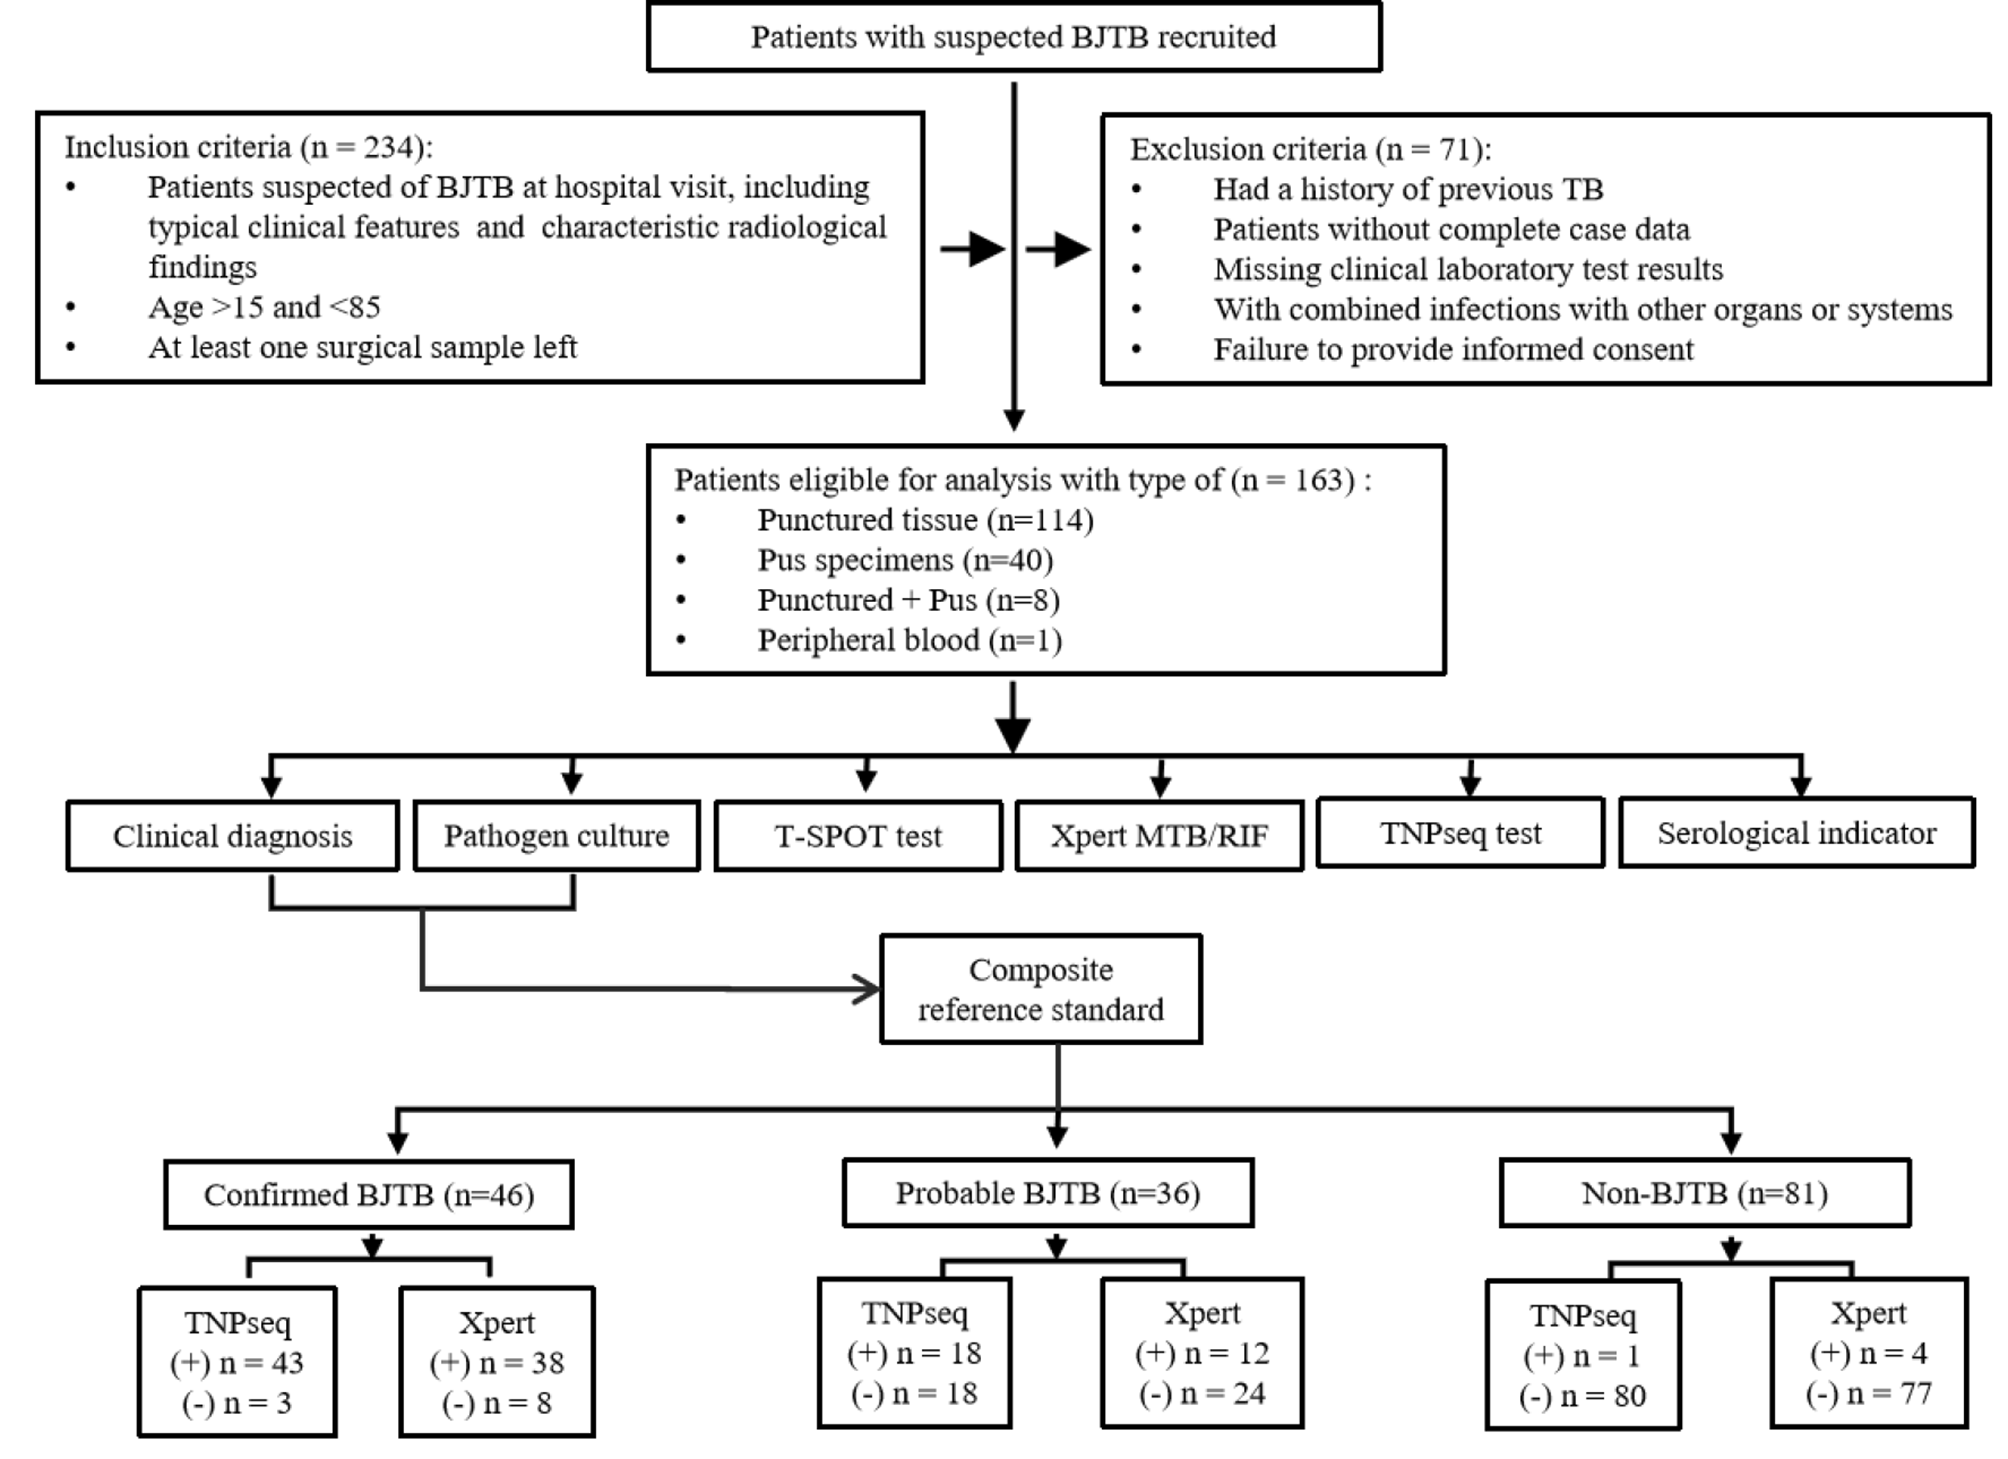
This study was conducted from July 2022 to June 2023 at the Orthopedic Hospital, Public Health Clinical Center, Shandong Province, China, with 234 clinical specimens suspected of BJTB. Participants presented with BJTB-related signs and symptoms, and surgical specimens were collected. The protocol (No. GWLCZXEC-AF-03-1-1) was ethically approved, and all patients gave informed consent.
The study inclusion criteria were as follows: (1) patients suspected of having BJTB on admission to hospital, with typical clinical features of TB and characteristic radiological findings on x-ray, computed tomography (CT) and magnetic resonance imaging (MRI); (2) patients between 15 and 85 years of age; (3) patients from whom at least one sample of infected site pus and one sample of blood were obtained within 1 h before surgery; (4) patients without tissue samples had to have at least one sample of infected site tissue; (5) a minimum of 150 patients were to be included.
Study exclusion criteria were as follows: (1) individuals who had received anti-TB treatment in the previous 2 months; (2) individuals with incomplete case information; (3) individuals with incomplete clinical laboratory test results; (4) individuals with combined infections of other organs or systems; (5) individuals who did not provide informed consent.
Sample collection
Pus specimens: Specimens were obtained intraoperatively to collect pus from the joint space within the patient’s lesion, necessitated by the presence of an abscess. Punctured tissue: When pus was not easily obtained from patients, the puncture technique was used to obtain samples from the necrotic bone or granuloma surrounding the lesion site. Peripheral blood: Approximately 10 mL of peripheral venous blood was collected from each patient under strict aseptic conditions. The collected pus samples were gently vortexed and then aseptically divided into two undiluted aliquots. Similarly, the punctured tissue was divided equally into two unbiased segments. One segment was sent to the microbiology laboratory of the Orthopedic Hospital of the Shandong Provincial Public Health Clinical Center for bacterial culture analysis. The second segment was immediately sent to Hangzhou ShengTing Biotechnology Co. Ltd. in Hangzhou, China for TNPseq processing using cold chain logistics. Both laboratories followed the “National Clinical Testing Practice for Pathogen Detection in Clinical Microbiology Laboratory” protocol for standard analytical procedures.
Clinical microbiology testCulture
Two milliliters (2 mL) of samples were first digested and decontaminated with N-acetyl-L-cysteine/NaOH as described in previous research [5]. The precipitate was concentrated by centrifugation and the supernatant was discarded. Phosphate buffered saline (pH 6.8) was added to the precipitate to a final volume of 2.5 mL. Then 0.5 mL of this mixture was added to a 7 mL MGIT tube. The 7H9 Middlebrook broth (BD-Difco, USA) in the MGIT tube contained nutrients necessary for the growth of M.tb, while the BBL MGIT PANTA antibiotic mixture (BD-Difco, USA) provided an environment conducive to the selective growth of M.tb while inhibiting the growth of other bacteria. Tubes were then incubated in the MGIT 960 TB System (BD-Difco, USA) for automated reporting.
T-SPOT assay
Following the protocol of Patel et al. [8], 2–3 mL of peripheral blood was collected. The reagent provided in the T-SPOT kit (Oxford Immunotec Ltd., UK) was added and the mixture was incubated at 37 °C for 20 min. The supernatant was carefully removed with a special pipette and transferred to antigen-coated discs. After the incubation period, the antigen plate was removed from the incubator and placed in a specialized plate reader. The output of the plate reader was used to determine the presence and extent of M.tb-specific T-cell responses.
Molecular detection testSample preparation
Pus specimens: 1 mL of the sample was added to a tube containing 1 mL of phosphate buffered saline (PBS) and mixed thoroughly. Punctured tissue: Tissue block was cut into small pieces and added to 2 mL of PBS. The tissue was then ground to a homogeneous suspension using a tissue grinder. Peripheral blood: Blood was first centrifuged, then mononuclear cells were isolated. 2 mL of the top layer of plasma was transferred to a new pretreated tube and the sample was maintained at 30 ℃.
Xpert MTB/RIF assay
Following the methodology described in previous research [3], 1 mL of sample suspension was transferred to a separate tube to which 2 mL of Xpert Sample Reagent was added. The contents were vortexed for at least 10 s and incubated at 20 °C for 15 min. After incubation, 2 mL of the mixture was transferred to an Xpert Reaction Cartridge, which was then inserted into the Xpert instrument. Assay results were automatically generated within 2 h.
TNPseq assay
Sample processing
The samples were centrifuged and then digested with proteinase K and lysozyme. They were then thoroughly ground with zirconia beads for 1 min to break down the cell walls. After grinding, lysis was achieved by adding a lysozyme solution, and the resulting lysate was used for nucleic acid extraction using the QIAamp DNA Microbiome Kit (QIAGEN, Canada). A negative control consisting of blank elution buffer was included for the extracted nucleic acids. The concentration of the extracted DNA was measured using the Qubit dsDNA Quantification Assay Kit (ThermoFisher, USA).
For detection, the bacterial 16 S rRNA gene was targeted with universal primers 27 F/1492R, while the fungal ITS1/2 gene was amplified by PCR using ITS1/4 primers. PCR was performed on an ABI 2720 thermocycler under the following conditions: initial denaturation at 95 °C for 3 min, followed by 30 cycles of 95 °C for 30 s, 62 °C for 60 s, and 72 °C for 60 s, with a final extension at 72 °C for 3 min. PCR products were then purified and quantified using the Invitrogen Qubit 4 Fluorometer in preparation for library construction and subsequent TNPseq sequencing.
Library preparation
Nanopore Barcode PCR was performed on the above PCR products according to the PCR Barcode Expansion Pack 1–96 (EXP-PBC096) to generate the sequencing libraries. After initial start-up of the sequencing chip, approximately 100 ng of the library pools were loaded into the nanopore flow cell for sequencing on the GridION platform. MinKNOW version 2.0 software was used to facilitate data output for base calling. Barcode demultiplexing was then performed using Porechop.
Identification of pathogen and drug resistance genes
The EPI2ME platform was used through the 16 S workflow. Raw data was converted into Fastq file using Guppy base calling software. Reads less than 200 bp or greater than 2000 bp with a quality score of Q < 9 were filtered out, and the remaining high quality reads were aligned to all targets and potential etiologies using the National Center for Biotechnology Information (NCBI) Basic Local Alignment Search Tool (BLAST). Pathogens were categorized at the species level based on coverage and identity. In general, the top 10 microorganisms sorted by aligned reads with a relative abundance score greater than 0.5% were classified as pathogens and further evaluated. M.tb is considered positive if at least one sequence is mapped to a species or genus. All these steps in the TNPseq assay were performed according to our previous report [16]. The TNPseq assay allows simultaneous detection of multiple pathogens and drug resistance. It accurately identifies a wide range of important pathogens, such as M.tb and non-tuberculous mycobacteria, and detects 21 drug resistance genes, including rpoB for rifampicin and katG for isoniazid. Table S5 shows the range of resistance genes that can be identified by TNPseq. For more details on this procedure, see the study by Liu et al. [17].
Serum immunological test
Following the protocol established by Patel et al. [8], patient blood samples were collected into EDTA anticoagulant tubes. After centrifugation at 1000 g for 10 min, 25 µL of plasma was aliquoted into assay tubes. An equal volume of buffer, as required by the flow cytometer, was added along with microbeads conjugated to antibodies against IL-6, IFN-γ, IL-10, and other markers, as well as the appropriate detection antibodies. Streptavidin-phycoerythrin (SA-PE) conjugated to allophycocyanin (APC) was then added and the mixture was analyzed using a Navios flow cytometer (Beckman, USA). Upon completion of the flow cytometric analysis, the calibration standards and sample data were imported into the LEGENDplex 8.0 software for analysis, which provided the concentrations of the respective cytokines for each sample.
Patient categories
Clinical diagnostic criteria included a comprehensive evaluation that included a detailed medical history, serologic testing, pathologic examination of tissue samples showing tuberculous changes (e.g., chronic granulomatous inflammation with caseous necrosis), and imaging (-ray, CT, or MRI) showing characteristic features of BJTB.
According to the reference with some modifications [3], the composite reference standard (CRS) used in this study consisted of clinical diagnosis and culture results. Patients were classified into three categories based on the CRS criterion: Confirmed BJTB: Patients who were clinically diagnosed with BJTB and had a positive culture result; Probable BJTB: Patients with a positive result in either clinical diagnosis or pathogen culture, while the other was negative; Non-BJTB: Patients with negative clinical diagnosis and pathogen culture results. Clinical diagnosis and CRS were used as reference criteria to evaluate the diagnostic value of TNPseq test for BJTB.
Statistical analysis
Clinical and experimental data were initially recorded in an Excel spreadsheet and analyzed for the sensitivity, specificity, positive predictive value (PPV), and negative predictive value (NPV) of TNPseq, Xpert MTB/RIF, T-SPOT, and culture using SPSS 24.0. Descriptive statistics included mean, standard deviation (SD), median, and interquartile range (IQR). Comparisons were performed with the χ2 test, and a p-value less than 0.05 was deemed statistically significant. Data visualization was performed using Origin 2022.


留言 (0)