
記住我
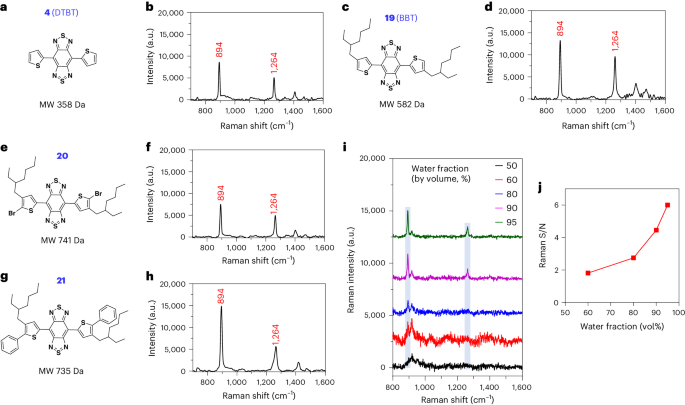


The small molecules are represented by a class of π-conjugated molecules with the structure of bis-thienyl-substituted benzobisthiadiazole, such as 4,7-di(thiophen-2-yl)benzobis[c][1,2,5]thiadiazole (DTBT; 4, molecular weight 358 Da) and its derivative with two alkyl chains, 4,7-bis(4-(2-ethylhexyl)thiophen-2-yl)benzobis[c][1,2,5]thiadiazole (BBT; 19, molecular weight 582 Da) (Fig. 1a–d). Illumination of BBT in solid state with either 785-nm or 830-nm near-infrared (NIR) laser, but not 532-nm laser, led to resonance Raman scattering with featured and intense Raman spectral signatures at 894 and 1264 cm−1 (Supplementary Fig. 1). The assignment of these two characteristic peaks was investigated by comparing BBT or DTBT with their building blocks (Supplementary Figs. 2–12). The two spectral signatures were not observed after deleting the two thiophenes of DTBT (7, Supplementary Fig. 13a). Thiophene alone or phenyl thiophene(s) (11 and 12) failed to show these characteristic Raman peaks (Supplementary Fig. 13b–d). In the structure of DTBT, the replacement of central benzobisthiadiazole with dinitro-substituted benzothiadiazole (14) or the two thiophene units with phenyls (5) resulted in the disappearance of the two spectral signatures (Supplementary Fig. 13e, f). BBT coupled with bromo or phenyl groups on the α-position of the thiophene moieties (20 and 21), however, possessed the two signature peaks (Fig. 1e–h). These data demonstrated that the peaks of 894 and 1,264 cm−1 are attributed to the vibration mode from the entire backbone (that is, DTBT).
Fig. 1: Raman spectra of the DTBT-based small molecules with enhanced Raman scattering effect through aggregation.
a–h, Chemical structure and Raman spectrum of DTBT (a and b), BBT (c and d), compounds 20 (e and f) and 21 (g and h) measured in solid state, respectively. i, Raman spectra of BBT (10 µM) in water/THF mixture. j, Plot of S/N of Raman intensity at 894 cm−1 versus the water fraction of the THF/water mixtures in panel i. When the water fraction was 50%, BBT did not show signal peak at 894 cm−1. Raman measurement was carried out with an 830-nm laser excitation, a ×20 objective, a laser power of 6.1 × 10⁻² mW, acquisition time of 5 s and 3 times accumulation in (b, d, f and h); a ×5 objective, a laser power of 62.6 mW, acquisition time of 1 s and 1 time accumulation in panel i. Blue columns in panel i represent the featured Raman peaks at 894 and 1,264 cm−1. MW, molecular weight.
The poor solubility of DTBT makes it difficult to perform spectroscopy in solution. Alternatively, the lipophilic BBT exhibited enhanced Raman scattering in water through its self-stacking. In the water and tetrahydrofuran (THF) mixture (50%:50%), BBT is soluble without showing the Raman signature peak (Fig. 1i, black curve). When the water fraction was increased to 60%, BBT started to aggregate with the appearance of the Raman peak at 894 cm−1 (Fig. 1i, red curve). The Raman signal-to-noise (S/N) ratio of BBT was continuously elevated when the water fraction was further increased (Fig. 1i,j), correlated with the increased aggregation of the molecules (Extended Data Fig. 1a–e). In comparison, a conventional Raman reporter molecule, the hydrophobic IR792, with the absorption spectrum similar to that of BBT, did not show any Raman signal intensities in water (Extended Data Fig. 1f–p).
Density functional theoretical (DFT) calculation revealed that the optimized geometry of DTBT had a planar conformation with 0° of dihedral angles between the benzobisthiadiazole core and the thiophene blocks (Fig. 2a). The two characteristic Raman peaks at 894 and 1,264 cm−1 were assigned to the stretching and bending of the in-plane vibration mode, derived from the whole multiring structure of DTBT (Fig. 2b and Supplementary Video 1–4). Specifically, the Raman peak at 894 cm−1 was assigned to the ring stretching and bending including the SN stretching and NCC bending, whereas the Raman peak at 1,264 cm−1 represented the ring stretching and CH bending including the C = C stretching and HCC bending (Extended Data Fig. 1q). By contrast, IR792 owned a twisted conformation, with the featured peak (1,202 cm−1) mainly assigned to the C-C stretching (Extended Data Fig. 1r,s and Supplementary Video 5). The comparative results indicated that the planar conformation with the in-plane multiring vibration of DTBT plays a pivotal role in the enhanced Raman scattering. To validate this point, the two thiophenes of DTBT were replaced with 3,4-ethoxylene dioxythiophenes, to obtain a molecule BBE (17) with 43° of dihedral angles between the benzobisthiadiazole and 3,4-ethoxylene dioxythiophenes (Fig. 2c). The enlarged dihedral angles of BBE broke the planar conformation and in-plane multiring vibration, resulting in a complete loss of these characteristic Raman peaks (Fig. 2d).
Fig. 2: In-plane multiring vibration modes of the planar molecule DTBT.
a, The optimized geometry of DTBT with the dihedral angles calculated by DFT (Gaussian 09/B3LYP/6-31 G(d)). B, benzobisthiadiazole unit. T, thiophene unit. b, Illustration of in-plane multiring vibration modes of DTBT. The peak at 894 cm−1 represents ring stretching and bending modes of the multiring skeleton (Supplementary Videos 1 and 2). The peak at 1,264 cm−1 represents ring stretching and C-H bending modes of the multiring skeleton (Supplementary Videos 3 and 4). Red arrows, the vibration amplitude and direction of atoms. c, The optimized geometry of BBE with the dihedral angles calculated by DFT (Gaussian 09/B3LYP/6-31 G(d)). B, benzobisthiadiazole unit; E, 3,4-ethoxylene dioxythiophene unit. d, Raman spectrum of BBE measured in solid state, with an absence of Raman peaks at 894 or 1,264 cm−1. Raman measurement was carried out with an 830-nm laser excitation, a ×20 objective, a laser power of 6.1 × 10⁻² mW, 3 times accumulation and an acquisition time of 0.2 s.
Raman enhancement mechanismTo understand how the DTBT-based planar molecules generate the enhanced Raman intensity through self-stacking, we analyzed the intermolecular stacking information by two-dimensional grazing-incidence wide-angle X-ray scattering (2D-GIWAXS) measurement. DTBT showed a backbone-to-backbone repeat distance in the molecular plane (in-plane) assigned to (001) peak at the q value around 0.8 Å−1, and a π-π stacking between the backbones in the direction of π-orbitals of the conjugated rings (out-of-plane) characterized by the (010) peak at the q value between 1.5 and 1.8 Å−1 in its diffraction pattern (Fig. 3a)12. Besides the existence of (001) and (010) peaks, BBT displayed a lamellar stacking (100) peak due to its alkyl side chains (Fig. 3b)13. Results of the X-ray diffraction (XRD) test further supported the stacking of both molecules (Extended Data Fig. 2a). Considering DTBT also exhibited the featured Raman signals upon its aggregation (Extended Data Fig. 2b–e), we concluded that the in-plane backbone-to-backbone and the out-of-plane π-π stacking rather than the lamellar stacking contribute to the intense Raman scattering of the DTBT-based molecules.
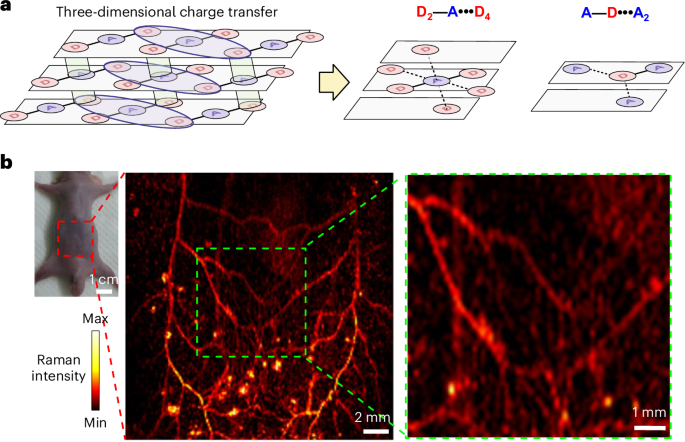
Fig. 3: Stacking-induced intermolecular charge transfer of the DTBT-based planar D-A-D molecules.
a,b, 2D-GIWAXS pattern of the thin films of DTBT (a) and BBT (b), respectively. qz and qr, the out-of-plane and in-plane directions, respectively. c,d, BFDH theoretical crystal morphology of DTBT simulated by Mercury 3.8 based on the single-crystal structure from the Cambridge Crystallographic Data Centre (CCDC; code: 1308377). The arrangement of DTBT in the in-plane direction (c) and out-of-plane direction (d). e–g, ESP maps (e), vibration mode (894 cm−1) (f) and Raman spectra (g) of single DTBT or DTBT-DTBT packed in the in-plane or out-of-plane direction calculated by Gaussian 09/B3LYP/6-31 G(d) based on their crystal geometries from the CCDC. Color bar indicates the ESP energy value between the highest (blue) and the lowest (red) values (e). Boxed area in the ESP maps, intermolecular charge-transfer. h,i, Absorption spectra (h) or fluorescence decay curves (i) of BBT in water/THF mixtures with water fraction from 0% to 95%. No fit, the fluorescence emission was completely quenched. j, Schematic diagram of three-dimensional charge-transfer interactions of DTBT, substantially increasing the extent to electron delocalization to conduce to the enhanced Raman scattering. Green cylinders, intermolecular D•••A change-transfer in the out-of-plane direction. Blue ellipses, intermolecular D•••A change-transfer in the in-plane direction.
The stacking of DTBT was visually presented via the BFDH (Bravais, Friedel, Donnay and Harker) theoretical crystal morphology simulated based on the single-crystal structure from the Cambridge Crystallographic Data Centre (CCDC; code 1308377) (Extended Data Fig. 2f and Supplementary Video 6)14,15. The crystal formed a backbone-to-backbone parameter in the in-plane direction, with a 3.552 Å of gap between the carbon atom of the thiophene in one DTBT molecule and the sulfur atom of the benzobisthiadiazole in the neighboring DTBT molecule (Fig. 3c, green dotted lines). Meanwhile, the molecules were piled up in the out-of-plane direction to constitute a continuous π-π stacking, with a 3.582 Å of distance between the sulfur atom of the thiophene in the upper molecular plane and the nitrogen atom of the benzobisthiadiazole in the lower plane (Fig. 3d, red dotted lines).
According to electromagnetic theory, the intensity of Raman scattering is proportional to the square of the electric dipole moment (ρ), where ρ is expressed as the product of polarizability of the molecule and electric field intensity16,17,18. Small molecules with a donor-acceptor-donor (D-A-D) scaffold constructed by the conjugation of both electron-donating and electron-withdrawing blocks possess a favorable intramolecular charge-transfer property, facilitating the corresponding molecular polarizability19,20,21,22,23. The results of maps of electrostatic potential (ESP) showed substantially increased intramolecular charge-transfer characteristic and polarizability of DTBT or BBT compared with those of benzobisthiadiazole due to the formation of a strong D-A-D system (Supplementary Fig. 14a). The highest occupied molecular orbitals and lowest unoccupied molecular orbitals of the four molecules also demonstrated that the conjugated D-A-D system increased the extent to electron delocalization and lowered the energy gap (Eg), facilitating charge-transfer excitations (Fig. 3e, left, and Supplementary Fig. 14b).
More importantly, the maps of ESPs delineated strong intermolecular charge-transfer interactions between the thiophene unit of one DTBT molecule and the benzobisthiadiazole unit of the neighboring molecule stacked in the in-plane direction (Fig. 3e, middle, boxed area). In the out-of-plane direction, the thiophene unit in the upper molecular plane was piled up on the top of the benzobisthiadiazole unit in the lower plane, thus promoting the intermolecular charge-transfer interactions as well (Fig. 3e, right, boxed area). Consequently, dual DTBT molecules stacked in either the in-plane or out-of-plane direction doubled the molecular polarizability (Fig. 3e). The enhanced intermolecular charge-transfer interactions were attributed to the in-plane intermolecular gaps of 3.552 Å and the out-of-plane intermolecular gaps of 3.582 Å shown in the crystal of DTBT, respectively (Fig. 3c,d). An intermolecular D-A distance at such a close range fostered relatively strong intermolecular charge-transfer interactions24. Moreover, DFT calculation demonstrated that the vibrational amplitude as well as direction of atoms in the two DTBT molecules stacked in either direction were synchronized, amplifying the Raman intensity at 894 cm−1 by ~20-fold (Fig. 3f,g, blue and red peaks versus green peak, Extended Data Fig. 2g,h and Supplementary Videos 7–10).
In addition, we prepared the single crystal of BBT and characterized its molecular packing by the single-crystal XRD experiment (Supplementary Fig. 15a–c and Supplementary Table 1). The crystal structure clearly demonstrated a close intermolecular distance of 3.427 Å between the sulfur atom of the thiophene in one BBT molecule and the nitrogen atom of the benzobisthiadiazole in the neighboring BBT molecule through backbone-to-backbone stacking along the c axis (Supplementary Fig. 15d,e). The BBT molecules were piled up in the out-of-plane direction to constitute a continuous π-π stacking, with a close distance of 3.618 Å between the sulfur atom of the thiophene in one molecular plane and the nitrogen atom of the benzobisthiadiazole in the other molecular plane (Supplementary Fig. 15f).
The absorption spectra of BBT in THF with different ratios of water were further analyzed. When the water fraction was increased to 60% or 95% in the THF:water mixture (the aggregated state), the absorption spectra of BBT exhibited a red-shifted and broader peak, indicating the existence of exciton coupling, substantiating the intermolecular charge-transfer interactions (Fig. 3h)25. Moreover, an increase in the aggregation of BBT reduced its fluorescent lifetime, suggesting the presence of the intermolecular charge transfer (Fig. 3i)26.
Taken together, the SICTERS effect requires the small molecule (for example, DTBT or BBT) possessing a D-A-D-based planar conformation and an in-plane multiring vibration mode. The molecular stacking of DTBT or BBT facilitates the intermolecular charge-transfer in both in-plane or c axis and out-of-plane directions. As a result, one acceptor could totally receive electrons from six donors (D2—A•••D4), including two intramolecular and four intermolecular donors. Meanwhile, one donor could donate electrons to three acceptors (A—D•••A2), including one intramolecular and two intermolecular acceptors (Fig. 3j and Supplementary Fig. 15g,h). These spatial arrangements readjust the charge distributions to form a three-dimensional charge transfer, substantially increasing the polarizability and the resonance Raman scattering.
Preparation of SICTERS nanoprobes for in vivo applicationsFor in vivo bioimaging study, the SICTERS nanoprobes were prepared by encapsulating BBT with the amphiphilic 1,2-distearoyl-sn-glycero-3-phosphoethanolamine-N-[methoxy-(polyethylene glycol)-2000] (DSPE-PEG) to form core-shell BBT nanoparticles (NPs) (Fig. 4a). The Raman scattering cross-section of BBT per molecule in BBT NPs was close to that in the BBT aggregates in the water/THF (95: 5, v/v) mixture (Extended Data Fig. 3a,b). BBT NPs of different sizes in diameter (~42 nm versus ~70 nm) had roughly equivalent Raman scattering cross-sections per molecule (Extended Data Fig. 3c–e). These results indicated that the nanoassembly with DSPE-PEG and the particle size did not alter the intermolecular distance of BBT stacking.
Fig. 4: Raman scattering cross-section of the SICTERS-based small-molecule nanoprobes compared to the SERS-based Au nanoprobes.
a–c, Schematic structures and representative transmission electron micrographs (TEM) of the SICTERS-based BBT NPs (a), the SERS-based Au NPs (NBT@Au NPs) (b) and the SERS-based Au GERTs (NBT@Au GERTs) (c) of 69.1 nm, 68.3 nm and 70.6 nm in average diameters, respectively. Scale bars, 100 nm. The reporter molecule 4-NBT was incorporated into Au NPs or Au GERTs. Image shown is representative of n = 3 independent replicates of experiments with similar results (a–c). d, The Raman scattering cross-section for 4-NBT or BBT in different nanoprobes. The cross-section values per molecule were calculated by measuring the Raman peak at 1,340 cm−1 excited at 532 nm for 4-NBT or 4-NBT NPs; the Raman peak at 1,340 cm−1 excited at 785 nm for NBT@Au NPs or NBT@Au GERTs; and the Raman peak at 894 cm−1 excited at 830 nm for BBT NPs, while using the methanol C-O stretch at 1,020 cm−1 as the internal reference. n = 3–5 independent samples (d). Data are presented as the mean ± standard deviation (s.d.) (d).
The encapsulation with DSPE-PEG improved the stability of the NPs in serum. The BBT molecule can bind to one pocket of human serum albumin (HSA), leading to the twisted dihedral angles of 69° and 20° between the benzobisthiadiazole core and two thienyl groups (Extended Data Fig. 3f–h). In comparison to the BBT aggregates, the mixture of BBT and HSA substantially reduced the Raman S/N ratio at 894 cm−1 from 13.89 to 4.21, indicating that the binding interfered with the effect of SICTERS (Extended Data Fig. 3i,j). Comparatively, the Raman S/N ratio of BBT NPs mixed with HSA remained to be 10.15 (Extended Data Fig. 3j). These results demonstrated that the NP formulation with DSPE-PEG can prevent the encapsulated BBT molecule from binding to HSA, thus maintaining the Raman signal of BBT. BBT NPs were stable in 10% fetal bovine serum without significant change in size distribution or Raman signal intensity for 48 h at room temperature and for 24 h at 37 °C, respectively (Supplementary Fig. 16a–d). BBT NPs remained stable in the lysosomal lysate for 30 h (Supplementary Fig. 16e,f).
We next quantitatively compared the Raman enhancement of SICTERS with that of SERS by measuring their Raman scattering cross-section values. Two types of widely used SERS nanoprobes with a particle size similar to BBT NPs were formulated. One was the traditional type—Au NPs, with the conventional Raman reporter molecules (4-nitrobenzenethiol, 4-NBT) coated on the Au surface (NBT@Au NPs; Fig. 4b)7,27. The other was an advanced type considered to be among the most sensitive SERS nanoprobes for in vivo applications—Au gap-enhanced Raman tags (Au GERTs), with 4-NBT embedded in the electromagnetic hot spots from the interior nanogaps of the Au core-shell junction (NBT@Au GERTs; Fig. 4c)9,28,29. In both types, the Raman spectral signature of 4-NBT at 1,340 cm−1 was used for characterization29. The Raman scattering cross-section for 4-NBT in solution was measured ~10−28 cm2 per molecule (Fig. 4d and Supplementary Table 2). Through the SERS effect, Au NPs and Au GERTs enhanced the cross-sections of 4-NBT to ~10−23 and ~10−21 cm2 per molecule, respectively. 4-NBT NPs prepared with DSPE-PEG through self-assembly did not exhibit any Raman scattering enhancement. By contrast, the Raman scattering cross-section of BBT in substrate-free BBT NPs reached ~10−21 cm2 per molecule, which was two orders of magnitude larger than NBT@Au NPs and the same order of magnitude as NBT@Au GERTs, respectively (Fig. 4d). Different from the SERS nanoprobes like Au NPs or Au GERTs with the Au core as a substrate, the core of the SICTERS-based BBT NPs was only composed of BBT (the reporter molecules) free of substrate. Given the similar particle sizes of ~70 nm, the loading of reporter molecules in BBT NPs was 26-fold higher than that of NBT@Au NPs and 305-fold higher than that of NBT@Au GERTs, respectively. As a result, the Raman scattering cross-section per particle was enhanced by 1,350-fold for BBT NPs compared to NBT@Au NPs, and by 183-fold compared to NBT@Au GERTs.
Moreover, we quantitatively compared the Raman scattering cross-section of SERS-enhanced BBT with that of SICTERS-enhanced BBT. For this purpose, we coated BBT on the surface of 40 nm-sized Au NPs to obtain SERS-based BBT@Au NPs, which are comparable in size to SICTERS-based BBT NPs (~42 nm in diameter). To ensure that the Raman enhancement effect was solely attributed to the SERS by Au NPs, the number of BBT Raman reporters coated on the Au NPs should not be more than the number forming a monolayer (nMonolayer). According to the geometry of BBT molecule optimized by Gaussian 09/B3LYP/6-31 G(d), the nMonolayer was calculated to be 1.32 × 10⁴ for an NP of 40 nm in diameter (Extended Data Fig. 4a and Methods). BBT molecules (10 μM) were then absorbed on a series of concentrations of the Au NPs from 0.25 mM to 5.08 mM (Extended Data Fig. 4b,c). The theoretically calculated nMonolayer was close to the actually measured numbers of 2.15 × 10⁴ per particle when 2.54 mM Au NPs were added, and 1.08 × 10⁴ per particle when 5.08 mM Au NPs were added. This finding was in line with the result that these two concentrations of Au NPs generated almost same Raman scattering cross-sections per BBT molecule, that is, 1.81 × 10⁻²¹ and 1.83 × 10⁻²¹ cm2 (Extended Data Fig. 4d). Because higher BBT loading in the 2.54 mM of Au NPs than that in the 5.08 mM of Au NPs, BBT in the 2.54 mM of Au NPs was used as the SERS-based BBT@Au NPs for the comparative study. The Raman scattering cross-section per BBT molecule measured in the SICTERS-based BBT NPs (diameter of ~42 nm) was 1.73 × 10⁻²¹ cm2 (Extended Data Fig. 3e), whereas the Raman scattering cross-section per BBT molecule measured in the SERS-based BBT@Au NPs (diameter of ~40 nm) was 1.81 × 10⁻²¹ cm2 (Extended Data Fig. 4d), suggesting that the Raman enhancement effect of SICTERS on each BBT molecule is similar to that of Au NP-based SERS. However, the BBT loading number in SICTERS-based BBT NPs (2.32 × 10⁵ per particle) was higher than that in SERS-based BBT@Au NPs (2.15 × 10⁴ per particle). As a result, the Raman scattering cross-section per particle in SICTERS-based BBT NPs (4.01 × 10⁻¹⁶ cm2 per particle) was 10.3-fold higher than that per particle in SERS-based BBT@Au NPs (3.88 ×10⁻¹⁷ cm2 per particle) (Extended Data Figs. 3e and 4d).
To explore whether the Raman enhancement of BBT was attributed to the J-aggregation-enhanced Raman scattering, we further compared the Raman scattering cross-section of BBT NPs with that of typical J-aggregates of astaxanthin (AXT) (Supplementary Fig. 17a)30. Compared with the AXT standalone molecules, the Raman scattering cross-section per AXT molecule in the J-aggregates was only increased by 2.29-fold, to a value of 1.008 × 10⁻²⁴ cm2 per molecule (Supplementary Fig. 17b)30. By contrast, the Raman scattering cross-section for BBT molecule within BBT NPs was 1.61 × 10⁻²¹ cm2 per molecule (Fig. 4d), which was 1,597 times larger than that for the AXT molecule in the J-aggregates. The comparative data demonstrated that SICTERS but not the J-aggregate-induced Raman enhancement was the predominant contributor to the Raman signal enhancement in the BBT NPs.
We next investigated the pharmacokinetic parameters of BBT NPs in mice after intravenous (i.v.) injection. The plasma concentration versus time curve fit the two-compartment model (Extended Data Fig. 5a). BBT NPs underwent a rapid distribution in the distribution phase (t1/2α = 0.83 h), followed by a prolonged clearance in the elimination phase (t1/2β = 11.65 h) (Extended Data Fig. 5b). The biodistribution results showed that BBT NPs were metabolizable as the concentrations of BBT in major organs decreased over time within 60 d after injection (Extended Data Fig. 5c,d). By contrast, the concentrations of the Au substrates of NBT@Au GERTs in most organs except kidney remained unchanged between day 1 and day 60 after injection (Extended Data Fig. 5c,d).
BBT NPs did not show cytotoxicity to NIH 3T3 fibroblast cells at a concentration up to 400 μg ml−1 (Supplementary Fig. 18a). Hematologic analysis showed the majority of the hematologic parameters were in the reference ranges within 60 d after injection of BBT NPs (Supplementary Table 3). Only one value of hematocrit at day 7 and two numbers of mean corpuscular volume at days 1 and 30 slightly exceeded the reference ranges but were back to the normal ranges at day 60 (Supplementary Table 3). Blood chemistry analysis of liver function (alanine aminotransferase and aspartate aminotransferase levels) and kidney function (blood urea nitrogen levels) showed that all values were all maintained in the normal ranges (Supplementary Fig. 18b). In addition, histologic analysis did not show any pathologic changes in the major organs of mice treated with BBT NPs (Supplementary Fig. 18c). These data collectively demonstrated that BBT NPs at the imaging dose are biosafe within 60 d after injection.
Intraoperative real-time imaging of microtumorsIntraoperative real-time detection of microtumors is considered to be one of the most promising applications of the SERS-based Raman imaging. Many researchers including our group have designed a variety of SERS nanoprobes towards this goal27,31,32,33. Using our previously reported intraoperative confocal Raman imaging platform31, we performed a comparative study of SICTERS- with SERS-active nanoprobes in mice bearing orthotopic CT26-Luc colon tumor. In the mimic surgical scenario, intraoperative SICTERS imaging based on BBT NPs produced intense Raman signals in the blood vessels at 15 min or 4 h after i.v. injection, whereas a clear tumor image was obtained at 24 h (Supplementary Fig. 19), most likely because the plasma concentration of BBT at 24 h after injection decreased to 15.6% of that at 15 min and tumor accumulation of BBT NPs was sufficient (Extended Data Fig. 5a and Supplementary Fig. 20). The imaging distinguished the primary tumor (5.8 mm × 6.3 mm, blue arrow) and satellite metastatic lesion (0.49 mm × 0.54 mm, green arrows) from the normal tissues in a real-time manner, with the strong characteristic signal intensity at 894 cm−1 (Fig. 5a). Hematoxylin and eosin (H&E) staining confirmed these Raman signal-positive areas to be tumor lesions (Fig. 5b,c). The minimum dimension of metastatic microtumor detected by SICTERS imaging was as small as ~0.25 mm × 0.35 mm (Supplementary Fig. 21a,b). This size is comparable to the reported sizes of abdominal tumor metastases detected by SERS31,33. By contrast, the control group injected with phosphate-buffered saline (PBS) did not yield any signature Raman peak (Supplementary Fig. 21c,d). To investigate the tumor tissue penetration of BBT NPs, we isolated the microtumor of ~2.5 mm in length from the mice at 24 h post-injection of BBT NPs, and examined them by cryosectioning at different tumor depths (Supplementary Fig. 22a). BBT NPs can penetrate into the core of the microtumor and distribute throughout the tumor cross-section at the penetration depth of 1,258 μm (Supplementary Fig. 22b). Such depth of tumor tissue penetration of the BBT NPs was sufficient for the intraoperative detection of the microtumors in the orthotopic CT26 colon cancer mouse model. For the SICTERS imaging, the Raman signal intensity of BBT in tumor was in a dose-dependent manner, with a minimum injection dose as low as 1 mg kg−1 BBT validated by six repeated experiments (Fig. 5d,e and Supplementary Fig. 23). Comparatively, the minimum dose of NBT@Au GERTs was 4 mg kg−1 Au for the intraoperative detection of the tumor (Supplementary Fig. 24a–c). A lower dose of NBT@Au GERTs (1 mg kg−1 of Au) was unable to provide any Raman signals in the tumor (Supplementary Fig. 24d–f). Notably, the band at 950 cm−1 was the background noise; it appeared when the Raman signal of BBT NPs was relatively low in the metastatic tumor (Fig. 5a, spectra 2) or in the primary tumor with low accumulation of BBT NPs (Fig. 5e, spectra 3 and 5). Accordingly, the SICTERS-based BBT NPs produce an equivalent sensitivity for the intraoperative tumor detection at a lower administration dose in comparison with the SERS-based NBT@Au GERTs.
Fig. 5: Intraoperative Raman imaging of orthotopic mouse colon tumor by SICTERS.
a, Live Raman imaging (894 cm−1) of primary and metastatic CT26-Luc tumor lesions of mice following the i.v. injection of BBT NPs (40 mg kg−1 of BBT). When establishing the orthotopic colon tumor model, CT26-Luc cells were injected into the cecum wall of mice. The tumor formed at the injection site is referred to as primary tumor (blue arrow), while the tumor arising outside the injection site is referred to as metastatic tumor lesion (green arrow). Lower left, Raman spectra of site 1 (primary tumor) and site 2 (metastatic tumor), respectively. b,c, Histological analysis of primary (b) and metastatic (c) tumor sections following the live imaging in panel a. Green circles, tumor. Left, H&E staining. Right, Raman imaging (894 cm−1). Image shown is representative of n = 3 independent replicates of experiments with similar results (b and c). d, Intraoperative Raman imaging (894 cm−1) of the tumor-bearing mice following i.v. injection of BBT NPs at different doses (calculated by BBT). e, Raman spectra of different sites in panel d. Blue columns in the above spectra, peaks at 894 cm−1. Raman measurement was carried out with a 5 × objective, 830-nm laser excitation, laser powers of 31.3 mW (a and d) or 62.6 mW (b and c), acquisition time of 0.3 s and one time accumulation.
We then performed SICTERS-based Raman image-guided su
留言 (0)