
記住我
Attention-deficit/hyperactivity disorder (ADHD) represents a prevalent and chronic neurodevelopmental condition characterized by symptoms of hyperactivity, impulsivity, and age-inappropriate inattention. These manifestations significantly impact various domains of life, including social interactions, academic performance, and occupational functioning (Sibley et al., 2016). The global prevalence of ADHD is estimated to be approximately 7.6% in children and 5.6% in adolescents (Salari et al., 2023). Moreover, the persistence of this disorder symptoms into adulthood is observed in approximately 75% of individuals (Sibley et al., 2012). It is noteworthy that ADHD diagnoses exhibit a notable gender disparity, with males being diagnosed three times more frequently than females (Gaub and Carlson, 1997; Ramtekkar et al., 2010). Despite the abundant research findings, ADHD often goes undiagnosed and untreated, frequently coexisting with other mental health disorders such as major depression, personality disorders, and addictions, thereby posing severe health and social problems (Elia et al., 2008; Naya et al., 2021). In the course of ADHD, disrupted dopaminergic, noradrenergic, glutamatergic, and serotonergic neurotransmission have been observed (Pliszka, 2005). These deficiencies are associated with structural anomalies in cortical and subcortical brain areas, observed both in individuals with ADHD and in spontaneously hypertensive rats (SHRs), the most well-validated model of this disorder (Sagvolden et al., 2009). Current studies indicate delayed brain maturation in ADHD patients and total brain volume reduction in white matter particularly in the areas of prefrontal cortex (PFC), corpus callosum, cingulate gyrus and internal capsule. Moreover, gray matter reduction was also observed in PFC, striatum, cerebellum, anterior cingulate cortex, hippocampus, and amygdala. It is worth mentioning that the most remarkable differences have been observed in the right brain hemisphere (Almeida et al., 2010; Li et al., 2019; Ha et al., 2020). Due to the variety of neuroanatomical alterations observed in several brain areas, ADHD is a complex condition. This complexity is evident in the wide range of symptoms of inattention, hyperactivity and impulsivity and also social and mood-related behaviors. One of the most prominent symptoms of ADHD is excessive motor activity. Therefore, this manuscript will focus on alternations in the motor cortex areas (M1 and M2) that may lead to the deficits in motor control and coordination associated with ADHD.
The motor cortex (MC) plays a key role in the regulation of motor inhibition and impulsive actions. Current literature suggests neuroanatomical and functional alterations in the MC areas in children with ADHD, which contribute to the hyperactivity and motor control difficulties often observed in people with this disorder (Gilbert et al., 2019). For example, several studies have shown reduced activation of the MC during motor tasks in children with ADHD compared to typically developing individuals, which may reflect inefficiencies in motor planning and execution processes (Mostofsky et al., 2006; Paloyelis et al., 2007). Moreover, magnetic resonance imaging studies (MRI) have reported alterations in the thickness of the MC in individuals with ADHD, although findings have been inconsistent across studies (Sutcubasi Kaya et al., 2018; Hoogman et al., 2019). It is worth adding that research suggests that individuals with ADHD may exhibit reduced cortical excitability within the MC, which may affect motor performance and control (Dutra et al., 2016).
In rodents, the MC is divided into two closely cooperating regions: the primary motor cortex (M1) and secondary motor cortex (M2), differing in cytoarchitectonic structure and functions (Soma et al., 2017). M1, located in the precentral gyrus of the brain’s frontal lobe, is renowned as the central hub for motor decisions and movements, with its axons following pyramidal pathways to spinal cord movement centers, connecting with neurons innervating muscles (Lee et al., 2022). M2, adjacent to M1, strongly associates with the cerebellum and basal ganglia (Bostan et al., 2013). Similar to M1, M2 features a somatotopic organization of neurons (Barthas and Kwan, 2017) and plays a primary role in planning voluntary movements, collaborating with other brain regions for motor activity coordination (Liu et al., 2023). Importantly, the neurons in both M1 and M2 exhibit a structured organization across six parallel layers. Each layer is characterized by different number and types of nerve cells and the connections that are received and sent to other brain structures (Imai et al., 2012), one of these structures is PFC. At first, it should be emphasized that the PFC is a functionally and histologically distinct structure. Nevertheless, the relationship between the PFC and the MC in motor control and ADHD symptoms is complex and multifaceted. PFC is involved in executive functions such as decision-making, impulse control, attention regulation and working memory. It plays a key role in the regulation of behavior and cognitive processes. It sends signals to the MC to initiate, inhibit or modify voluntary movements based on cognitive processes such as attention, planning and decision-making (Grafton and Volz, 2019). More precisely, neural tract tracing studies in the rats showed multiple projections from M1 and M2 to the PFC and from the PFC to M2 (Muñoz-Castañeda et al., 2021; Bedwell et al., 2023). Similar projections were also found in a human brain using functional magnetic resonance imaging (fMRI) study (Schellekens et al., 2022). Moreover, the PFC damage in rodents and primates caused a range of motor impairments, including hyperactivity and increased aimless locomotion, further confirming the dependencies between these cortices (Fuster, 2002; Szczepanski and Knight, 2014). Additionally, it has been shown that PFC injury is associated with a range of symptoms seen in ADHD including difficulties in concentrating, impulsivity, and hyperactivity. Both conditions can result in problems with executive functioning, such as planning, organizing tasks, and regulating emotions (Szczepanski and Knight, 2014; Fremont et al., 2022).
Recent literature emphasizes a strong association between immune system activation and ADHD pathophysiology (Corona, 2020; Wong, 2022). It is generally known that cytokines are a broad group of immune system proteins involved in inflammatory reactions that affect brain function, structure, and development (Miller et al., 2013). For example, our previous studies on SHRs, a validated ADHD animal model, have revealed ongoing inflammatory processes affecting brain morphology and neurotransmitter levels (Kozłowska et al., 2019a,b). Correspondingly, increased serum levels of interleukin-6 (IL-6) and interleukin-10 (IL-10) have been reported in children with ADHD (Donfrancesco et al., 2020). Furthermore, prolonged inflammation and immune system disturbances can lead to heightened oxidative stress observed in ADHD patients (Leffa et al., 2017; Corona, 2020) and SHRs (Kozłowska et al., 2019b). Oxidative stress involves an imbalance between radical production and the antioxidative system. This state lead to neuronal damage by disrupting membrane integrity causing DNA and lipids damage, and protein oxidation (Guo et al., 2013). Oxidative stress and neuroinflammation can intricately impact brain metabolism (Zia et al., 2021). Neurometabolic studies on adults with ADHD show approximately 8.3% reduction in brain glucose metabolism (Zametkin et al., 1990) and alterations in biochemical markers like ferritin, 3-indole propionic acid, kynurenic acid, and lactate dehydrogenase (LDH) (Juneja et al., 2010; Puurunen et al., 2016; Zhou et al., 2017). Despite numerous studies on ADHD’s association with changes in brain architecture, neurotransmission, immune, oxidative stress, and metabolic markers, some data remain inconsistent, overlooking developmental changes and requiring further investigation. Certainly, to better understand the pathophysiology of ADHD, detailed findings that consider developmental differences are needed. Such an approach would enable significant advances in finding the pathophysiology of ADHD. Human studies are very difficult (sometimes impossible) and time consuming to obtain the above-discussed data. Therefore, using an animal model, particularly male SHRs, offers a valuable avenue for exploring ADHD pathophysiology. It is worth mentioning that the characterization of this animal model is based on numerous findings that have confirmed that SHR rats manifest key symptoms of ADHD, such as attention deficit, hyperactivity, impulsivity, and deficits in learning and memory, at specific age stages (Johansen et al., 2005, 2007; Kim et al., 2024). It has been shown that this strain is similar to children with ADHD because they are more sensitive to delayed reinforcement, which is in line with the steeper gradient of delayed reinforcement observed in SHRs in comparison to controls (Johansen et al., 2005, 2007). Furthermore, SHRs showed alterations in several brain systems, including the dopaminergic and noradrenergic systems. Previous findings have demonstrated reduced dopamine (DA) release in SHRs in key brain areas involved in the pathophysiology of ADHD: the PFC, caudate-striatal nucleus, and paraventricular nucleus (Leffa et al., 2018, 2019). Additionally, norepinephrine production in the PFC was higher in SHRs compared to controls (Leffa et al., 2019). This evidence suggests that SHR rats are the most established and best-validated model of ADHD.
Building upon these findings, our hypothesis suggests that individuals affected by ADHD demonstrate abnormalities in the areas of the brain associated with motor control and coordination: (a) a different trajectory of volumetric alterations in M1 and M2 during postnatal development compared to control animals; (b) differences in comparison to the typical developmental pattern of neuronal distribution in different layers in both M1 and M2 as well as; (c) disruptions in immune homeostasis, oxidative stress equilibrium, and distinct metabolic profiles within the PFC when compared to controls.
To examine these hypotheses, we conducted a comprehensive morphometric analysis, encompassing measurements of both volume and neuron density (across distinct layers) of the M1 and M2 implicated in motor control and coordination. This analysis spanned all developmental stages of SHRs and Wistar Kyoto Rats (WKYs) from 4 to 10 weeks. Additionally, we scrutinized the content/activity of specific immunological, oxidative stress, and metabolic markers in the PFC of juvenile (5-week-old) and maturing (10-week-old) SHRs. All experimental procedures were carried out using male SHRs, considered the widely accepted and best-validated animal model for ADHD, with WKYs serving as a control strain during postnatal development (Sagvolden and Johansen, 2012). The inclusion of male SHRs aligns with the significant male bias in the prevalence of ADHD (Gaub and Carlson, 1997). Additionally, the study incorporates an analysis of the hierarchical clustering and functional importance of mutual interactions of the studied protein markers using the STRING database (Szklarczyk et al., 2015).
2 Materials and methods 2.1 Experimental procedures 2.1.1 AnimalsThe selection of animal strains was carefully considered to guarantee the utmost reliability in the outcomes. Furthermore, it is crucial to emphasize that the same rat strains underwent extensive examination in our previous investigations (Hsu et al., 2010; Tsai et al., 2017; Kozłowska et al., 2019a,b,c). Importantly, no statistically significant differences in the average body weight were observed between the experimental group - inbred Spontaneously Hypertensive Rats (SHR/NCrl) and the control group - inbred Wistar Kyoto Rats (WKY/NCrl) at equivalent developmental stages (Supplementary material 1). Significantly, an equal number of sections per animal were consistently examined, contingent upon the specific cortex region and developmental stage under investigation. The reference points for initiating and concluding the assessment of each brain remained consistent throughout the study.
2.1.1.1 Animals with transcardial perfusionTo assess changes in brain morphometry during ADHD development, this experiment involved two cohorts of male rats: thirty-eight WKY/NCrl as a control group and thirty-eight SHR/NCrl as an animal model for ADHD. Analyses were conducted on animals (WKY/NCrl and SHR/NCrl) aged 4, 5, 6, 7, 8, 9, and 10 weeks seven distinct age stages; n = 5–6 (for each strain at each age). Three-week-old rats of both strains were purchased from Charles River Laboratory Germany GmbH (Sulzfeld, Germany) and transported to the animal house at the Institute of Animal Reproduction and Food Research of the Polish Academy of Sciences in Olsztyn (Olsztyn, Poland). Both SHR/NCrl and WKY/NCrl were acclimatized and housed in sanitized polypropylene cages in groups of three to mitigate isolation stress. The animal room maintained a consistent temperature (21 ± 1°C), ventilation (12–20 exchanges/h), and a light/dark cycle (12/12 h). All animals received the same VRF1 diet (Charles River Laboratories, Germany) and had unrestricted access to tap water. Ethical approval for all animal procedures was granted by the Local Ethics Committee for Animal Experimentation at the University of Warmia and Mazury in Olsztyn, Poland (permission number: no. 43/2014). Stringent adherence to the European Union Directive for animal experiments (2010/63/EU) ensured proper animal care and handling, emphasizing efforts to minimize suffering and the use of the minimum number of animals necessary for accurate scientific data.
2.1.1.2 Animals without transcardial perfusionTwenty-four rats, at the age of 3 weeks, were acquired from Charles River Laboratory Germany GmbH (Sulzfeld, Germany) and then relocated to the animal facility at the Institute of Animal Reproduction and Food Research of the Polish Academy of Sciences in Olsztyn (Olsztyn, Poland) to investigate differences in immune, oxidative stress and metabolic markers in the PFC between juvenile and maturing male WKY/NCrl (n = 12) and SHR/NCrl (n = 12). The standardized conditions for housing, nutrition, and hydration, as previously outlined, were consistently maintained for all animals. Analyses were conducted on 5-week-old (juvenile animals) and 10-week-old (maturing animals) rats in each group (WKY/NCrl and SHR/NCrl; 6 animals per group). The animal care and handling strictly adhered to the European Union Directive on animal experimentation (2010/63/EU) and the 3Rs principles- replacement, reduction, and refinement. All the animals used were registered, and personnel received appropriate training (certificate no. 1387/2015). The study’s reporting followed ARRIVE guidelines. All efforts were made to minimize animal suffering and distress.
2.1.2 Preparation of brains for neuron-specific nuclear protein (NeuN) – stainingFollowing a one-week habituation phase, all SHR/NCrl and WKY/NCrl underwent the same experimental procedures. The rats were deeply anesthetized with an intraperitoneal injection of pentobarbital (Morbital, Biowet, Poland; 50 mg/kg body weight) according to the outlines of the Humane Society Veterinary Medical Association. After cessation of breathing, they were directly perfused transcardially with 0.9% saline, followed afterward, 4% paraformaldehyde (PFA; pH 7.4; 1,040,051,000, Merck, Germany) in phosphate-buffered saline (PBS; P5493, Sigma-Aldrich, Darmstadt, Germany) to preserve the natural state of the tissue. Subsequently, the brains were dissected from the skulls and post-fixed in 4% PFA for 24 h, washed three times in 0.1 M PBS (pH = 7.4, 4°C), and then cryoprotected for 4 days in graded solutions (10%, 20%, 30%) of sucrose (363–117,720,907, ALCHEM, Poland) at 4°C. Finally, coronal sections 10 μm thick were cut with a cryostat (HM525 Zeiss, Germany). The brain sections were mounted on object slides and stored at −80°C until further tissue processing.
2.1.3 Preparation of brains for measuring the content of inflammatory, oxidative stress, and metabolic markersAfter the habituation phase (7 days), the animals (n = 24) were divided into the following groups: 1) control 5-week-old WKY/NCrl (juvenile animals); 2) control 10-week-old WKY/NCrl (maturing animals); 3) ADHD 5-week-old SHR/NCrl (juvenile animals); 4) ADHD 10-week-old SHR/NCrl (maturing animals). All animals were anesthetized with 100 mg/kg body weight (BW) ketamine and 10 mg/kg BW xylazine according to the recommendations for the euthanasia of experimental animals. The PFC was dissected from all brains (by cutting out the frontal portion) which was then frozen in liquid nitrogen (−196°C) and subsequently stored in a container in the freezer (−80°C) until further processing.
2.2 ImmunohistochemistryThe primary antibody used in the experiment was carefully chosen. The antibody against a neuron-specific nuclear protein (NeuN) is an excellent marker for neurons in the central and peripheral nervous systems in the embryo, juvenile, and adult individuals (Mullen et al., 1992). Every 25th frozen section was designated for routine immunoperoxidase labeling using DAB (Dako Liquid DAB + Substrate Chromogen System, K3468, Denmark) as a chromogen, which was described in detail in the previous paper (Kozłowska et al., 2019c). Selected sections were incubated overnight with a solution of primary antibodies directed toward NeuN (pan-neuronal marker; Anti-NeuN Antibody, clone A60, MAB377; Merck Millipore, Poland; working dilution 1:1000) and next incubated for about 1 h with the solution of secondary antibodies (working dilution 1:1000, ImmPRESS™ Universal Reagent). After that, sections were washed in PBS and incubated for 1 min with DAB substrate–chromogen solution prepared according to the manufacturer’s instructions. All stained tissues were rinsed in tap water, rehydrated through a graded alcohol solution, cleaned in xylene, and mounted in DPX (DPX Mountain for histology; 44,581, Sigma Aldrich, Germany). All stages of staining procedures were carried out at room temperature in humid chambers. The prepared sections were digitalized and archived using a PathScan Enabler IV Histology Slide Scanner (Meyer, USA).
2.3 Morphometric analysis of motor cortex 2.3.1 Volumetric analysesThe boundaries of the distinct MC areas, including the M1 and M2, were precisely defined based on coordinates aligning with bregma 5.16 mm to −3.24 mm, referencing The Rat Brain Atlas by Paxinos and Watson (2005), sulcal landmarks in reference to previously published studies (Jeong et al., 2016; Barthas and Kwan, 2017) (Figures 1A). Briefly, volumetric measurements were performed on digitally archived coronal brain section images (5.0 x magnification, PathScan, Meyer, United States) using Fiji (Madison, United States) image analysis software (Schindelin et al., 2012). Sixty-eight (Koh et al., 2012) to eighty (Quinn, 2005) histology scan sections at the level of the M1/M2 were analyzed per animal. The mouse-driven cursor was used to outline the boundaries of M1 and M2 (right and left hemispheres) on each prepared digital slice. The total volumes of the individual M1 and M2 regions were calculated using the formula of DeVito et al. (1989):
Vo - total volume of the structure
Vn - sub volumes through the structure
Vn - was calculated by multiplying 2-D contour area (depicting the boundary of the individual motor cortex region on the section) with the 250 μm space between sections
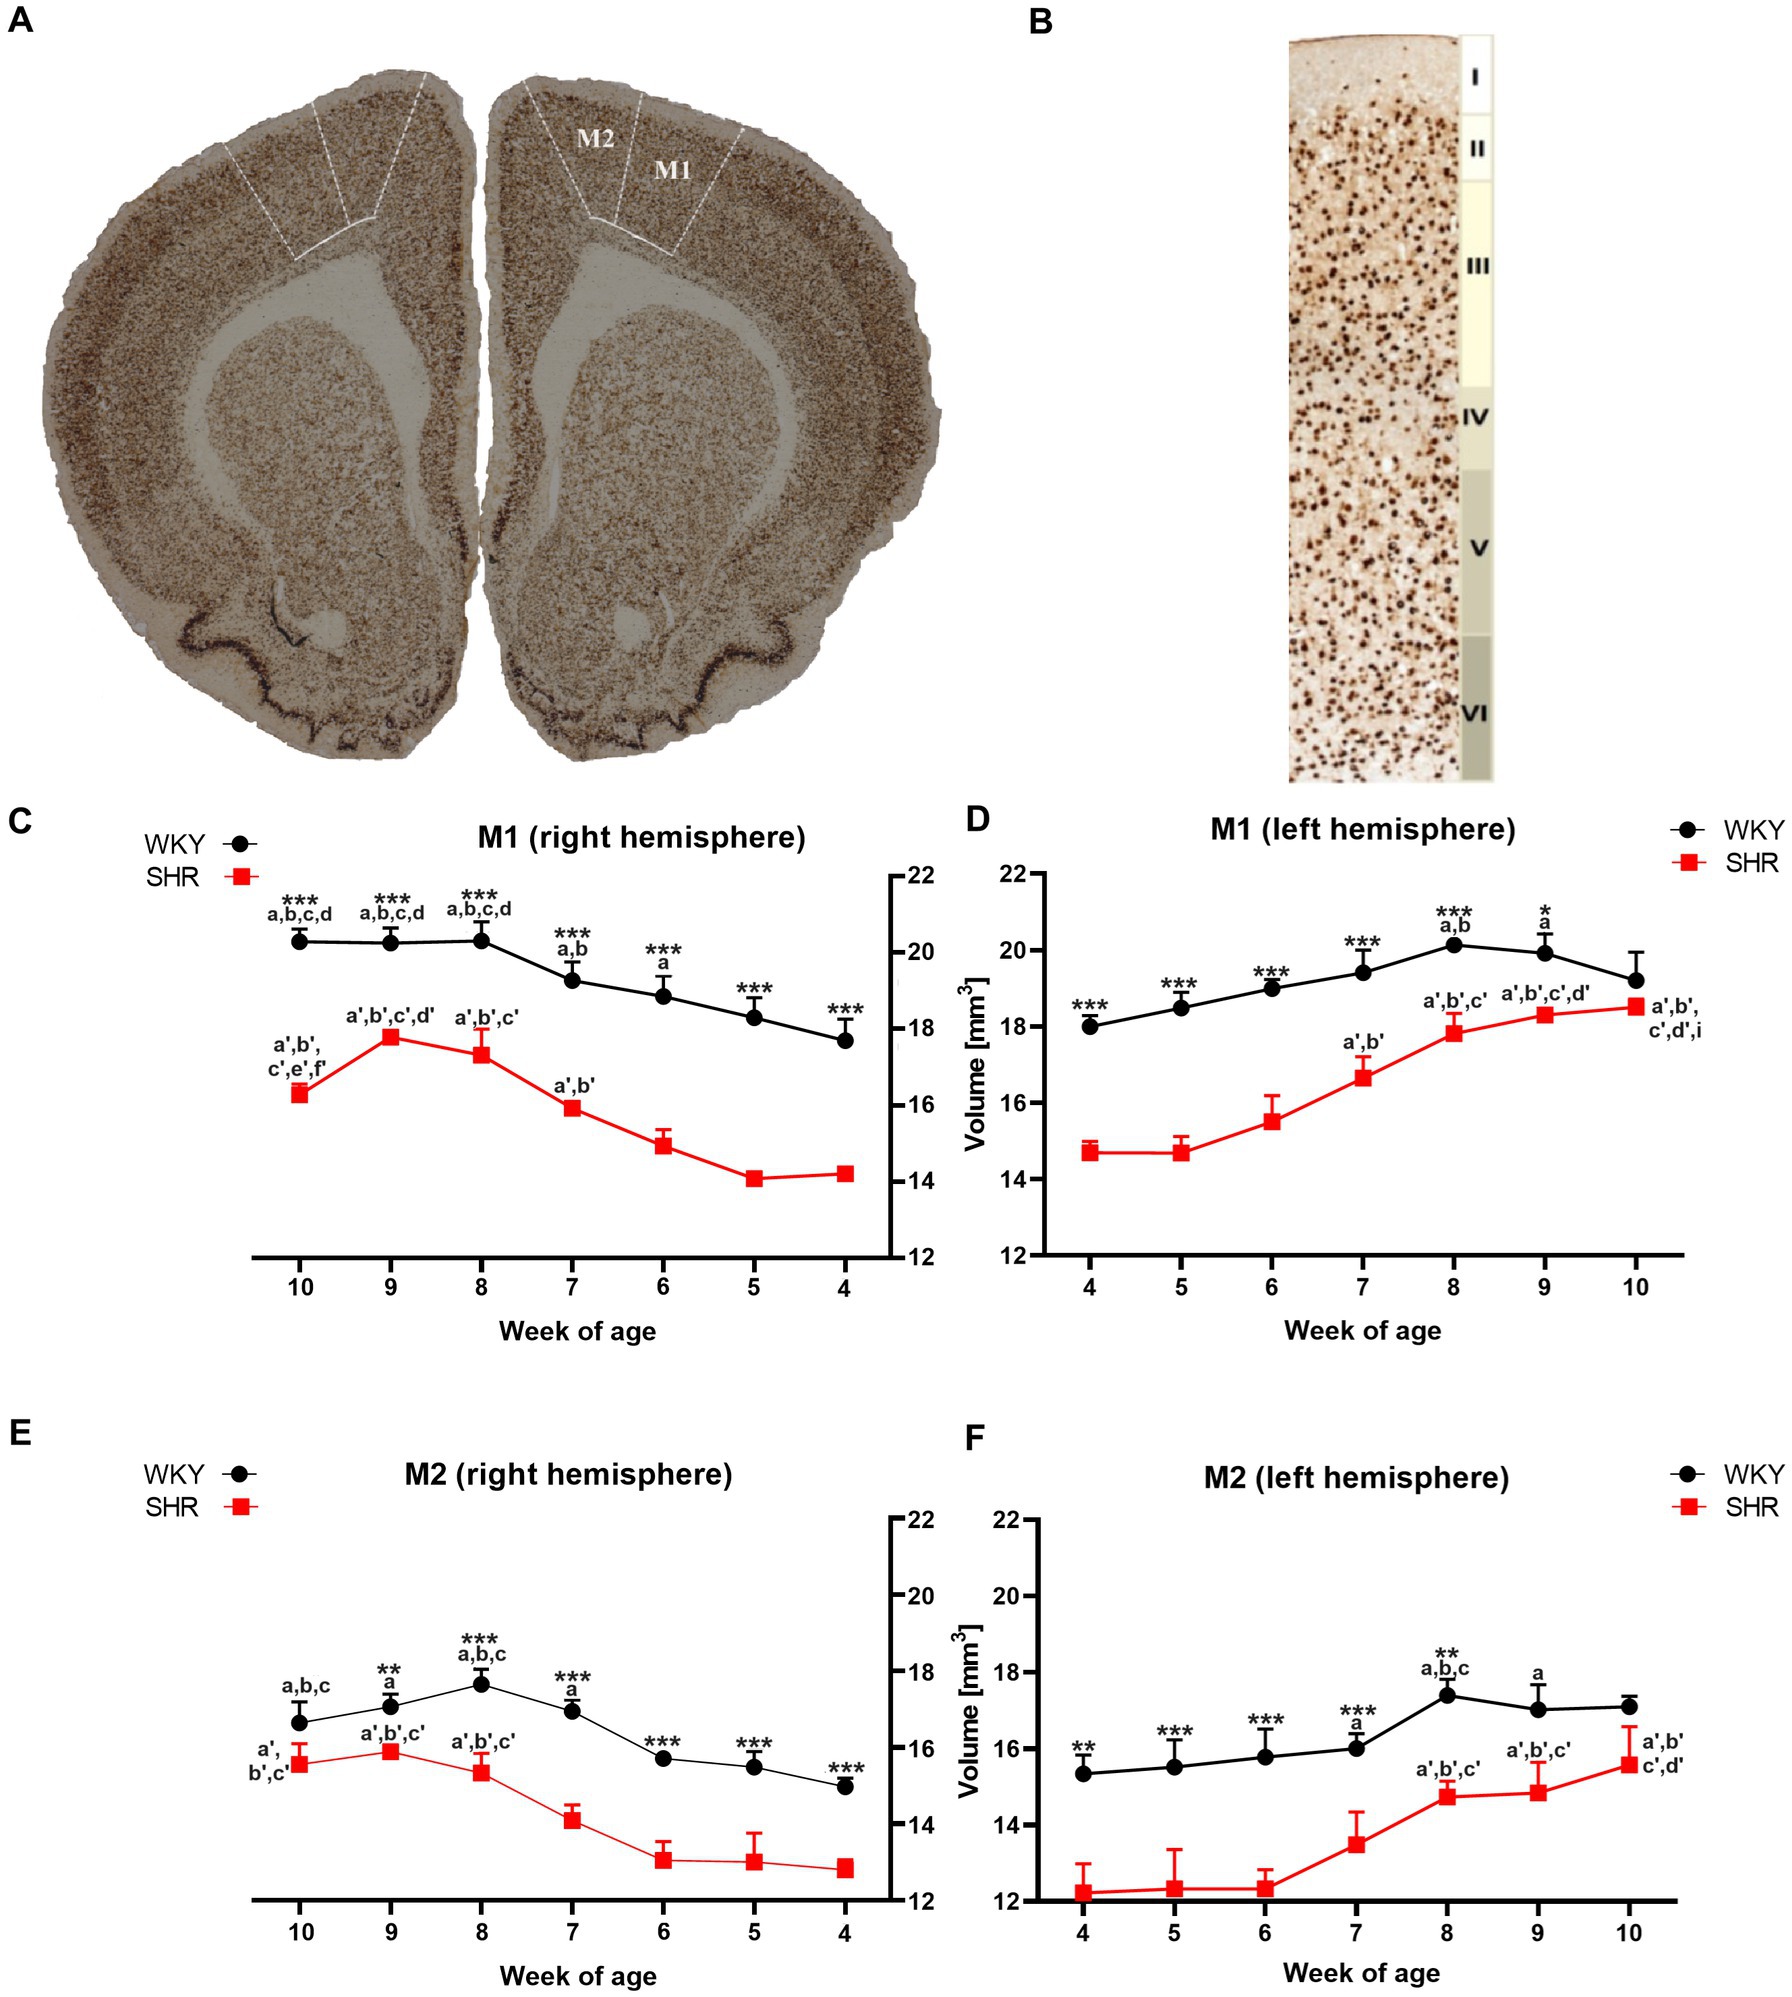
Figure 1. The figure shows (A) a coronal section of a rat brain (8-week-old WKY; magnification x 5.0) highlighting the primary (M1) and secondary (M2) motor cortex (bregma 2.28 mm; Paxinos and Watson, 2005). (B) NeuN-stained brain section illustrates cytoarchitectonic features in the M1 of 8-week-old WKYs. 10.0 x magnification, delineating cortical layers (I - molecular layer, II - external granular layer, III - external pyramidal layer, IV - internal granular layer, V - internal pyramidal layer, and VI - multiform layer). Moreover, volume comparisons of M1 (C) right hemisphere and (D) left hemisphere, and M2 (E) right hemisphere and (F) left hemisphere during their development (4–10 weeks) in SHRs and WKYs are shown (n = 5 or 6 for each strain at each age stage). Differences between strains: *p < 0.05, **p < 0.01, ***p < 0.001. Differences between rats dependent on age: a-f - indicate developmental differences (p < 0.05-p < 0.001) for WKYs strain; a’-f’ - indicate developmental differences (p < 0.05-p < 0.001) for SHRs strain; a, a’- 4 week vs. other weeks; b, b’ - 5 week vs. other weeks; c, c’ - 6 week vs. other weeks; d, d’ - 7 week vs. other weeks; e, e’ - 8 week vs. other weeks; f, f’ - 9 week vs. 10 week; i - indicate differences between hemispheres.
2.3.2 The density quantificationDetermining the cellular composition of specific motor cortex layers in SHR/NCrl and WKY/NCrl is crucial to understanding the participation of this structure in the pathophysiology of ADHD. In this experiment, we estimated the number of cell bodies in the M1 and M2 layers (I - molecular layer, II - external granular, III - external pyramidal, IV - internal granular, V - internal pyramidal, VI - multiform) (Alaverdashvili et al., 2014; Figure 1B) of both hemispheres from a single SHR/NCrl and WKY/NCrl. The motor cortex layers were distinguished by the cytoarchitectonic characteristics of this structure described in previous papers (Kriegstein and Dichter, 1983; Alaverdashvili et al., 2014). The analysis was performed on the sections from the beginning to the end of the brain at 250 μm intervals between sections. Every 4th section at the level of the M1/M2 were analyzed (17–20 sections per animal) at equidistant locations within this area. Quantitative analysis was performed manually on both the right and left sides with an Olympus BX51 microscope (magnification 40 x) equipped with a digital camera (Olympus, Germany) and a computer with Cell F software (Olympus, Germany). Neurons featuring a well-defined nucleus were counted in areas of individual motor cortex layers (M1/M2), precisely outlined using the mouse cursor. The Cell F software cell counter tool recorded mouse clicks on the neurons with distinct nuclei. Notably, nuclei positioned on the boundaries of the studied areas were not considered. The neuronal count for a specific layer of the structure underwent an initial averaging process across all examined brain sections. Subsequently, the averages for each developmental stage were computed and presented as the number of neurons per square millimeter (N/mm2).
2.4 Determination of immune, oxidative stress, and metabolic markersRationale for selecting immune, oxidative stress, and metabolic markers in the study can be found in Supplementary material 2.
2.4.1 Preparation of test materialTo ascertain the concentrations/activity of inflammatory, oxidative stress, and metabolic markers in the rat PFC, specific brain parts were isolated in accordance to The Rat Brain Atlas (Paxinos and Watson, 2005), followed by homogenization in RIPA buffer at 4°C. The homogenates were subsequently centrifuged at 30,000 × g for 1 h. Next, the resulting tissue supernatants were aliquoted and preserved at −80°C. These supernatants served as the basis for further measurements.
2.4.2 Immunoenzymatic determination (ELISA) of the levels of immune markers such us cytokines: interleukin-1α (IL-1α), IL-1β, IL-6, serine/threonine-protein mammalian target of rapamycin (mTOR), RAC-alpha serine/threonine-protein kinase (AKT-1) and glucocorticoid receptor β (GCsRβ)The concentrations of these markers in the PFC were determined using a commercial ELISA kits were used according to the manufacturer’s instructions (Supplementary material 2). The absorbance in this test plate was measured by plate reader TECAN Infinite M200 PRO (Austria) at the wavelength of λ = 450 nm. Results were presented per milligram of protein.
2.4.3 Determination of oxidative stress markers 2.4.3.1 The content of malondialdehyde (MDA) and sulfhydryl group (-SH)MDA levels were assessed following the protocol outlined by Weitner et al. (2016), and the -SH content was determined using the Ellman method (Chan and Wasserman, 1993).
2.4.3.2 The superoxide dismutase (SOD), peroxidase (POD), glutathione reductase (GSR) and glutathione S-transferase (GST) activityFor the evaluation of enzymatic activities, SOD and GSR activity was measured by the Tkachenko and Grudniewska method (Tkachenko et al., 2014), while GST activity was assessed through a spectrophotometric assay procedure (Habig et al., 1974). Additionally, POD activity was measured employing the kinetic method (Bovaird et al., 1982).
2.4.4 Determination of metabolic markers 2.4.4.1 The content of glucose (G), fructosamine (FrAm), iron (Fe) and lactic acid (LA)The quantification of G, FrAm, Fe, and LA content was conducted employing specific commercial reagent sets as outlined in Supplementary material 2, following the manufacturer’s instructions.
2.4.4.2 The activity of alanine transaminase (ALT), aspartate transaminase (AST) and lactate dehydrogenase (LDH)The activity of ALT, AST and LDH was determined using appropriate commercial reagent sets according to manufacturer instructions. List of specific sets used to determine studied oxidative stress markers concentrations in rat PFC can be found in Supplementary material 2.
2.5 In-silico methods: protein–protein interaction analysisProteins are the fundamental structures of life and perform an essential role in most biological processes that are controlled through their mutual interactions (Lu et al., 2020). Protein–protein interactions (PPIs) in cells form a highly organized network called the ‘interactome’ (Venkatesan et al., 2009; Koh et al., 2012), which controls both physiological and pathophysiological processes, including signal transduction between compartments as well as growth, proliferation, cell differentiation and their apoptosis (Loregian and Palù, 2005; Arkin and Whitty, 2009; Nero et al., 2014). Given the recognition of abnormal PPI networks in the pathophysiology of neurodegenerative diseases (Blazer and Neubig, 2009), we decided to check interactions between studied immunological, oxidative stress and metabolic-related markers in the present study. For this purpose, we have used the online search tool STRING (Version: 11.5).
The Rattus norvegicus reference genome was used to generate the selected PPI networks using the STRING database with the cut-off criterion p < 0.05 and Markov Clustering (MCL) of nodes. Next, the results of these queries were filtered according to the required criteria: full STRING network, p-adjusted ≤0.05 (Benjamini–Hochberg correction), confidence equal to 0.400, the confidence of network edges, query protein only, and three groups of clusters. Finally, Gene Ontology Resource (GO, Gene Ontology Resource) enrichment analysis was applied to visualize and indicate corresponding biological functions for the markers under study.
2.6 Statistical analysisFirstly, a preliminary analysis was conducted to assess normality using the Shapiro–Wilk test and homogeneity of variances using Levene’s test, confirming the assumptions necessary for subsequent analyses. Subsequently, a two-way ANOVA was performed with strain and time as independent factors. To ensure accuracy, reliability, and proper interpretation of the statistical results, Bonferroni post-hoc comparison tests were subsequently applied. Comparisons between hemispheres were made based on an ANOVA analysis that included the whole data sets (for both hemispheres). All statistical procedures were performed with the aid of GraphPad Prism 6 (GraphPad Software, La Jolla, CA, United States), and p < 0.05 was considered statistically significant. Detailed data regarding individual two-way ANOVA analyses are included in Supplementary material 3.
3 Results 3.1 Alterations in motor cortex 3.1.1 Volumetric changes 3.1.1.1 Primary motor cortex (M1)A comparative analysis showed that the total volumes of M1 in almost all examined age stages of SHRs were significantly lower (p < 0.05 or p < 0.001) than in the WKYs (Figures 1C,D). Additionally, in the ADHD group, the total volumes of M1 in the right hemisphere (Figure 1C) at 10-weeks of life were significantly lower (p < 0.05) than in the left hemisphere (Figure 1D). In the control group, during weeks 6 to 8 of age a significant (p < 0.05–0.01) increase in the M1 volumes (right hemisphere) was observed, while in SHRs, this occurred only after the age of 7 weeks (p < 0.01). Interestingly, over 8 weeks of age, the volume of M1 in the WKYs was maintained at a similar level.
3.1.1.2 Secondary motor cortex (M2)Like M1, the total volumes of M2 in almost all examined age stages of SHRs (except 9 weeks in left hemisphere and 10 weeks in the right and left hemisphere) were significantly lower (p < 0.01 or p < 0.001) than in the WKYs (Figures 1E,F). However, unlike M1 in all age stages in the ADHD group, there were no statistically significant differences (p > 0.05) in the volume of M2 between the hemispheres. In the control and ADHD group, from 4 to 7 weeks of age, the total volume of M2 did not differ significantly. Whereas WKYs and SHRs in week 7/8 old, a significant increase (p < 0.001) in these volumes has been found (depending on the hemisphere), which remained unchanged to 10 weeks of age.
3.1.2 The changes in the density of neurons in the particular layers of primary (M1) and secondary (M2) motor cortexThe mean neuron density of almost all studied layers in both motor cortex areas differed between SHRs and WKYs. Means for neuron density in each from all studied layers of M1 and M2 were listed in Figures 2, 3.

Figure 2. Comparison of neurons density [mm2] in particular layers of the primary motor cortex (M1): I layer in the right (A) and left (B) hemisphere; II layer in the right (C) and left (D) hemisphere; III layer in the right (E) and left (F) hemisphere; IV layer in the right (G) and left (H) hemisphere; V layer in the right (I) and left (J) hemisphere; VI layer in the right (K) and left (L) hemisphere during brain development (4–10 weeks) in SHRs and WKYs (n = 5 or 6 for each strain at each age). Differences between strains: *p < 0.05, **p < 0.01, ***p < 0.001. Differences between rats dependent on age: a-f - indicate developmental differences (p < 0.05-p < 0.001) for WKYs strain; a’-f’ - indicate developmental differences (p < 0.05-p < 0.001) for SHRs strain; a, a’- 4 week vs. other weeks; b, b’ – 5 week vs. other weeks; c, c’ - 6 week vs. other weeks; d, d’ - 7 week vs. other weeks; e, e’ - 8 week vs. other weeks; f, f’ - 9 week vs. 10 week; i - indicate differences between hemispheres.
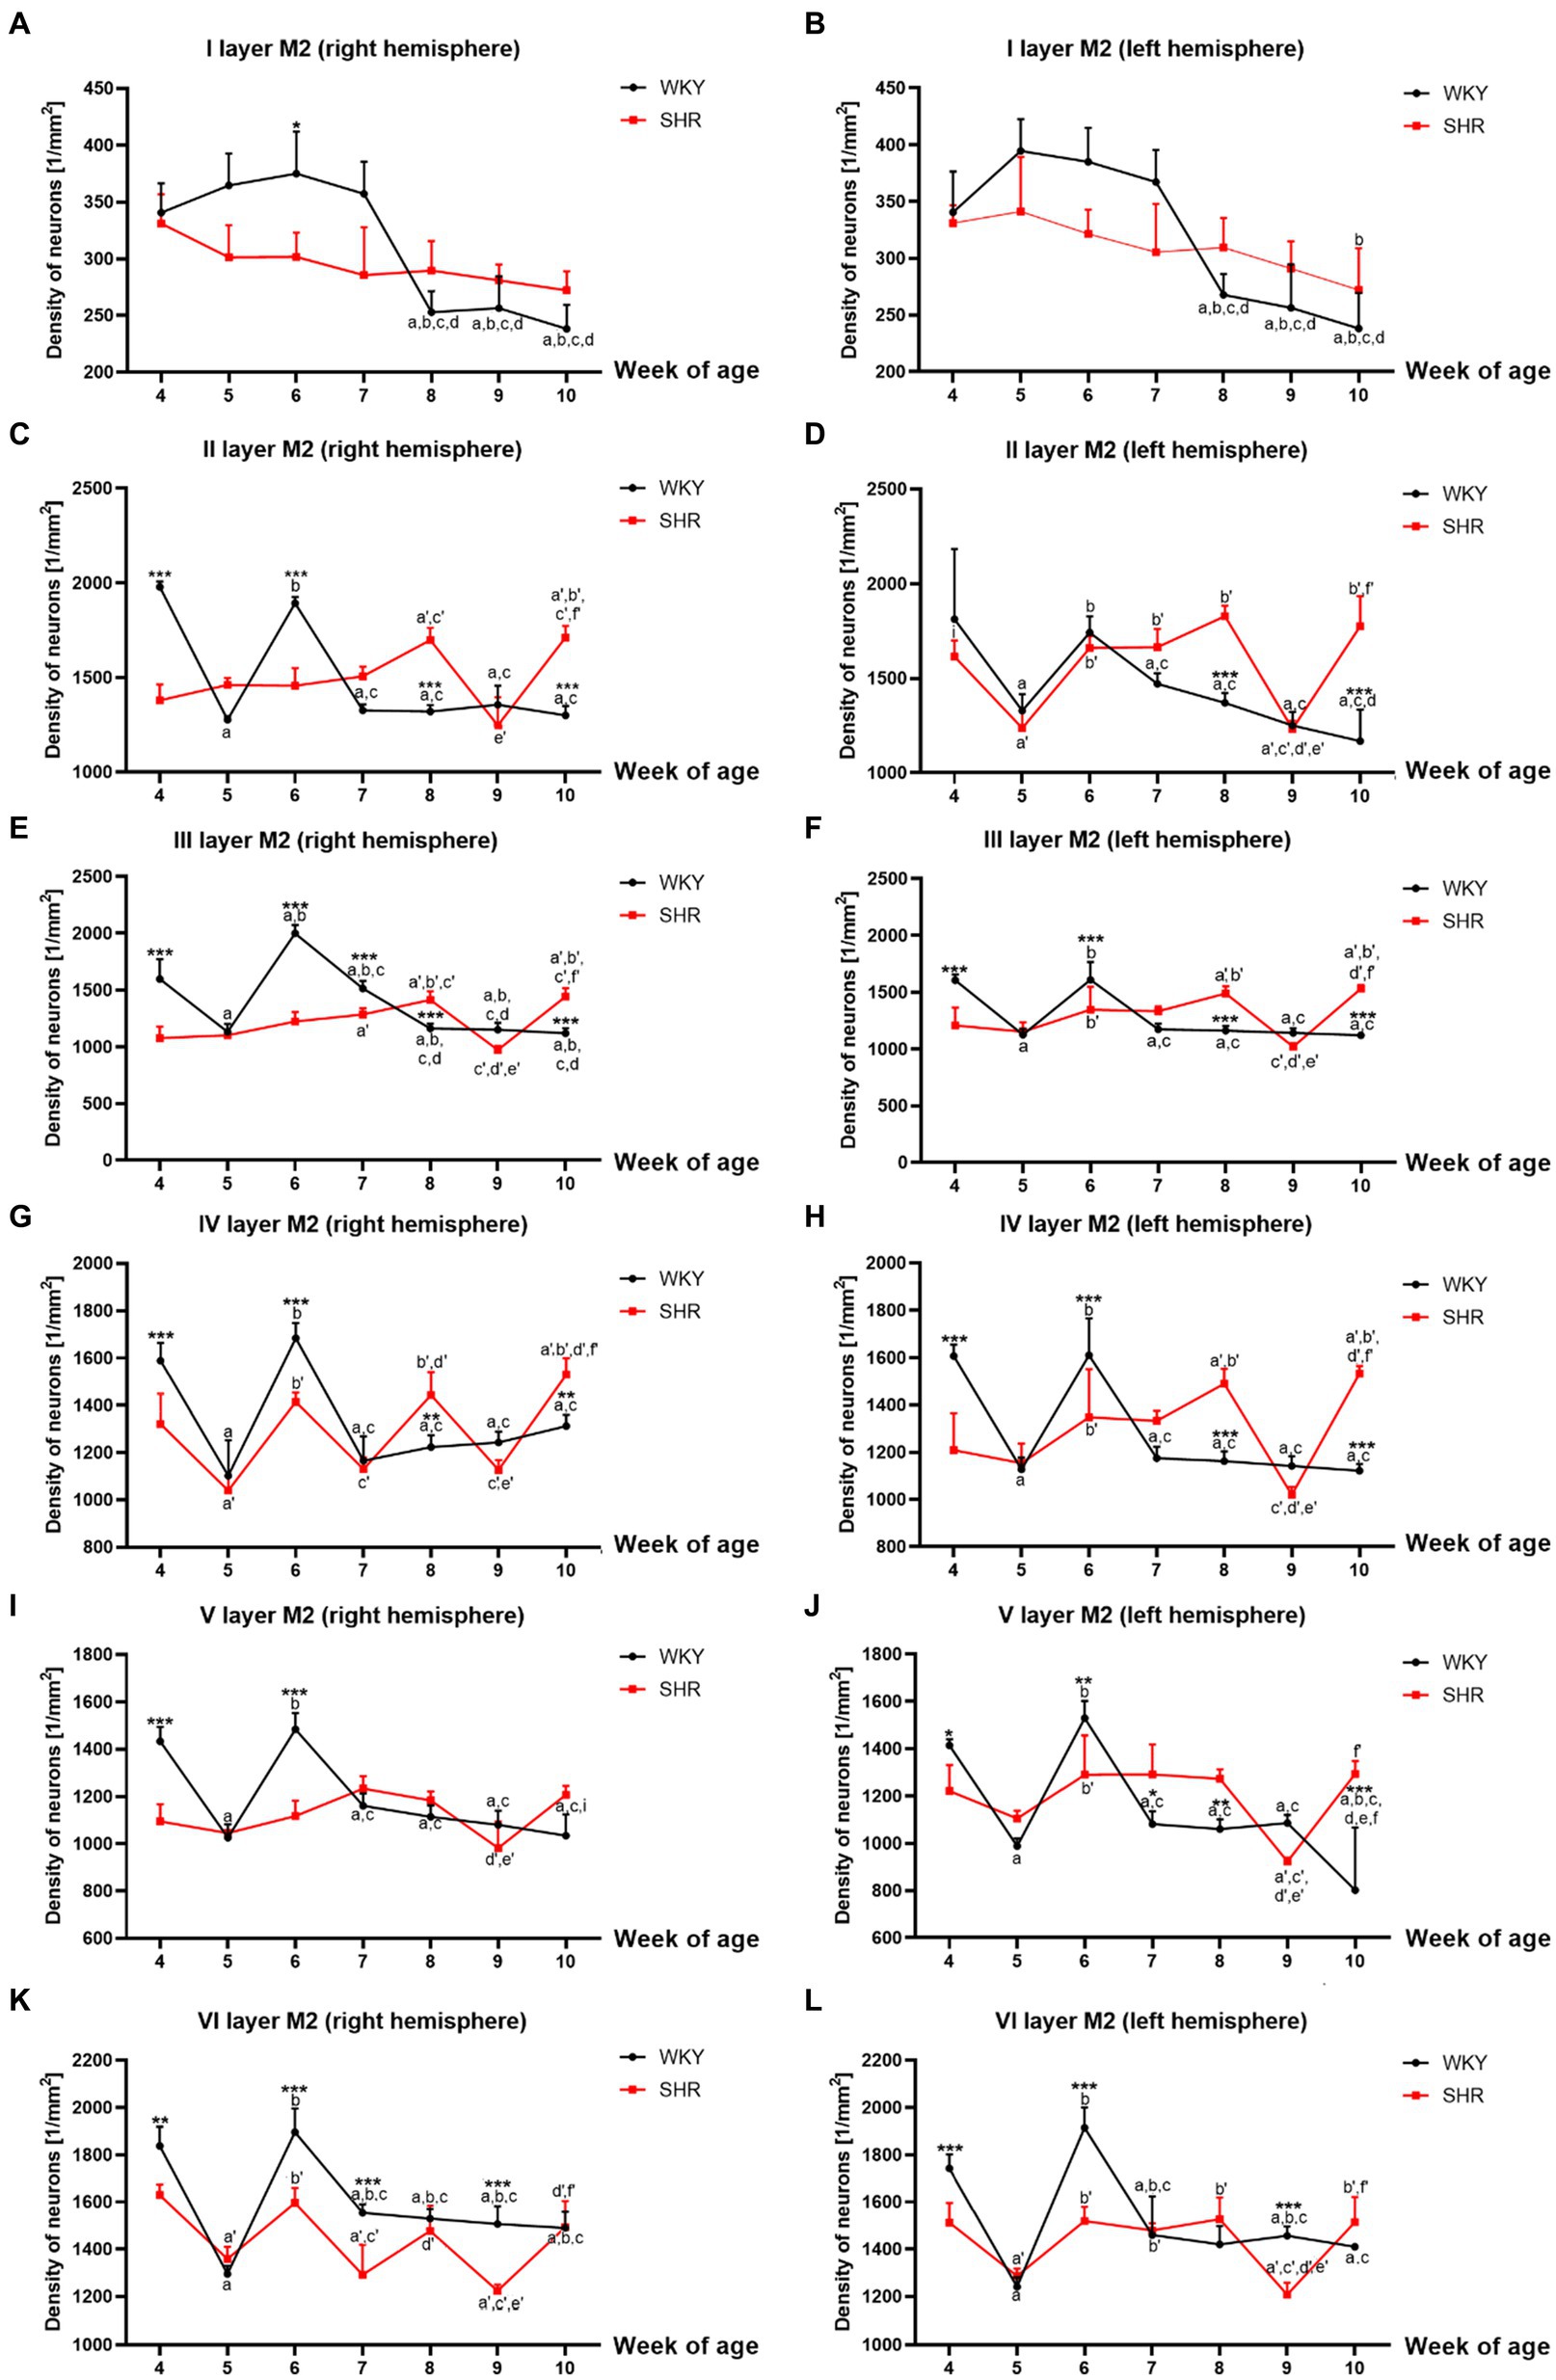
Figure 3. Comparison of neurons density [mm2] in particular layers of the secondary motor cortex (M2): I layer in the right (A) and left (B) hemisphere; II layer in the right (C) and left (D) hemisphere; III layer in the right (E) and left (F) hemisphere; IV layer in the right (G) and left (H) hemisphere; V layer in the right (I) and left (J) hemisphere; VI layer in the right (K) and left (L) hemisphere during brain development (4–10 weeks) in SHRs and WKYs (n = 5 or 6 for each strain at each age). Differences between strains: *p < 0.05, **p < 0.01, ***p < 0.001. Differences between rats dependent on age: a-f - indicate developmental differences (p < 0.05-p < 0.001) for WKYs strain; a’-f’ - indicate developmental differences (p < 0.05-p < 0.001) for SHRs strain; a, a’- 4 week vs. other weeks; b, b’ - 5 week vs. other weeks; c, c’ - 6 week vs. other weeks; d, d’ - 7 week vs. other weeks; e, e’ - 8 week vs. other weeks; f, f’ - 9 week vs. 10 week, i - indicate differences between hemispheres.
3.1.2.1 Primary motor cortex (M1)Mean neuron density in almost all studied layers of M1 with the exceptions of layers I, V and VI, was significantly higher in 7, 8 and/or 10-week-old SHRs (p < 0.05-p < 0.001) compared to their age-matched controls (Figures 2A–L). Whereas the density of neurons in these layers of 4, 6, and/or 9 weeks old was usually significantly lower (p < 0.05-p < 0.0001) than that observed in the WKYs (Figures 2A–L).
Neuron density changes in the SHRs had a unique pattern in all studied layers of M1. For example, the neurons number was relatively high in 7- and/or 10-week-old animals except for layers I (Figures 2A,B), V (Figures 2I,J) and VI (Figures 2K,L)]. Whereas, in 9-week-old SHRs, a significant drop (p < 0.05-p < 0.0001) in the neuron density was noted in layers: III (right hemisphere; Figure 2E), IV (left hemisphere; Figure 2H) and VI (left hemisphere; Figure 2L). It is worth adding that this pattern varied depending on the studied layer during the rest of the postnatal development.
Further analyses also revealed that the mean number of neurons differed significantly between the right and left hemispheres in the SHRs. For example, a higher density of these cells was seen for the first time in layers III in week 4 (p < 0.05) and 7 (p < 0.01; Figure 2F vs. Figure 2E) and layer IV in week 8 (p < 0.01; Figure 2H vs. Figure 2G) of the left hemisphere. In comparison, the right hemisphere had significantly higher neuronal density in layer III in week 10 (p < 0.01; Figure 2E vs. Figure 2F) and layer V in week 5 (p < 0.001; Figure 2I vs. Figure 2J) than on the left hemisphere.
Specific changes across postnatal development characterized neuron density in M1 of WKYs, as shown in Figures 2A–L. For example, the highest (p < 0.05–0.001, except for layer I) density of neurons in all studied layers was detected in 4- and/or 6-week-old animals. Between these developmental stages, in 5-week-old WKYs, the neuron density rapidly decreased (p < 0.0001). From 7 to 10 weeks, the density was maintained at a similar level (p > 0.05). Moreover, the distribution pattern of these cells was quite similar in the right and left hemispheres.
3.1.2.2 Secondary motor cortex (M2)Similarly to M1, almost all studied layers of M2 of 8 and/or 10-week-old SHRs had a significantly higher (p < 0.01–0.001) density of neurons than control animals except for I layer (right and left hemisphere; p > 0.05; Figures 3A,B), V layer (right hemisphere; p > 0.05; Figure 3I) and VI layer (right and left hemisphere; p > 0.05; Figures 3K,L). In contrast, in 4- and 6-week-old animals, the density was relatively low (p < 0.05–0.001) in most of the studied layers [with the exceptions of layer I - left hemisphere (Figures 3B), II - left hemisphere (Figure 3D)]. Additionally, a significant reduction in the neuronal density in 9-week-old SHRs was shown only in layer VI (p < 0.001; right and left hemisphere; Figures 3K,L).
All studied layers of M2 in SHRs displayed a unique cellular distribution pattern (Figures 3A–L). More precisely, neurons were more numerous (p < 0.05–0.01) in 8- and/or 10-week-old animals than in the remaining age stages studied. An increase in the density of neurons in 10-week-old SHRs observed in almost all layers of M2 (except for: I layer (Figures 3A,B), V layer (right hemisphere; Figure 3I) and VI layer (Figures 3K,L)) was always preceded by a decrease (p < 0.05–0.01) in average neuron density in 9-week of life. Whereas, at the other age stages of postnatal development of these animals, the pattern was changed according to the layer studied. Thus, in layers II (left hemisphere; Figure 3D), IV (right hemisphere; Figure 3G) and VI (right and left hemisphere Figures 3K,L) of 5-week-old SHRs a significant decrease (p < 0.01) in neuronal density was detected. Meanwhile, in 6 and/or 7-week-old animals, the density of neurons increased significantly (p < 0.05) in layer II (with the exception right hemisphere; Figure 3D), III (Figures 3E,F), IV (Figures 3G,H), V (except right hemisphere; Figure 3J), and VI (Figures 3K,L). Moreover, the comparative analysis of the right and left hemispheres of SHRs has revealed the differences in density between them. For example, in layer II in week 4, the neuron density of the left hemisphere (p < 0.05; Figure 3D) reached the highest value compared to the right hemisphere (Figure 3C).
The changes in neuronal density in WKYs across postnatal development were generally repeatable, as shown in Figures 3A–L. In a like manner the M1 and M2 of WKYs presented the highest (p < 0.01) neuronal density in weeks 4 and 6 of life. It is worth mentioning that between these developmental stages (in week 5), there was a significant drop (p < 0.05) in neuronal density. Moreover, in WKYs, from 7 to 10 weeks of life, the density was maintained at a similar level (p > 0.05).
Further analysis showed no hemispheric differences in WKYs during their postnatal development apart from layer V in week 10, where was observed the higher density of neurons in the right hemisphere (p < 0.01; Figure 3I) compared to the left hemisphere (Figure 3J).
3.2 Inflammatory markersThe level of IL-1α (Figure 4A), IL-6 (Figure 4C), serine/threonine-protein mammalian target of rapamycin (mTOR; Figure 4D), glucocorticoid receptor β (GCsRβ; Figure 4E) and RAC-alpha serine/threonine-protein kinase (AKT-1; Figure 4F) were significantly higher (p < 0.05) in 5-week-old SHRs than in age-matched control. In contrast, IL-1β (Figure 4B) levels did not differ significantly between 5-week-old SHRs and WKYs (p > 0.05). Additional analyses showed that the level of IL-6 and AKT-1 were significantly elevated in 10-week-old WKYs compared to 5-week-old animals of the same strain (p < 0.015, p < 0.03; respectively). In comparison, the level of IL-1α, IL-1β, IL-6, m-TOR, GCsRβ and AKT-1 was similar in 10-week-old animals (p > 0.05).

Figure 4. The levels of interleukin (IL)-1α (A), IL-1β (B), IL-6 (C), serine/threonine-protein mammalian target of rapamycin (mTOR; D), glucocorticoid receptor (GCsRβ; E) and RAC-alpha serine/threonine-protein kinase (AKT-1; F) in PFC supernatants. The data are expressed as the mean ± SEM (n = 6/per group). The following statistical levels were applied: * indicates differences (p < 0.05) between SHRs and WKYs, p < 0.015, p < 0.03 indicate differences between the juvenile and maturing rats of the same strain.
3.3 Oxidative stress markersAll studied oxidative stress markers were significantly higher in 5-week-old SHRs compared to age-matched control (Figures 5A–F). Moreover, the levels of MDA (Figure 5A), -SH (Figure 5B), SOD (Figure 5C), GSR (Figure 5E), and GST (Figure 5F) were significantly higher in 5-week SHRs compared to 10-week-old animals.
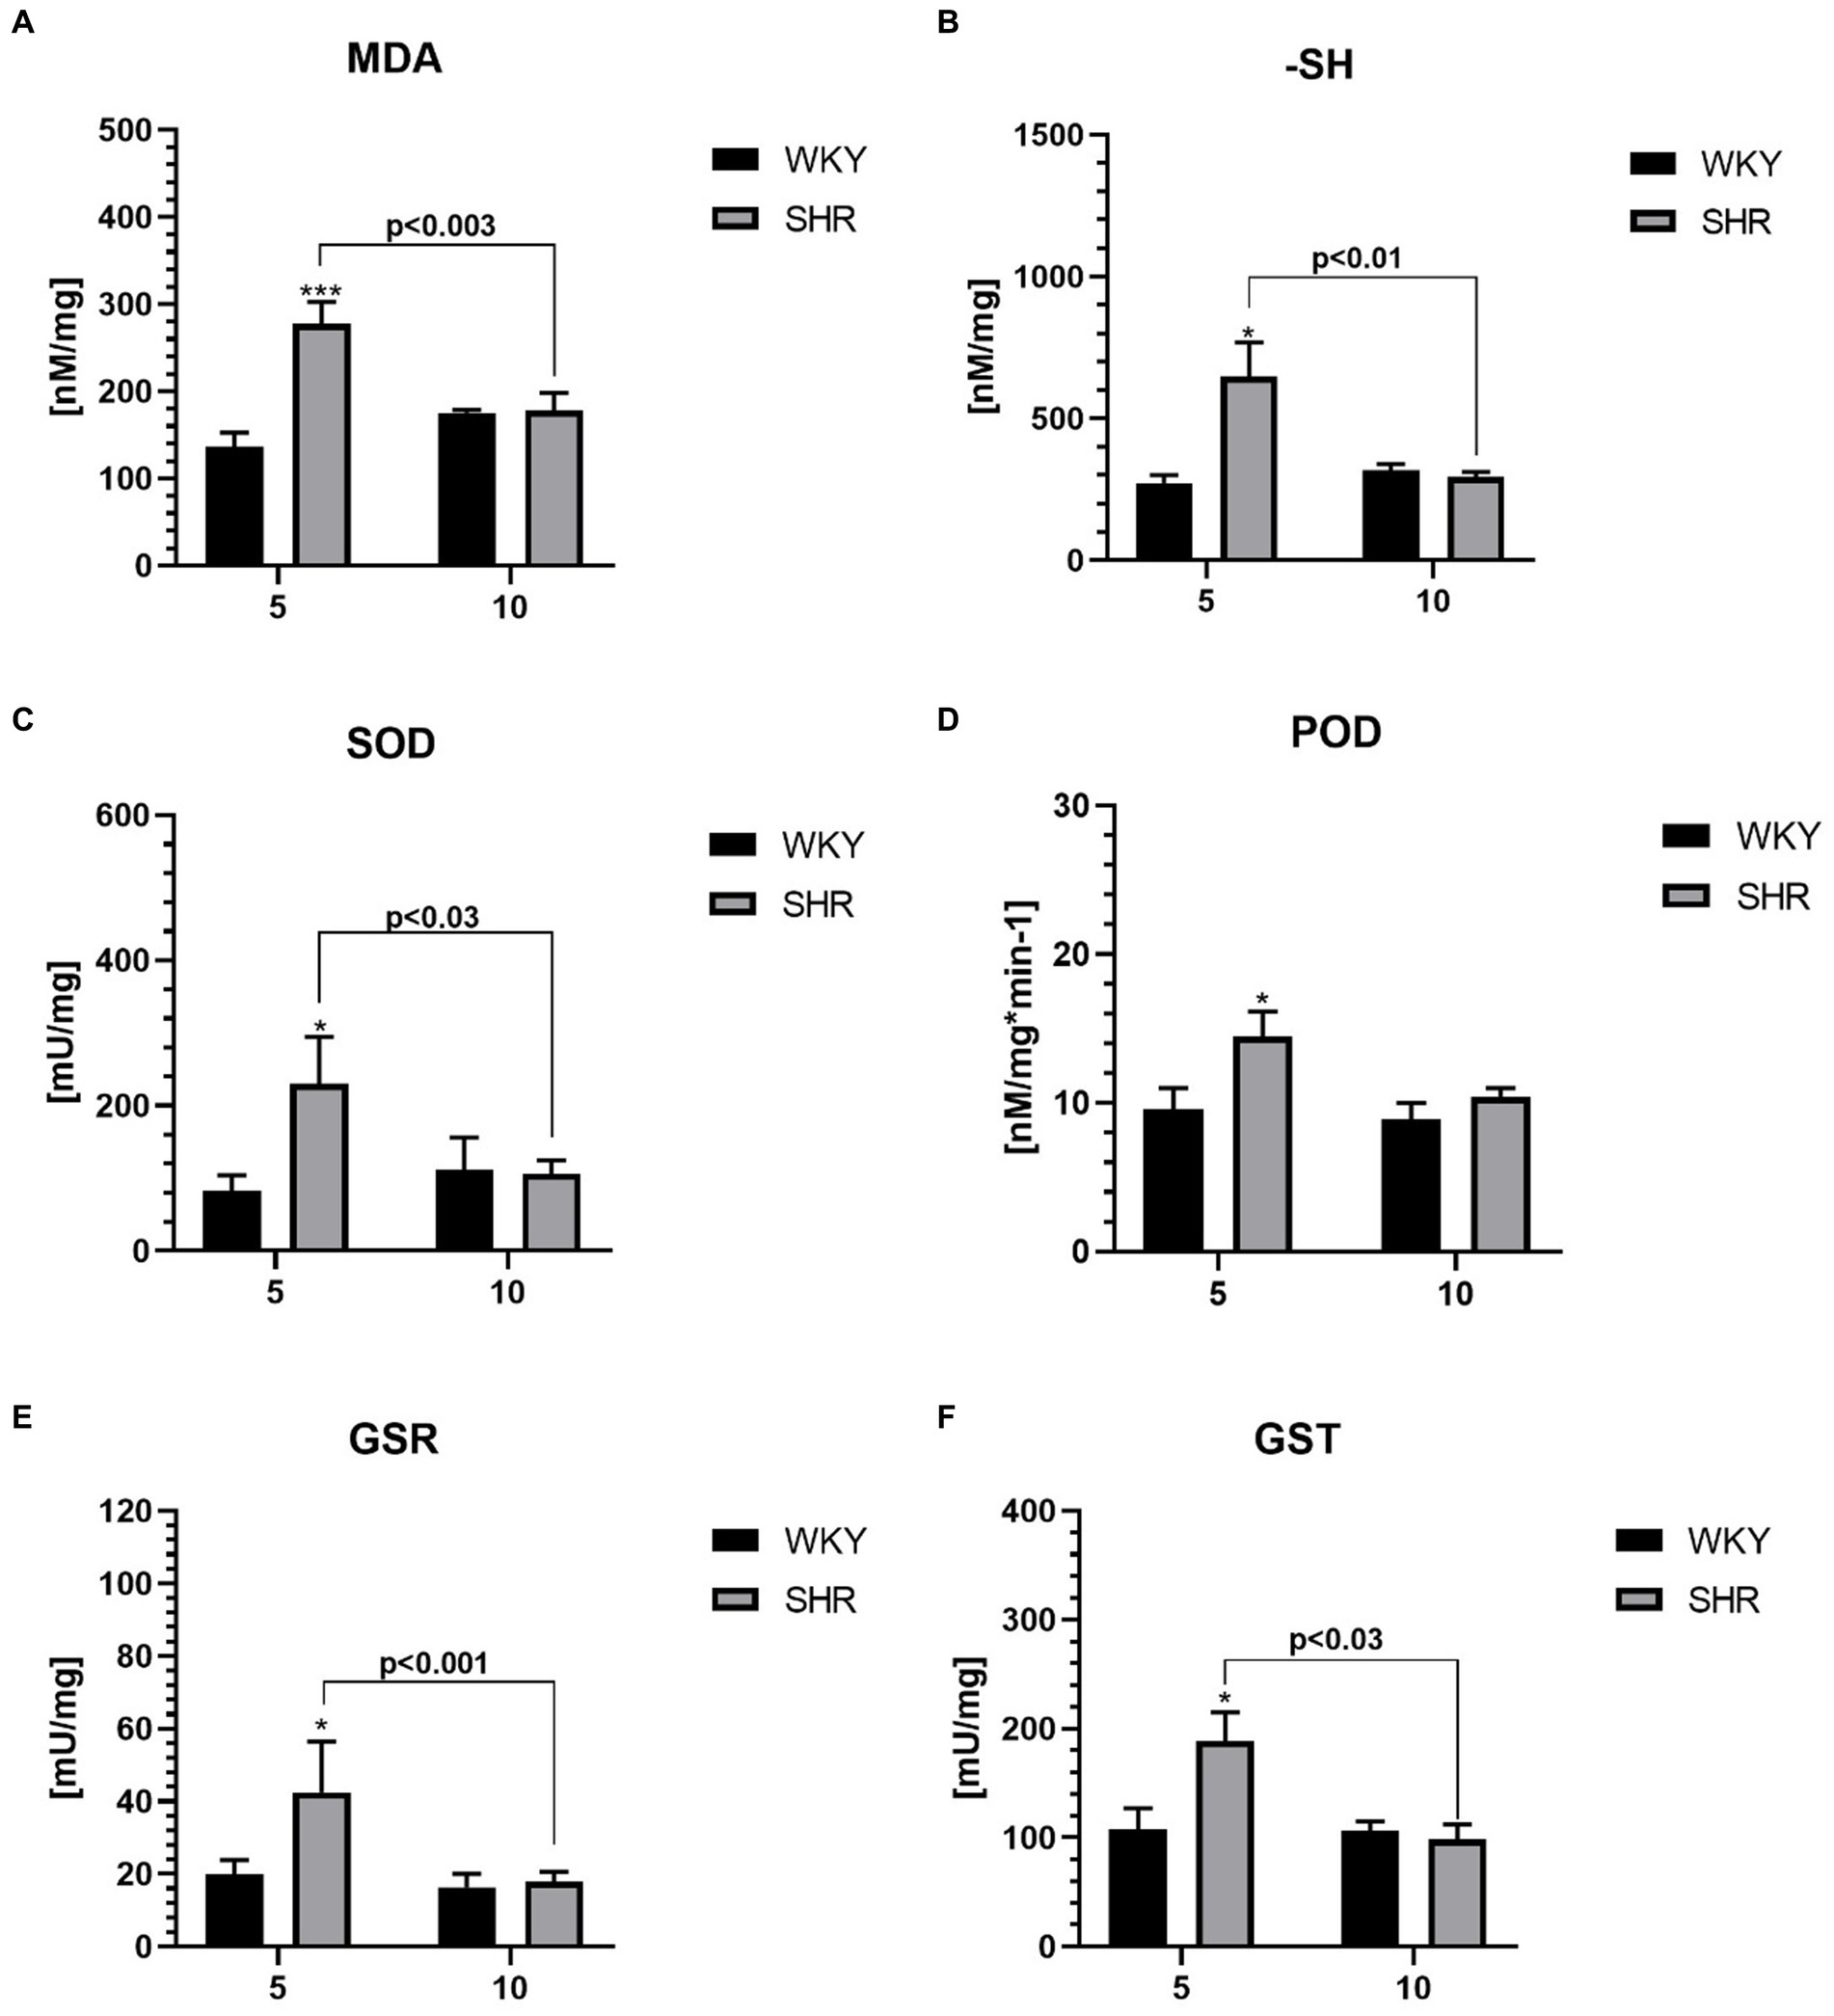
Figure 5. The levels of malondialdehyde (MDA) (A) and sulfhydryl group (-SH) (B), superoxide dismutase (SOD) (C), peroxidase (POD) (D), glutathione reductase (GSR) (E) and glutathione S transferases (GST) (F) in PFC supernatants. The data are expressed as the mean ± SEM (n = 6 per group). The following statistical levels were applied: *, *** indicates differences (p<0.05, p<0.001) between SHRs and WKYs; p<0.03, p<0.01, p<0.003, p<0.001 - indicate differences between the juvenile and maturing rats of the same strain.
3.4 Metabolic markersThe levels of glucose (G; Figure 6A), fructosamine (FrAm; Figure 6B), iron (Fe; Figure 6C), lactic acid (LA; Figure 6D), alanine transaminase (ALT; Figure 6E), aspartate transaminase (AST; Figure 6F) and lactate dehydrogenase (LDH; Figure 6G) in the PFC were significantly higher in 5-week-old SHRs than in aged-matched WKYs. Furthermore, the ALT, AST, and LDH level was also significantly higher in 5-week-old SHRs compared to 10-week-old rats of the same strain.
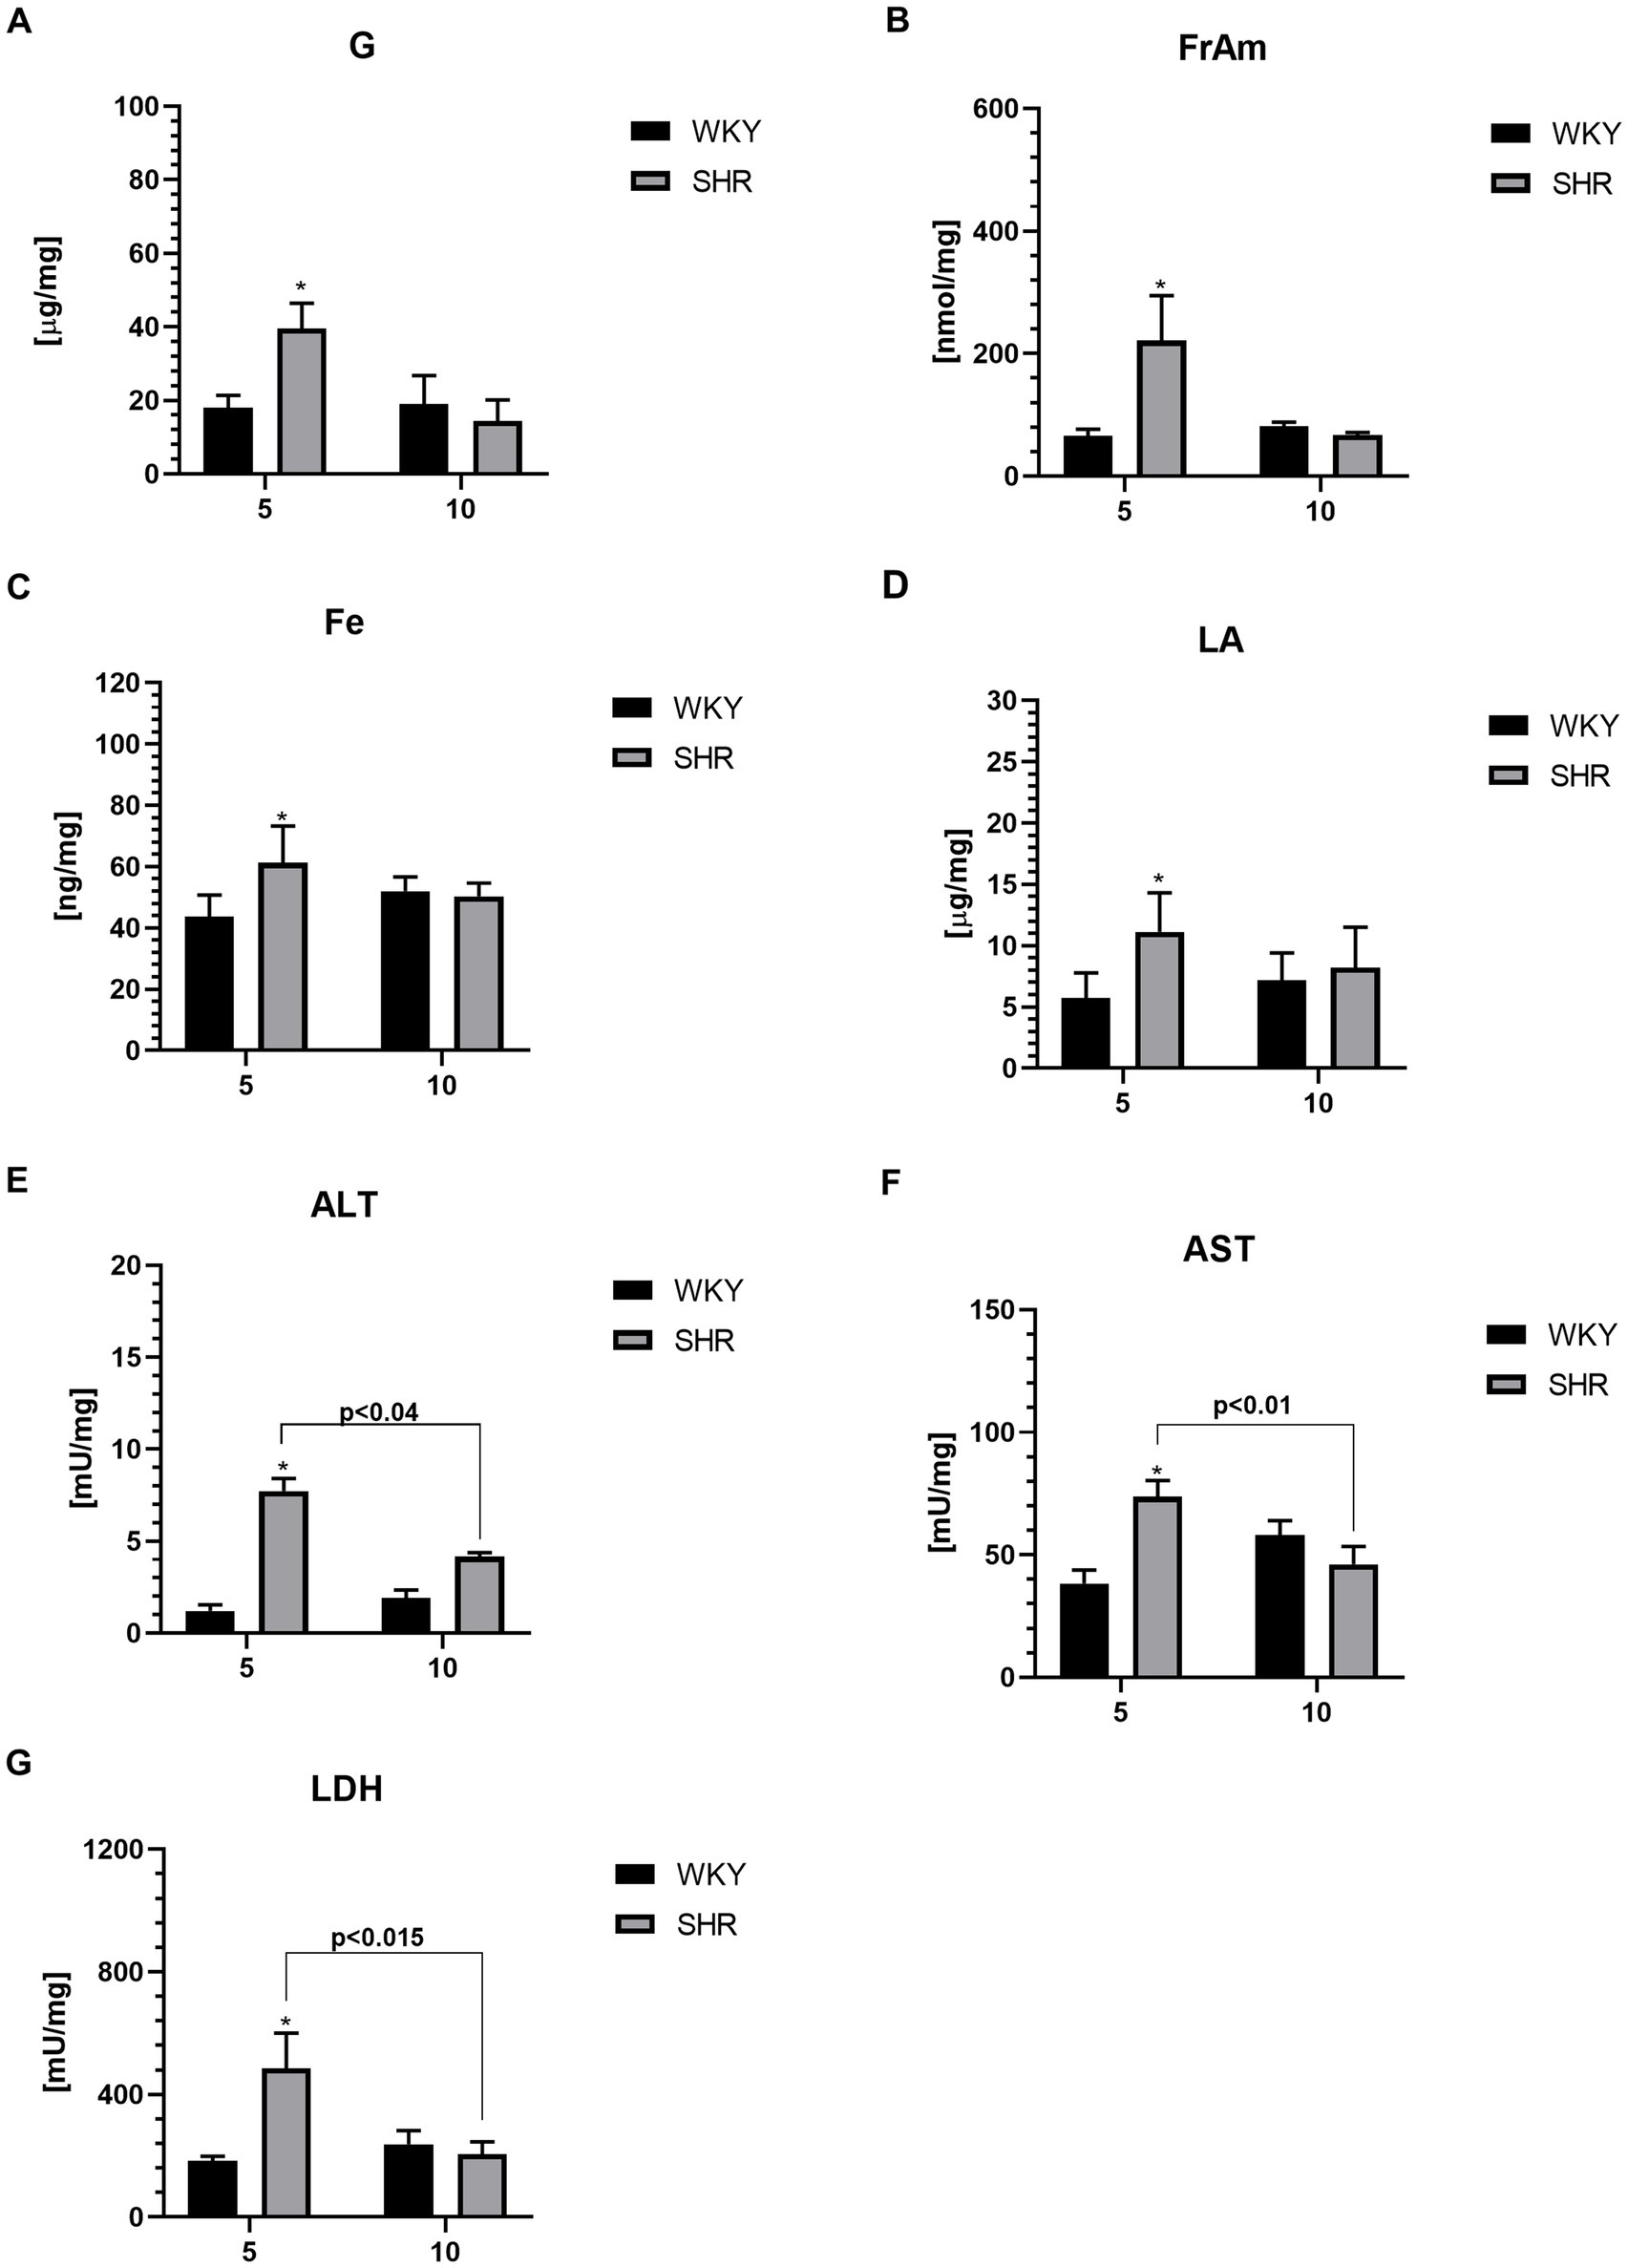
Figure 6. The levels of glucose (G) (A), fructosamine (FrAm) (B), iron (Fe) (C), lactic acid (LA) (D), alanine transaminase (ALT) (E), aspartate transaminase (AST) (F) and lactate dehydrogenase (LDH) (G) in PFC supernatants. The data are expressed as the mean ± SEM (n = 6 per group). The following statistical levels were applied: *, ** indicates differences (p < 0.05, p < 0.01) between SHRs and WKYs p < 0.04, p < 0.015, p < 0.01 - indicate differences between the juvenile and maturing rats of the same strain.
3.5 Protein–protein interaction (PPI)The evaluation of the protein–protein interactions (PPI) network analysis showed that it contained 12 nodes and 29 edges (Table 1); each node represented a target (immune, oxidative stress and metabolic markers), and each edge represented correlation evidence between 2 targets. The thickness of the edges representing the interacting proteins varies based on the combined confidence score for the protein association from the low 0.150 to the highest 0.900. All connected noodles indicated direct or indirect interactions between the 14 potential targets with 528 biological processes (BP) significantly enriched. The only 14 revalent BP connected with neurodevelopment and behavior were selected (p < 0.05; Supplementary Table S1; Figure 7; Supplementary material 4). The complete analysis found 100 reference publications (PubMed), 8 clusters of local networks (STRING) and 70 Reactome pathways.
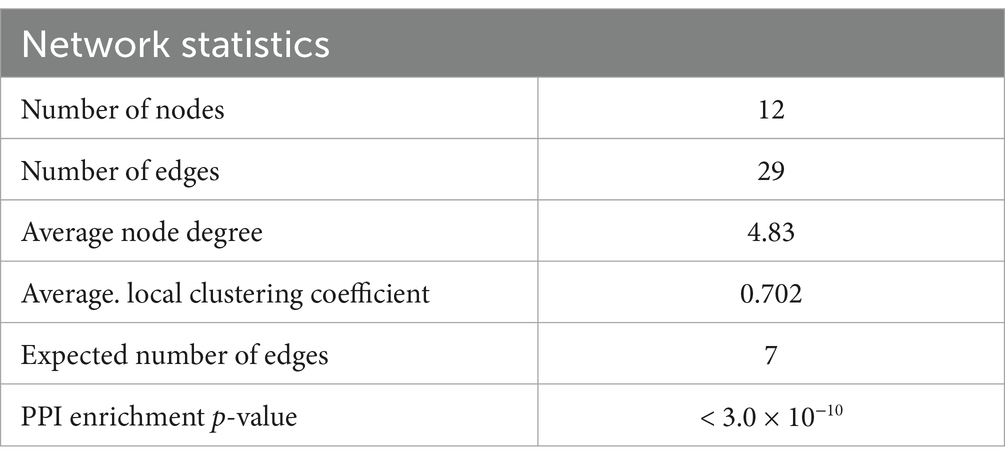
Table 1. Network statistics and biological process (Gene Ontology) of the interactions.
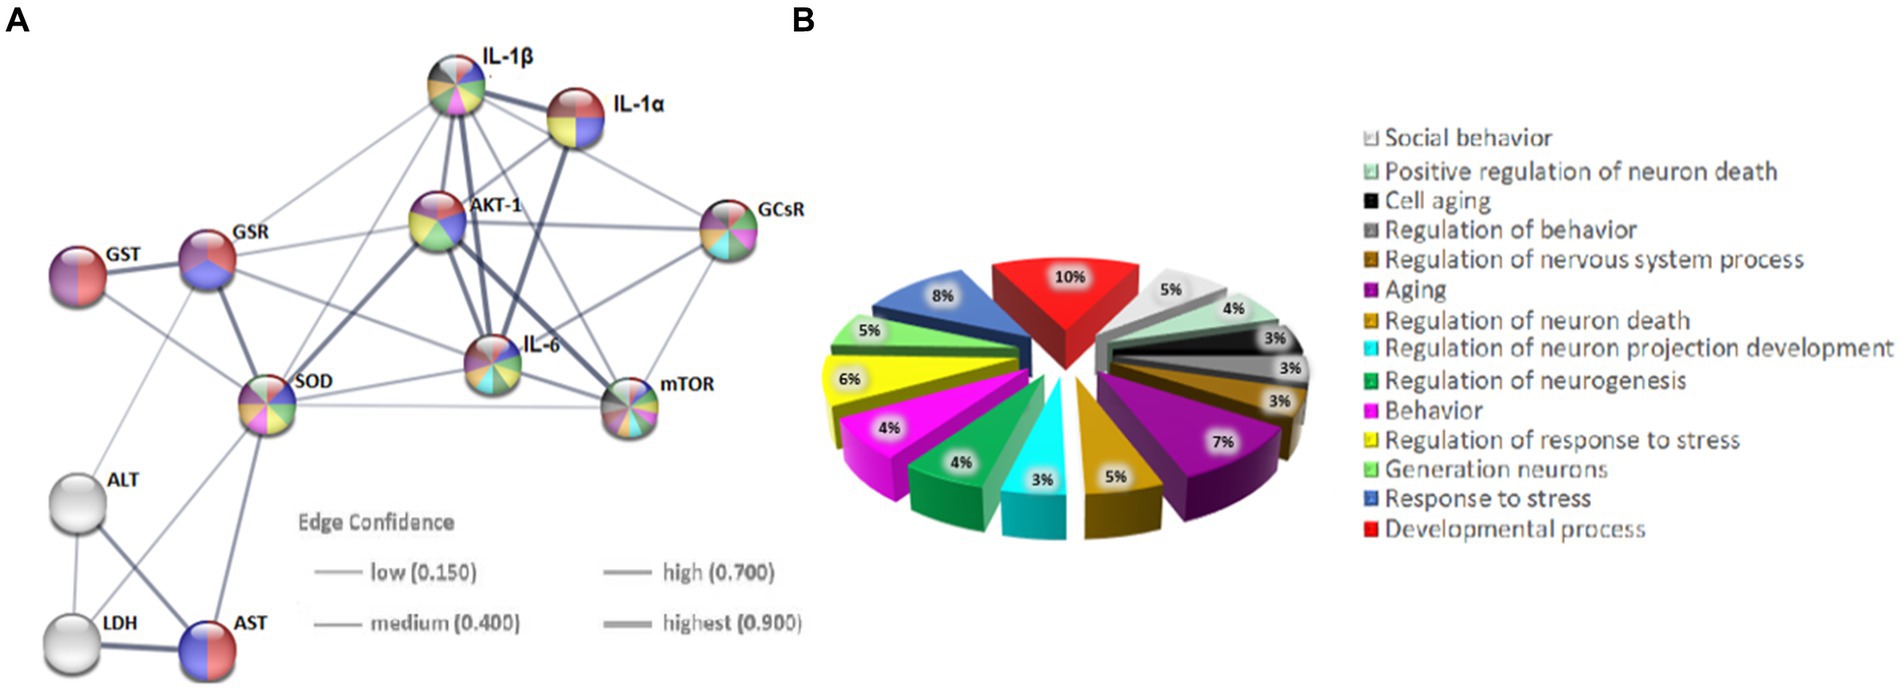
Figure 7. Protein–protein interaction (PPI) networks of potential targets in the STRING base (Rattus norvegicus). (A) The PPI network of 12 potential targets contains 12 nodes (proteins) and 7 edges (protein–protein associations). The thickness of the lines is in proportion to the confidence of the edges. (B) Pie chart of terms associated with neurodevelopment and behavior. Each color represents a specific biological process; note that the markers studied are implicated in these processes.
4 DiscussionThe current investigation reveals significant delays in the maturation of the motor cortex (MC) regions and delayed neuronal differentiation within this structure in an animal model of ADHD development. Additionally, the observed morphometric abnormalities in this brain region were accompanied by disturbed homeostasis in immunological, oxidoreductive, and metabolic aspects within the prefrontal cortex (PFC) - a functionally and histologically distinct structure that collaborates with the MC to ensure effective motor control and coordination.
4.1 Motor cortex alternationsThe present study reveals morphological abnormalities in the M1 and M2 regions of SHRs, with significant volume reductions observed at almost all ages. Detailed volumetric measurements of specific MC areas in SHRs have not yet been conducted. Similar changes were noted in our previous studies on other brain regions involved in motor activity, such as the PFC and striatum. Earlier reports also have shown reduced total volume of MC areas (equivalent to M1 and M2 in rodents) in children with ADHD (Castellanos et al., 2002; Kates et al., 2002; Mostofsky et al., 2002; Carmona et al., 2005; Batty et al., 2010) and adults (Proal et al., 2011).
It is noteworthy that Batty et al. (2010) reported a cortical thickness developmental trajectory in ADHD patients that appears to be similar to the observed in the presented study, considering age-related rat-human comparisons (Quinn, 2005). Additionally, our study finds more severe MC alternations in the right hemisphere, consistent with prior research brain structures linked to movement in SHRs (Hsu et al., 2010; Kozłowska et al., 2019b; Yang et al., 2021) and ADHD patients (Mostofsky et al., 2002; Almeida et al., 2010).
In addition to the observed changes in MC volume in SHRs, our study reveals a distinct pattern of neuron distribution in this brain area of SHRs compared to WKY over the studied lifespan. Specifically, the results demonstrate a decrease in neuronal density in most layers of M1 and M2 in juvenile SHRs (between 4 and 6 weeks of age). This indicates delayed maturation of these areas, consistent with observations previously reported in children with ADHD (Shaw et al., 2007, 2012). Comparing the presented results with existing data is challenging due to the limited literature on this topic. Confirmatory evidence showing reduced gray matter (GM) density in this brain region can be found in the study by Ashtari et al. (2005), which revealed lower Fractional Anisotropy (FA) in the MC of children with ADHD. Reduced neuronal density and deficits in GM in the MC area may cause complex disruptions in the anatomical organization large-scale brain networks (Griffiths et al., 2016; Wang et al., 2020), as reflected in studies of children with ADHD, who exhibited significantly reduced functional connectivity, particularly in prefrontal areas, including the MC (Gao et al., 2019; Wang et al., 2020).
This study demonstrates an increase in neuronal density during subsequent life stages of SHRs, culminating in significantly higher density in adult SHRs compared to age-matched WKYs. Interestingly, the observed increase in MC volume and the decrease
留言 (0)