
記住我


A semi-Markov model with a 1-month cycle developed for the UK in Microsoft Excel [17] was adapted to the SNHS; this method was chosen because of its ability to explicitly model the relationship between each health state. Based on the OlympiA randomized clinical trial (RCT) [13], the model compares two scenarios: HR+ and TN patients receiving olaparib for 1 year as adjuvant treatment versus standard of care (SoC) in 2022 (“watch and wait,” adding endocrine therapy in HR+ patients), in both arms of the model. The modeling of each receptor subgroup was considered as a separate analysis to provide greater flexibility in capturing the different patterns of long-term disease recurrence in patients with HER2−/HR+ and TN BC [18].
The adaptation was conducted from the SNHS perspective, and the time horizon (57 years) was patient lifetime. A 3% annual discount rate was applied to the costs as well as to the health outcomes as mentioned by the current Spanish recommendations [19]. Outcomes measured were survival, quality-adjusted life years (QALY), and costs associated with each scenario, estimating the incremental cost-effectiveness ratio (ICER) and the incremental cost-utility ratio (ICUR). According to the Spanish guidelines, a cost-effectiveness threshold between €25,000 and €60,000/QALY was considered [20, 21].
We reported our findings according to the Consolidated Health Economic Evaluation Reporting Standards (CHEERS) checklist, which is provided in the supplementary material (Table S1).
2.1 ModelSimulated patients were 43.2 years old with a mean weight of 68.7 kg and body surface of 1.71 m2 based on the baseline characteristics of OlympiA RCT [13]. Experts confirmed that these characteristics are similar to those of Spanish patients.
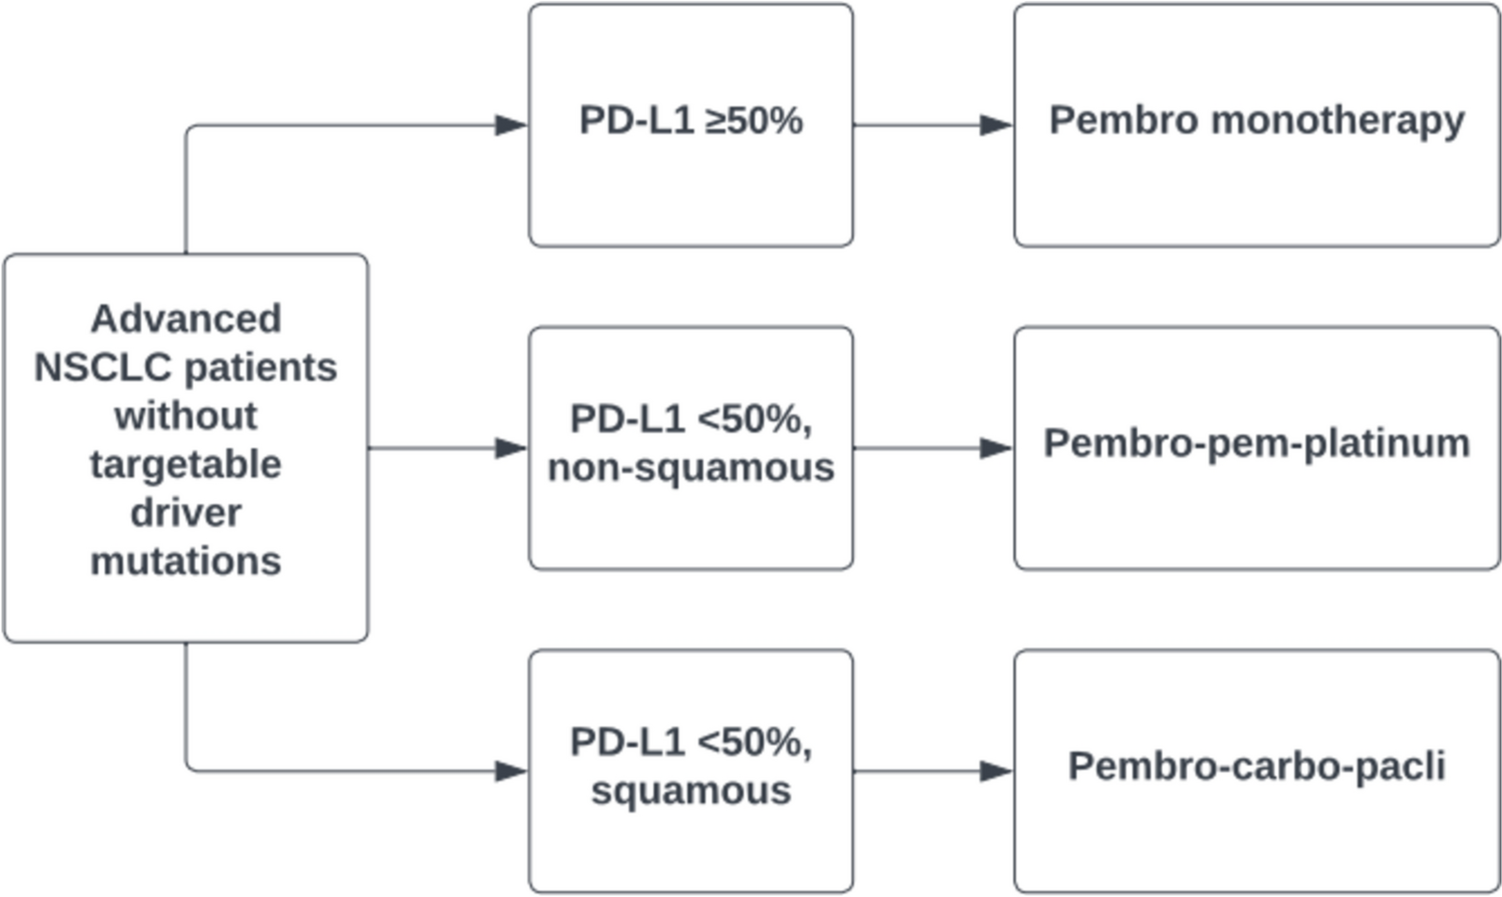
The model included five health states (Fig. 1): invasive disease-free survival (IDFS), nonmetastatic breast cancer (nmBC), early metastatic breast cancer (emBC), late metastatic breast cancer (lmBC), and death. The simulation initiated with patients in the IDFS state who had received surgery and neoadjuvant or adjuvant chemotherapy and who may progress to nmBC, metastatic BC (early or late), or death from any cause. As the progression of the disease is an irreversible process, patients in the nmBC, emBC, and lmBC state could not return to the IDFS state. Patients who enter the nmBC state could remain in this state until they experience distant metastasis or die. Finally, patients with TN who experience distant metastatic recurrence during the first 2 years, after completing local treatment, enter the emBC state [22]. In the case of HR+, according to the Spanish clinical practice, patients enter the emBC state when recurrence occurs within the first 5 years after completing local treatment and, in the lmBC state, when it occurs after the first 5 years [23]. From the metastatic states, patients progress to the death state. The transitions between the different health states in both the olaparib arm and SoC were modeled after the survival curves observed in the OlympiA RCT [13], except from the lmBC health status where, due to a lack of sufficiently mature data from OlympiA, the OlympiAD (the only RCT with similar characteristics to the study population in the OlympiA RCT where survival in this health status was studied) study was used [24, 25].
Fig. 1
Structure of the semi-Markov model. BC breast cancer
2.2 Data SourcesA targeted literature review was performed to obtain data on patients with early HER2neg and gBRCA1/2m BC. Clinical practice guidelines, Medline/PubMed, Embase, and MEDES databases were consulted. The search was focused on the loss of QALY due to adverse events, utilities during the different health states, treatments given in early BC and during recurrent phases, first- and second-line treatments’ distribution, and medical consultation and tests. Spanish and European (if national data are not available) studies were prioritized. All data used in this study were discussed and validated, during an online meeting, by a Spanish expert group composed of two medical oncologists specialised in BC and a hospital pharmacist during an online meeting. In those cases where there was a disparity of opinions, a discussion was held among the experts until a consensus was reached.
2.3 EfficacyAll clinical data were extracted from the OlympiA RCT [13] and OlympiaAD RCT [24, 25]. Following the recommendations on multistate modeling described by the National Institute for Health and Care Excellence (NICE) and by Putter et al. [26, 27], statistical distributions were used to simulate long-term patient survival, which were fitted to the patient-level data from the OlympiA RCT [13]. The best-fitting distribution (exponential, Weibull, log-normal, log-logistic, Gompertz, and generalized gamma), using the Akaike information criterion [28], was determined. The IDFS (Fig. S1), survival curve for nmBC (Fig. S2), and OS curves for the lmBC (Fig. S4) were simulated through a log-normal distribution, while the OS for nmBC and emBC (Figs. S3 and S4) were simulated using an exponential. IDFS was modeled using data from the intention-to-treat (ITT) population in both the HR+ and TN patient subgroups as no differences were observed between the ITT population and the hormone receptor status in the OlympiA RCT, and neither was there heterogeneity in treatment effect across subgroups [13]. Furthermore, the simulations were performed using patient-level data from the second interim analysis of the OlympiA RCT [13].
The mortality rate in patients who occupied the IDFS state was estimated using the mortality rate of the general Spanish population [29] adjusted by age and sex using the OlympiA data and applying the gBRCAm excess mortality risk [13]. Excess mortality risk was modeled using a mortality hazard ratio of 1.46, based on excess mortality from other diseases in women younger than 50 years old and who are gBRCAm carriers [30]. In addition, according to the local expert validation and in line with previous studies, any patient who remained disease-free at 5 years for TN and 20 years for HR+ was considered a long-term survivor and was not expected to experience recurrence of disease. These patients remained in the disease-free state until death from other causes [18, 31, 32].
2.4 Resource UseThe model included the following healthcare resources: treatments (surgery, radiotherapy, and pharmacological treatment) corresponding to each category of patients included in the model (nmBC, early and late mBC), adverse events, resources used for monitoring patients, medical tests, consultations, and palliative care. Only high-frequency severe adverse events (grades 3 and 4) were considered (Table S2). Finally, information regarding medical tests and consultations were obtained from Spanish clinical practice guidelines (Table S3) and validated by a group of experts to represent the real-life current patient management in Spain.
2.5 CostsAll costs were expressed in 2023 euros and were updated using the consumer price index (CPI) for medicine [33]. Drugs costs were obtained from the Spanish database Botplus (Table S4), and the unit costs of administration, visits, and medical tests reflected the median value of the unit costs for Spanish Autonomous Communities.
List prices were extracted for each drug and discounted by the Royal Decree Law (RDL) 8/2010 [34]. The monthly cost of olaparib for the treatment of patients with early BC after (neo)adjuvant chemotherapy was estimated considering a daily dose of 600 mg for 30.4 days [35]. Distribution in first- and second-line treatments for metastatic and nmBC was considered as well to reflect the current clinical practice in Spain (Table S5).
Unit costs of administration, oncology visits, and medical tests reflected the median value of the unit costs for all Autonomous Communities in Spain (Table S3). Administration costs were also calculated, using the administration cost per minute in day hospital (€0.57) and the duration of administration of each intravenous drug, adding an additional half hour for preparation and observation of the patient (Table S6). The percentage of patients that need surgery or radiotherapy is presented in Table S7. Surgery and radiotherapy costs, collected from the literature, were €4674.21 and €7817.14, respectively [36]. Patients treated with olaparib require a monthly blood test that costs €4.49. Visits and medical tests costs are summarized in Table S3. Table S2 presents the adverse events frequency, their duration, and associated costs. No costs were attributed to lymphocytopenia as no source indicating this cost was found. Palliative care cost per patient (€3697.39) was obtained from a previously published study in Spain [37].
2.6 UtilitiesHealth state utilities values can be seen in Table S8. Utility related to the IDFS state was estimated from the EORTC QLQ-C30 of the OlympiA RCT to EQ-5D, by mapping using a published algorithm in patients with BC [38]. The utilities for nmBC and mBC (early and late) were obtained from previous studies based on the EQ-5D score [13, 38,39,40,41]. Disutility associated with adverse events were also considered (Table S8) [42,43,44,45]. In the absence of published studies quantifying the loss of quality of life due to these adverse events, no disutility was associated with injection site reactions, irregular menstruation, and lymphocytopenia.
2.7 Sensitivity AnalysisTo demonstrate the robustness of the model, both deterministic sensitivity analysis (DSA) and probabilistic sensitivity analysis (PSA) were conducted. In addition, a scenario analysis was also performed.
The DSA included the most sensitive parameters [age TN patients (standard error [SE] 0.258); age HR+ patients (SE 0.545); weight (SE 0.384); resource use and adverse events costs (±10%); frequency of adverse events (±10%) and utilities: invasive disease-free survival (SE 0.002), nonmetastatic breast cancer (SE 0.086); early metastatic breast cancer (0.072) and late metastatic breast cancer (0.054)], and the results were represented by a tornado graph. PSA included 1000 simulations, whether this number of simulations was sufficient was checked by means of a convergence analysis (Fig. S5). Parameters used for the PSA are presented in Table S9. The PSA results were shown using the cost-effectiveness planes and cost-effectiveness acceptability curves (CEAC).
Finally, the scenario analyses included the discount rate (according to the Spanish recommendations, varied to 0% and 5% [46]), the time horizon (30, 40, and 50 years), the time in which it is considered a late recurrence (TN: 1 and 3 years and HR+: 4 and 6 years), the time in which it is considered a long-term survivor (varies by ±20%; TN: 4 and 6 years; HR+: 16 and 24 years), utilities (different methods for estimating utility by health status: Longworth mapping [47], Paracha et al., 2016 (0.857) [39] and Lidgren et al., 2007 (0.779) [48]), and different statistical distributions were used to simulate long-term patient survival (exponential, Weibull, log-normal, log-logistic, Gompertz, and generalized gamma).
留言 (0)