
記住我


Examining shifts in the intricate mechanisms of regulatory programs across seven stages of neural differentiation necessitated designing a systematic procedure to generate E-P-INs. Our E-P-INs are highly modular bipartite graphs populated with communities of enhancers and promoters; edges represent interactions between these elements. These networks were designed for cross-condition comparability, referencing the same atlas of enhancers and promoters (see the “Methods” section). Our E-P-INs capture the temporal programs of gene regulation within our seven time points exclusively. Ubiquitous CREs that are unchanging across time points were removed during filtration.
Eight E-P-INs were created using the ABC model: seven time point-specific networks and a single collapsed E-P-IN containing all edges found across these time points. Here, we report statistics from the collapsed network to summarize the structures of the seven time point-specific E-P-INs. Our E-P-INs contained 3,133 unique promoters and 1628 enhancers. This suggests that most interactions in these E-P-INs, consisting of differentially active and temporal CREs, involve multiple genes regulated through a single enhancer, with an average of 1.92 genes regulated through a single enhancer. The mean length of enhancers in our E-P-INs was 1047.83 bps; this aligns with previous literature [1, 9]. Examining sample composition, we found consistent interactions within our time point-specific networks. The smallest E-P-IN (48 h) contained 2134 interactions, totaling 13.02% of our collapsed network’s edges. The largest E-P-IN (24 h) included 15.68% of edges in the collapsed network, amounting to 2569 unique enhancer-promoter links. Additional file 2: Tab. S1 in “Supplementary information” contains our time point-specific and collapsed E-P-INs.
Enrichment in neural differentiation signalsInitial investigations of our E-P-INs showed characteristics relevant to early neural differentiation through enrichment and temporal analyses. Our E-P-INs demonstrated enrichment for biological processes pertinent to the cellular context and temporal changes from the start of neural induction to the 72-h time point.
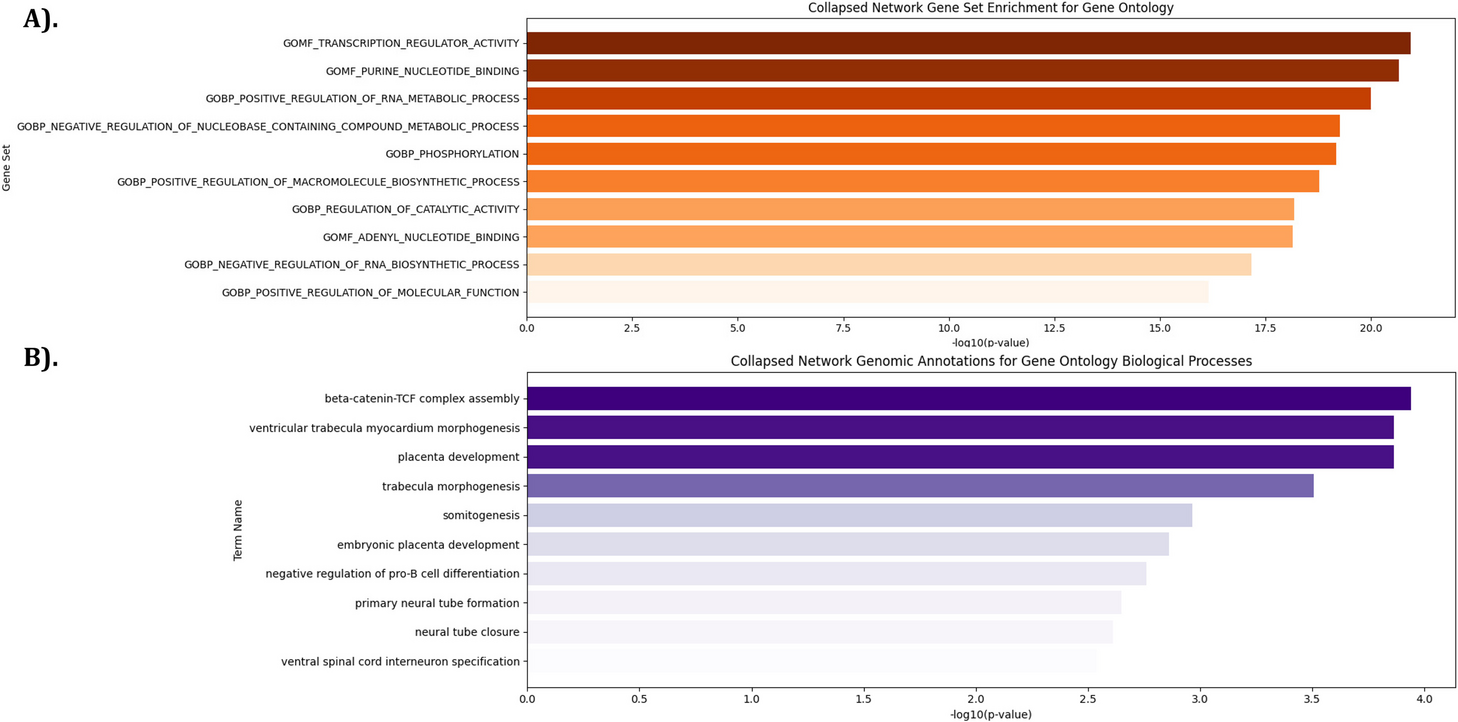
Gene Set Enrichment Analysis (GSEA) was performed utilizing the 500 most frequently occurring promoters from each E-P-IN [10]. The Genomic Regions Enrichment Annotations Tool (GREAT) was used to examine enrichment in our enhancer regions [11, 12]. See the “Methods” section for an in-depth explanation of GSEA and GREAT’s methodologies. We report the results from our collapsed E-P-IN for brevity; time point-specific results are available in Additional file 3: Tab. S2 and Additional file 4: Tab. S3 in “Supplementary information”. The most significant results from GSEA and GREAT are reported in Fig. 1A and B, respectively. “GOMF_TRANSCRIPTIONAL_REGULATOR_ACTIVITY,” “primary neural tube formation,” and “ventral spinal cord interneuron specification” are examples relevant to neural differentiation. We note that GSEA results relate to transcription due to the number of promoters being tested and their recurrence across the networks. GREAT considers all enhancers in our E-P-INs. A concentrated GSEA testing set contributes to the difference in statistical magnitudes between GSEA and GREAT. These findings support our E-P-INs’ biological relevance.
Fig. 1
Enrichment analyses demonstrate the E-P-INs’ abilities to capture neural differentiation. A GSEA outcomes from the collapsed network’s 500 most occurring promoters reveal biological processes, cellular components, and molecular functions essential to transcriptional regulation. B GREAT outcomes detailing enhancer enrichment show biological processes related to cell differentiation and neural development
Next, Jaccard similarities between the CREs (i.e., enhancers and promoters) and enhancer-promoter interactions (E-P-Is) were computed to compare our seven time point-specific E-P-INs. Figures 2A, B, and C present Jaccard similarities in enhancers, promoters, and E-P-Is, respectively. Here, we show that these networks become more dissimilar with time. Additionally, this analysis revealed that time points before 48 h show high similarity compared to our 48-h and 72-h E-P-INs; these latter networks also show close resemblance. These results indicate our E-P-INs exhibit temporal trends of neural differentiation.
Fig. 2
Temporal analysis revealed the E-P-INs exhibit changes related to neural differentiation. A Jaccard similarities detail the overlap between sets of promoters across our seven time point-specific networks, with clustered formation in the earliest five time points. B Jaccard similarities detailing differences in time point-specific sets of enhancers reveal temporal trends similar to those described for promoters. 2C) Jaccard similarities demonstrating changes in the E-P-Is across neural differentiation. Instances where an enhancer-promoter interaction changes across E-P-INs show more temporality than examining the presence/absence of either enhancers or promoters deemed dynamic
Clustering reveals regulatory substructuresWe identified four distinct substructures defining the modes through which enhancers regulate genes. Here, Girvan-Newman clustering was utilized to partition our bipartite graph into distinct communities [13]. The highly modular nature of our E-P-INs informed this approach, as enhancers and promoters tied together through gene regulation formed dense clusters in our networks. Figure 3 provides a graphical representation of our collapsed E-P-IN to illustrate the formations of these substructures. Substructures fall into two distinct classifications: redundant (R) and non-redundant (NR). The four substructures are a single enhancer regulating a single gene (1NR; Fig. 3A), multiple enhancers regulating a single gene (1R, Fig. 3B), a single enhancer regulating multiple genes (2NR; Fig. 3C), and multiple enhancers regulating multiple genes (2R; Fig. 3D). Additional file 1: Fig. S1 in “Supplementary information” contains a full view of our collapsed E-P-IN [14].
Fig. 3
Graphical representations demonstrate the composition of gene regulatory substructures. A offers an example of a 1NR substructure. B shows a community of E-P-Is characterized as 1R. C demonstrates the 2NR substructure. D depicts a cluster labeled as 2R
We implemented this clustering approach for each of the seven time point-specific E-P-INs and the collapsed E-P-IN. Figure 4A shows the four distinct substructures as a legend, and Fig. 4B displays the substructure distribution in the seven time point-specific E-P-INs, calculated by dividing the total number of communities by the number of communities allocated to each specific substructure. This distribution remains consistent, with slight fluctuations, across our seven time points. The 1NR and 2NR substructures constitute the majority of our time point-specific networks, averaging 81.9% composition across the seven E-P-INs. This skew towards NR substructures stems from the dynamic and temporal filtering used to reconstruct the networks.
Fig. 4
Substructures across the seven time point-specific E-P-INs demonstrate minimal temporality. A is a legend that links substructures to their appropriate section on the chart. B shows the distribution of substructures across the seven time point-specific and collapsed E-P-INs. Redundant substructures comprise a smaller portion of these networks than those non-redundant
We calculated average counts of enhancers, promoters, and E-P-Is in these regulatory substructures using our collapsed E-P-IN. In 1R communities, an average of 2.16 enhancers regulate a single gene; in 2NR communities, 3.29 genes, on average, are regulated through a single enhancer. Interestingly, the 2R substructure is denser, averaging 2.55 enhancers, 4.57 genes, and 7.72 E-P-Is per community. Additional file 1: Fig. S2 compiles histograms showing the distribution of these values. Our investigations could not reveal significant links between gene expression and a promoter’s number of edges with enhancers.
Enrichment for disease-associated variantsWe hypothesized that our time point-specific E-P-INs would exhibit enrichments associated with neurodevelopmental and neuropsychiatric disorders [15]. Utilizing datasets containing 250,000 de novo autism spectrum disorder (ASD) single nucleotide variants (SNVs) from both patients (cases) and healthy siblings (controls) [16], 817 ASD-associated genes, 252 developmental delay-associated genes (DD) [17], and 34,914 GWAS-sourced SNVs from neurological/neuropsychiatric disorders (i.e., schizophrenia (SCZ), bipolar disorder (BD), major depressive disorder (MDD), Parkinson’s disease (PD), and Alzheimer’s disease (AD)), we implemented a permutation test to quantify an empirical p-value signifying enrichment; our null distribution in these permutation tests was the ABC model’s unfiltered outputs. Eight tests were employed on each E-P-IN: ASD-associated SNVs, ASD-associated genes, DD-associated genes, SCZ-associated SNVs [18], BD-associated SNVs [18], MDD-associated SNVs [19], PD-associated SNVs [20], and AD-associated SNVs [21].
With the significance threshold set at an empirical p-value = 0.05 and 1000 permutations ran, five of our eight categories demonstrated significant enrichment in our E-P-INs: ASD-associated genes and SNVs, DD-associated genes, and SCZ-associated and BD-associated SNVs. Additional file 5: Tab. S4 in “Supplementary information” contains a complete overview of the statistics for disease-associated variant enrichment. MDD-associated SNVs, PD-associated SNVs, and AD-associated SNVs were deemed non-significant. These findings suggest our E-P-INs capture enhancers relevant to neural differentiation; SCZ and BD are disorders with neurodevelopmental origins [22, 23]. Out of the 1592 enhancers considered in our collapsed E-P-IN, 140 contain either a case or control de novo variant for ASD, with case variants favored; 27 contain a GWAS-sourced SNV for a neurological/neuropsychiatric disorder. Of 3133 genes, 208 are associated with ASD, and 41 are associated with DD. ASD was the most significantly enriched among diseases/disorders, with a p-value < 0.001 in examinations of associated SNVs and genes. Figure 5A depicts the results of the ASD-associated de novo SNV permutation test, while Fig. 5B presents the ASD-associated gene permutation test results. Further confirming the enrichment of ASD, we devised an additional permutation test, utilizing the dynamic and temporal E-P-Is as the null distribution. We found that ASD-associated genes demonstrate significant interaction with enhancers containing an ASD-associated SNV, computed at an empirical p-value < 0.001. ASD enrichment arises from a common set of genes and SNVs across our seven time point-specific E-P-INs. Additional file 1: Fig. S3 in “Supplementary information” shows Jaccard similarities between sets of ASD-associated CREs in our networks.
Fig. 5
ASD enrichment across E-P-INs is substantial. A demonstrates significant enrichment for ASD-associated de novo SNVs in the collapsed network. B details the enrichment of ASD-associated genes, showing permutation test outcomes. C displays the number of communities within each substructure containing ASD-associated variation. The communities with variants are shaded red at the start of each substructure’s bar. D provides an example of a predicted enhancer region, binding ASD-associated TFs CHD2 and ZNF219, that regulated CHD8, SUPT16H, and RAB2B. Clinical reports provide cases where a mutation in chromosomal region 14q11.2, the location of this enhancer, involved these genes and caused ASD
We mapped our ASD-associated de novo SNVs to the communities created with the Girvan-Newman clustering algorithm [13]. The distribution of SNVs was consistent with that of substructures in our E-P-INs; 8.42% of 1NR communities contained variation, 10.34% of 1R communities, 10.15% of the 2NR communities, and 15.75% of 2R communities. Figure 5C details the number of communities in each substructure that contain ASD-associated variants. Prior research has suggested enhancer redundancy as a counteracting mechanism to variation that would disrupt gene transcription [24]. Figure 5D gives an example of the susceptibility of non-redundant substructures, illustrating a case where an ASD-associated SNV fell within a predicted enhancer (chr14:21,993,966–21,995,169). Both TFs, ZNF219 [25] and CHD2 [26], have been previously found to be associated with ASD in transcriptional regulatory networks of neural differentiation through investigation of SNVs affecting the development of the disorder. ZNF219 and CHD2 were selected from a group of motif-predicted TFs. The enhancer regulates three genes (i.e., CHD8, SUPT16H, and RAB2B); these genes have been linked to ASD through differential expression, clinical variant analyses, and gene knockouts, respectively [27,28,29]. Mutations in chromosomal region 14q11.2, where the predicted enhancer is located, have been shown to involve these genes and cause ASD [30, 31].
Validating enhancers with transcription factor overexpressionIntegration of TF data into our seven time point-specific networks enabled us to begin verification of E-P-Is and gain a more in-depth understanding of these enhancers’ role in gene regulation [32].
First, we used Find Individual Motif Occurrences (FIMO) [33] with motifs from ENCODE [34] and JASPAR [35] databases to find TFs predicted to bind to the sequences of our enhancers. Our p-value threshold for FIMO was 1e-5. Previous studies suggest that tens of TFs can bind to an enhancer [1]; this was in line with our findings. Enhancers in our E-P-INs averaged 12.30 unique TFs bound to them. Examining our original non-dynamic network, produced with the ABC model prior to the robust filtration process reported in “Reconstructing Enhancer-Promoter Interactions with Multi-omics Datasets” used to generate E-P-INs, we found a decrease in the number of unique TFs per enhancer (7.33). In total, 1183 unique TFs were predicted in our E-P-INs using FIMO. Next, we examined which TFs were more commonly predicted to bind to our enhancers; returning to our ABC network prior to filtration, CTCF was predicted to bind to the largest number of enhancers. Differing in our dynamic E-P-INs, SP9, a TF necessary for neuronal development [36], was the most common. SP9 binds to 1222 of the 1628 enhancers in our time point-specific networks.
Previously, we overexpressed TFs (i.e., BARHL1, IRX3, LHX5, OTX1, OTX2, and PAX6) [7] followed by RNA-seq in later-stage hESC-derived NPCs to detect their target genes. Using DESeq2 for differential expression analysis [37], we determined which genes were significantly affected following a TF’s overexpression. Using these results, we investigated whether enhancers predicted to bind these TFs regulated the differentially expressed genes (DEGs) downstream; downregulated DEGs were not considered in this analysis (see the “Methods” section). Using Fisher’s exact test, p-values were assigned to each TF-binding enhancer, quantifying their relation to the overexpressed TF’s regulon. We found enhancers predicted to bind each of the six overexpressed TFs where a substantial proportion of downstream promoters regulate DEGs. Here, the false discovery rate (FDR) values of the most significant enhancers are reported per TF: BARHL1 = 4.2e − 8, IRX3 = 1.8e − 4, LHX5 = 1.1e − 3, OTX1 = 4.9e − 2, OTX2 = 2.7e − 2, PAX6 = 1.0e − 6. A statically significant presence of downstream DEGs supports motif predictions from FIMO in these enhancers. In addition to this analysis, we designed a permutation test to determine if the proportion of downstream DEGs in enhancers predicted to bind overexpressed TFs was different than in enhancers that are not. Upregulated and downregulated DEGs were examined together. We found that all TFs scored an empirical p-value < 0.001.
PAX6 overexpression is sufficient to induce hESCs into neural lineage [38]. We report an additional enhancer (chr16:30,669,227–30670310) predicted to bind PAX6 here. This enhancer’s targets in our E-P-IN are enriched with DEGs downregulated during PAX6 overexpression. Only PHKG2, one of nine targets for this enhancer, was upregulated during PAX6 overexpression. In the PAX6-binding enhancer found to have a significant proportion of upregulated DEGs downstream (chr19:17438298–17439337), DDA1 was the sole downregulated target DEG. This suggests a pattern of enhancers regulating directional gene sets and a possible method of examining TF antagonism [39]. Figure 6A details the permutation test outcomes from PAX6. Figure 6B illustrates the most significant TF-binding enhancer predicted to bind PAX6 when examining upregulated DEGs.
Fig. 6
Enhancers predicted to bind PAX6 more commonly regulated DEGs when PAX6 is overexpressed. A shows outcomes from permutation testing supporting the claim that enhancers binding PAX6 regulate DEGs more often than enhancers without PAX6 motifs. B details an enhancer region predicted to bind PAX6 that regulates upregulated DEGs. Genes shown in lighter colors are DEGs when PAX6 is overexpressed
Validating enhancers with massively parallel reporter assaysIn MPRAs, a synthetic construct, each comprising a candidate regulatory DNA sequence, a minimal promoter, and a unique transcribable DNA barcode, is introduced into cells; these candidates are assumed to be able to regulate the transcription of these barcodes. Following this insert, RNA and DNA sequencing are performed to evaluate each barcode’s RNA-to-DNA ratio [40]. MPRAs allow us to measure the activity of thousands of regulatory sequences at once. We used our previously collected perturbation MPRA datasets [7, 41, 42] to validate our predicted enhancers. Perturbation MPRA is a strategy for demonstrating the regulatory effects of TF-binding motifs. Here, nucleotides in a motif are randomly scrambled. We then analyze the change in regulatory activity of the DNA sequence being tested to see the effects of TF binding [42]. As perturbation MPRA facilitates the measurement of changes in transcriptional activity based on a sequence’s inclusion of a TFBS, we choose to use this dataset for this analysis. We examined E-P-IN enhancers for strict MPRA overlap, creating a subsetted network. This consolidated E-P-IN allowed for an in-depth investigation into TFs, as we computed a novel metric for TF × TF correlation using enhancer binding, genes regulated downstream, and time point-specific function.
Our subsetted MPRA-based E-P-IN had strict inclusion criteria for edges. A functional MPRA-tested sequence had to intersect each included enhancer. Additionally, these sequences also needed to perturb a TF that matched a FIMO-predicted motif for that enhancer (see the “Methods” section). This E-P-IN contained 45 enhancers and 82 promoters, a ratio comparable to the collapsed E-P-IN (1.82 to 1.92). Applicable edges matching the E-P-INs’ criteria were found more often at some time points. A total of 195 edges in the 6-h network matched, while only 69 in the 72-h E-P-IN were found.
We devised a permutation test to investigate whether MPRA-validated enhancers were significantly enriched in our temporal, dynamic networks (see the “Methods” section). Using the ABC model networks as the null distribution, we computed an empirical p-value < 0.001 from 1000 permutations, showing that proven enhancers are more common in networks of E-P-Is after our filtration methods are utilized.
We devised a TF × TF correlation metric, incorporating enhancers that these TFs are predicted to bind, genes they regulate downstream, and the time points at which the TFs are functional. The metric is based on Jaccard similarities; scores between 0.0 and 1.0 are created for the three components that were previously mentioned. Additional file 6: Tab. S5 contains matrices for these component-specific scores and our TF × TF metric. Figure 7 shows a heatmap of similarity scores subjected to hierarchical clustering to reveal groups of correlated TFs. TF families, such as the NKX-homeodomain TFs [43] and IRF TFs [44], cluster together, supporting our approach’s ability to reveal TFs working in tandem. Analyses were performed on our MPRA-subset networks to provide interpretable results, detailing a group of enhancers binding TFs validated using experimental methods.
Fig. 7
TF × TF matrix, stylized as a heatmap and organized using hierarchical clustering, displays our Jaccard-based similarity metric for transcription factors in our subsetted E-PN derived from MPRA datasets
留言 (0)