
記住我


We searched published literature, preprints, and the Gene Expression Omnibus (GEO: https://www.ncbi.nlm.nih.gov/geo/) for RNA sequencing datasets generated from experiments designed to measure differential gene expression after Cas9-mediated knockout of a gene of interest. We used the following search terms: “CRISPR/Cas9” or “CRISPR-Cas9” and “RNA-seq.” We focused our search for publicly available data on the GEO RNA-seq Experiments Interactive Navigator (GREIN). GREIN contains processed data from thousands of GEO entries with human, mouse, and rat RNA-seq samples using a common pipeline for alignment, quality control, and transcript quantification [87]. In GREIN, we used search terms “CRISPR/Cas9” or “CRISPR-Cas9.” Based on these search results, we manually checked the experimental designs of more than 200 publicly available RNA-seq experiments. We only considered experiments in which (1) there was CRISPR/Cas9-based knockout of the target, in which the stated strategy was not to target intergenic regulatory sequences, (2) annotated matched control samples treated with non-template control gRNA, and (3) multiple replicates of both targeted and control RNA-seq samples. We prioritized studies with multiple knockout targets, which enabled us to check for the presence or absence of paralog upregulation for as many targets as possible. For the few non-GREIN datasets included here, we only considered studies that provided mapped read counts per gene ID or, optimally, also provided processed differential gene expression calculations. Ultimately, we found 36 studies with datasets meeting inclusion criteria described above, described in Additional File 1: Table S1 [14, 48, 50, 58, 88,89,90,91,92,93,94,95,96,97,98,99,100,101,102,103,104,105,106,107,108,109,110,111,112,113,114,115].
Identification of paralogs of knockout targetsFor bulk RNA-seq datasets, we queried the Ensembl database version 110 for paralogs of knockout targets, using Ensembl REST API (Version 15.6) [47]. We searched by Gene Symbol, and extracted paralogs of all returned Ensembl IDs. We extracted both gene identifiers and Ensembl-annotated coding sequence overlap percentages between knockout targets and each of their paralogs. Ensembl gene IDs were then converted to standardized gene names using g:Profiler (Version e109_eg56_p17_1d3191d) [116]. For Perturb-seq data from [52], we used the BiomaRt package v2.40.5 in R v3.6.1 to search Ensembl version 105 for paralogs, searching by Gene Symbol and extracting all returned paralog Gene Symbols [117].
Differential gene expression assessmentWe wanted to identify differentially expressed genes across the dozens of knockout samples we reanalyzed. We used DESeq2 for differential expression analysis [118]. When available, we used author-provided gene expression change calculations based on DESeq2 (for results from [58]). For all remaining datasets, for which DESeq2 results were not already available, the authors did provide mapped count data on GEO and/or they were available on GREIN. For these count-based results, we implemented DESeq2 ourselves, using the PyDESeq2 package, using default settings, comparing knockout samples against the matched controls from their respective studies [119].
For these studies, we implemented filters to consider knockout targets that we would a priori expect to have some detectable loss of gene dosage that would need to be compensated for by transcriptional adaptation. We first confirmed that the average library size of considered samples was at least approximately 1 million reads per sample. We then included genes only if they were expressed at a level of 10 raw counts or higher across all samples. We chose to classify paralogs as upregulated if DESeq2 reported an adjusted p-value ≤ 0.05 and a log2 fold-change ≥ 0.5. In supplementary analyses, we also show results when paralogs are classified as upregulated using either (1) only the adjusted p-value ≤ 0.05 filter or (2) adjusted p-value ≤ 0.05, log2 fold-change ≥ 0.5, and basemean ≥ 10 filters. The final analysis included all knockout target genes with any significant paralog differential expression, up or down, irrespective of log2 fold-change.
Checking for genomic regulatory feature association with paralog upregulationWe downloaded annotated associations between human enhancer or promoter elements and human genes from the GeneHancer v5.19 database (https://www.genecards.org/Guide/DatasetRequest, last accessed April 4, 2024). We converted gene identifiers to GeneCards IDs using gprofiler2 in R. We mined the GeneHancer database for associations between enhancers or promoters and genes. For assessment of paralogs only, we considered all knockout target-paralog pairs together. We checked for a difference in odds of paralog upregulation based on whether the paralog and CRISPR target shared any annotated enhancer or promoter using Fisher’s exact test in R. For the analysis of all genes, for each CRISPR target, we repeated the check of shared enhancers or promoters, and for each CRISPR target checked for a difference in odds of upregulation using Fisher’s exact test.
We downloaded annotated topologically-associated domains (TAD) coordinates in the hg19 human genome (http://dna.cs.miami.edu/TADKB/download/TAD_annotations.tar.gz, last accessed April 29, 2024). We considered annotated transcription start sites for any Ensembl transcript for each considered gene, identified using biomaRt, pulling from the February 2014 build of hg19. Consistent with the publicly accessible browser built by the authors of TADKB [60], we considered annotated TADs at 50 kb resolution called using the directionality index method, in any of the human cell types in the database. For each CRISPR target, paralog, or any other gene, we searched for annotated TADs overlapping any of their annotated transcription start sites. For the paralog analysis, we combined all paralog-target pairs together and checked for a difference in odds of paralog upregulation based on co-location in any TAD shared with the knockout target using Fisher’s exact test in R. For the analysis of all genes, for each CRISPR target, we repeated the check of overlapping TADs, and for each CRISPR target, we checked for a difference in odds of other-gene upregulation using Fisher’s exact test. For p-value adjustment, we used the Benjamini–Hochberg method in p.adjust() in R.
Gene expression correlation analysisFor human genes, we downloaded GTEx Analysis V8 median expression levels (in TPM) in each tissue from the GTEx portal on April 15, 2024 (GTEx_Analysis_2017-06-05_v8_RNASeQCv1.1.9_gene_median_tpm.gct.gz). For each pair of genes, one knockout target and one paralog, we plotted the median expression in each tissue of the respective species and calculated a Spearman correlation coefficient on log(TPM + 1). We then compared this correlation coefficient to the log2fold-change of the paralog as a check for association between cross-tissue average expression level correlation with the CRISPR target and whether a paralog displayed upregulation after CRISPR target knockout. We further calculated a Spearman correlation coefficient to check for association between the pairwise correlations and paralog log2(fold changes).
Estimation of expected frequency of paralog upregulation per knockout targetThe null hypothesis for analysis of paralog upregulation is that for any group of paralogs of a knockout target, the number of paralog genes upregulated after knockout is simply reflective of randomly selecting any similarly expressed genes in the dataset and checking whether they were upregulated. In order to check whether the paralog upregulation pattern observed for a particular knockout target was reflective of randomly selecting similarly expressed genes in the dataset (instead of the paralogs), we developed an algorithm for bootstrapping the null distribution of paralog upregulation frequency for each knockout target. For each knockout target, the algorithm is implemented as follows:
1.Rank order all genes in the dataset by basemean across all samples
2.For each paralog, randomly select a gene within 51 ranks
3.For each randomly selected similarly expressed gene, check the fold change after knockout and whether the gene qualifies as upregulated based on dataset-specific thresholds (in figure legends)
4.Count the number of upregulated randomly selected genes and divide by the total number of paralogs for a bootstrap sample of the paralog upregulation frequency
5.Repeat steps 2–4 10,000 times to build an empirical null distribution of the paralog upregulation frequency
6.To calculate a p-value, calculate the fraction of the empirical null distribution that is at least as large as the observed fraction of paralogs that are upregulated
Perturb-seq-based single-cell gene expression reanalysisWe wanted to identify possible changes in single-cell gene expression distributions after knockout of a library of CRISPR targets. Therefore, we reanalyzed Cas9-based pooled knockout single-cell RNA-seq, Perturb-seq, data from [52]. We downloaded published processed log-transformed UMI-based transcript quantification tables (in log(TPM + 1)) from https://singlecell.broadinstitute.org/, accession SCP1064, “Control” condition, last accessed June 15, 2023. For the main analysis, we only considered knockout targets with sufficient cells for a minimal quantitative analysis: a minimum of 2000 UMI per cell, at least 30 cells total, with no fewer than 5 cells annotated in any one of the three included targeting guide RNAs. In a supplementary analysis to identify lower-confidence targets with possible transcriptional adaptation, we considered removing the 30-cell and 5-cell filters. For transcript quantification, within each guide, we either counted the number of cells with non-zero expression and divided by total cells for that guide (for percent-positive), or we averaged expression levels over all cells for that guide (for mean). Within each gene within a given condition (nontemplate controls or targeted for a given gene), we averaged over all appropriate guides.
Regulon robustness analysisFor bulk RNA-seq data-derived regulon gene expression analyses, we focused on human and mouse transcription factors, as defined by the most recent version of AnimalTFDB3, last accessed November 21, 2023 [120]. We searched for overlapping regulons between a knockout target and the paralog gene of interest in DoRothEA, only considering downstream genes with annotation confidence level A, B, or C (out of a possible range of A-E, see original source for evidence level descriptions) [63, 64]. We compared regulon genes for transcription factor CRISPR target-paralog pairs in the bulk RNA-seq dataset that demonstrated possible transcriptional adaptation as defined by significant paralog upregulation frequency (p < 0.1, see the “Estimation of expected frequency” section, above). There were 68 annotated regulon genes across the four target-paralog pairs with transcriptional adaptation versus 138 annotated regulon genes for all target-paralog pairs without transcriptional adaptation. Regulon genes were considered differentially expressed if DESeq2 adjusted p-value < 0.05 and abs(log2FoldChange) > 0.5. We calculated a p-value between the groups of regulon genes using Fisher’s exact test, testing whether the odds of regulon gene differential expression were different between the transcriptional-adaptation and no-transcriptional-adaptation groups.
For Perturb-seq data-derived gene expression distribution analyses, we chose to focus on human transcription factor genes, as defined by the most recent version of AnimalTFDB3, last accessed July 28, 2023 [120]. We searched for overlapping regulons between a knockout target and the paralog gene of interest in DoRothEA, only considering downstream genes with annotation confidence level A, B, or C (out of a possible range of A-E, see original source for evidence level descriptions) [63, 64]. We compared regulon genes for transcription factor CRISPR target-paralog pairs in the Perturb-seq dataset that demonstrated possible transcriptional adaptation as defined by having a top-100 paralog, versus all pairs that that did not demonstrate transcriptional adaptation, as defined by both not having any top-100 paralogs and being a pair in the interquartile range of changes in paralog expression after knockout. There were 55 annotated regulon genes for the three target-paralog pairs with transcriptional adaptation versus 439 annotated regulon genes for all target-paralog pairs without transcriptional adaptation.
The average difference in expression of regulon genes in both groups was approximately zero, with a spread of values about that mean (Fig. 4B). In order to test for transcriptional adaptation-associated buffering of gene expression changes of regulon genes after CRISPR target mutation, we performed two checks for significance of a difference in the spread size between the two groups; a larger spread would indicate a larger number of extreme expression changes. The first test was an asymptotic test of difference in coefficient of variation for groups of unequal size, using the cvequality v0.1.3 package in R [121, 122]. The second test was a check of the plausibility of the null hypothesis that equal size samples from the transcriptional-adaptation and no-transcriptional-adaptation groups have the same standard deviation. We empirically downsampled (n = 49 with percent-positive < 75% in controls, of 55 total genes, same as transcriptional-adaptation group size) the no-transcriptional-adaptation group without replacement, 1000 times, to generate an empirical null distribution of sample standard deviations from the no-transcriptional-adaptation group. We then compared the observed transcriptional-adaptation group standard deviation to this distribution and observed that it was among the lowest downsampled values (Fig. 4G), suggesting that the transcriptional-adaptation group is unlikely to have a similar sample standard deviation to the no-transcriptional-adaptation group.
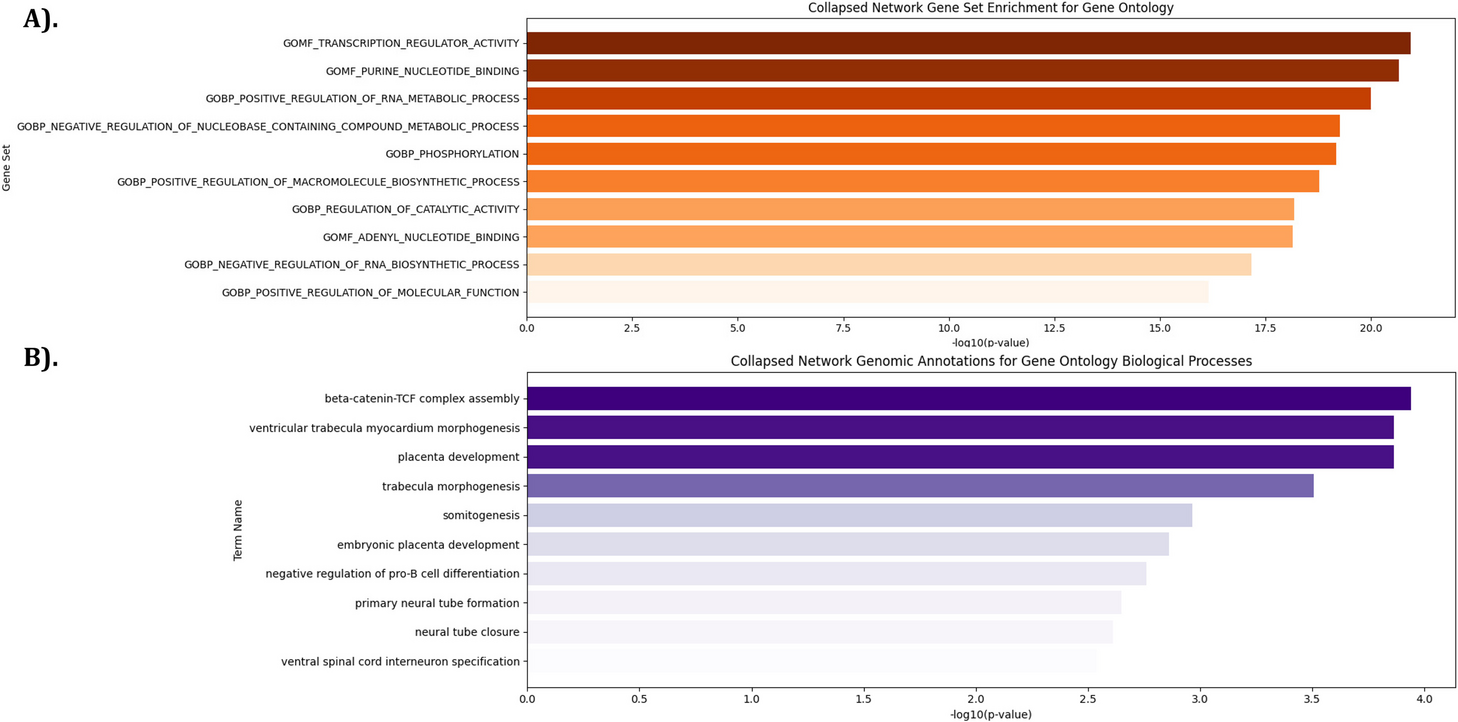
Gene set enrichment analysisWe wondered whether genes involved in any specific biological processes or contexts were overrepresented in the set of genes whose paralogs were significantly upregulated. Therefore, we performed gene set enrichment analysis to check for over-enrichment of any Gene Ontology—Biological Process terms, comparing the following sets of hits against their respective background sets of tested CRISPR targets.
1.Bulk RNA-seq CRISPR targets with bootstrap p-value < 0.1, against a background set of all fully analyzed, human genes only.
2.Single-cell RNA-seq CRISPR targets from Frangieh et al., 2021, among those meeting minimum cell count thresholds above, with any paralog in the top-100 largest increase in percent positive list, or if control percent positive > 0.75 with any paralog in top-100 largest increase in mean list, against background of all targets in library
3.Combined (1) and (2) hits against their combined respective backgrounds
We used the clusterProfiler R package v3.12.0 for gene ontology over-representation testing [55].
NetworksGene regulatory networks are represented as directed graphs. Genes are nodes, and regulatory relationships are edges (e.g., A stimulates B leads to an edge from node A to node B; Fig. 5). The biological mechanism presented in recent studies on nonsense-induced transcriptional compensation implies a minimum set of regulatory relationships between an ancestral regulator, its paralog genes, and a downstream target gene [14, 15]. We model gene regulatory networks with, for each gene, two alleles with transcriptional burst activity independent of each other, consistent with observations of transcriptional burst regulation [123]. The edges between a given regulator gene product and the target gene alleles are set at equal weight, reflecting no regulatory differences at the allele level.
For an upstream regulator gene A that has nonsense-induced transcriptional compensation, there is at least one compensating gene, A’ (referred to as a paralog here). Gene A’ encodes product \(A\). The downstream regulatory target of A and A’ is gene B. Gene B encodes product \(B\). Upon mutation of A, the mutant allele of gene A produces product \(_\) instead of product \(_\). During nonsense-induced transcriptional compensation, \(_\) can regulate alleles of gene A (mutated or not), as well as gene A’, but no longer regulates gene B.
Core transcriptional bursting modelOur network is built of component genes whose alleles are each modeled with an expanded version of the classic telegraph model, similar to prior work (Fig. 5; [66]). Each allele can reversibly enter an active (“on”; transcribing) or inactive (“off”; quiescent) state, with high or low (by default 0) production rates of that gene’s product, respectively. We assume that any gene product is effectively immediately translated or processed to the relevant functional form capable of regulating a downstream target. In the case of \(_, A, B\}\), this assumption applies to post-transcriptional regulation, translation, and post-translational processing. In the case of \(_\), this assumption applies to the hypothesized but unknown mechanisms of nonsense-induced transcriptional compensation. Therefore, for alleles of genes A and A’, and their respective products, there are five consistent reactions:
Since for all genes we assume there is no leaky expression in the off state, in the following sections we ignore the possible \(o\to o+mRNA\) reaction. Alleles of gene B are described by a related but larger set of reactions to reflect the different consequences of regulation by \(\\}\), and are described below.
As previously described, we make use of reaction propensities under the assumption of the law of mass action, where each propensity function \(_(x)dt\) gives the probability of reaction \(_\) occurring in the time step \(dt\), for a small \(dt\). In the models presented here, gene regulation affects either the reaction rate of an allele entering the active state or entering the inactive state.
Activation (positive regulation) modelIn a model of activating interacting genes in a gene regulatory network, all regulation affects the reaction rate of activation of target alleles. In order to simulate differential effects of A-stimulated B alleles versus A’-stimulated B alleles, we used an expanded gene model for B. The expanded model allows for multiple on-states, corresponding to the different upstream regulators; the different on-states are allowed to have different production rates. These different production rates can reflect biological differences in gene regulation at B loci, including, but not limited to, chromatin changes, differences in transcription factor recruitment, and effects on transcriptional machinery. Therefore, for gene B the full set of reactions is:
The rates in the reactions described in Fig. 5, S4 are:
Parameter
Description
\(_\)
Activation rate of an allele
\(_\)
Inactivation rate of an allele
\(_\)
Production rate of mRNA from an active allele
\(_\)
Degradation rate of mRNA
\(_^\)
Additional activation of an allele (A or A’) upon nonsense-induced transcriptional compensation caused by product \(_\)
\(_^\), \(_^,B}\)
Activation of B by A or A’ to one of two respective B active states specified in the model
\(d\)
Factor by which the mRNA production rate of B is lower in the A’-directed B active state than in A-directed B active state
\(n\)
Hill coefficient
\(k\)
Dissociation constant of the Hill function
The full model is therefore described as follows. The basal on-rates of A’ and B alleles are assumed to be 0. The mRNA production rate in the off state of all alleles is fixed at 0.
Reaction
Reaction rate
Reaction propensity
Gene A alleles, wildtype
\(off \to on\)
\(_^+_^\frac_}^}^+_}^}}\)
\(_^+_^\frac_}^}^+_}^}})*off\)
\(on\to off\)
\(_\)
\(_*on\)
\(on\to on+_\)
\(_\)
\(_*on\)
\(_\to \varnothing\)
\(_\)
\(_*_\)
Gene A alleles, nonsense mutant
\(off \to on\)
\(_^+_^\frac_}^}^+_}^}}\)
\(_^+_^\frac_}^}^+_}^}})*off\)
\(on\to off\)
\(_\)
\(_*on\)
\(on\to on+_\)
\(_\)
\(_*on\)
\(_\to \varnothing\)
\(_\)
\(_*_\)
Gene A’ alleles
\(off \to on\)
\(_^}+_^\frac_}^}^+_}^}}\)
\(_^}+_^\frac_}^}^+_}^}})*off\)
\(on\to off\)
\(_\)
\(_*on\)
\(on\to on+A\)
\(_\)
\(_*on\)
\(A\to \varnothing\)
\(_\)
\(_*A\)
Gene B alleles
\(off \to o^\)
\(_^\frac_}^}^+_}^}}\)
\(_^\frac_}^}^+_}^}})*off\)
\(off \to o^)}\)
\(_^,B}\frac}^}^+}^}}\)
(\(_^,B}\frac}^}^+}^})*off\)
\(o^\to off\)
\(_\)
\(_*o^\)
\(o^)}\to off\)
\(_\)
\(_*o^)}\)
\(o^\to o^+B\)
\(_\)
\(_*o^\)
\(o^)}\to o^)}+B\)
\(\frac_}\)
\(\frac_}*o^)}\)
\(B\to \varnothing\)
\(_\)
\(_*B\)
where \(on, o^)}, o^)}, off\in \\), for A and A’ \(on+off=1\), for B \(o^+o^)}+off = 1\). Products \(_, _, A, B\) represent the count of their respective gene products at a given time. Parameter values in reaction rates are explained in the previous table, above.
Multiple-paralog modelSeveral real genes have multiple annotated paralogs, which in principle could all potentially compensate for mutations in the CRISPR-target gene [14, 15, 47]. Therefore, we also developed a gene regulatory network model in which gene A can be compensated for by two paralogs, genes A’1 and A’2 with products \(A}_, A}_\) respectively. Similar to the model in the previous section, each allele of A’1 and A’2 is regulated by nonsense-induced transcriptional compensation for A. An expanded model accounting for differences in regulation of B alleles by gene products \(A}_, A}_\) leads to 3 possible on states: those directed by \(_, A}_, A}_\) respectively.
Gene B alleles
\(off \to o^\)
\(_^\frac_}^}^+_}^}}\)
\(_^\frac_}^}^+_}^}})*off\)
\(off \to o^}_)}\)
\(_^}_,B}\frac}_}^}^+}_}^}}\)
(\(_^}_,B}\frac}_}^}^+}_}^})*off\)
\(off \to o^}_)}\)
\(_^}_,B}\frac}_}^}^+}_}^}}\)
(\(_^}_,B}\frac}_}^}^+}_}^})*off\)
\(o^\to off\)
\(_\)
\(_*o^\)
\(o^}_)}\to off\)
\(_\)
\(_*o^}_)}\)
\(o^}_)}\to off\)
\(_\)
\(_*o^}_)}\)
\(o^\to o^+B\)
\(_\)
\(_*o^\)
\(o^)}\to o^}_)}+B\)
\(\frac_}\)
\(\frac_}*o^}_)}\)
\(o^)}\to o^}_)}+B\)
\(\frac_}\)
\(\frac_}*o^}_)}\)
\(B\to \varnothing\)
\(_\)
\(_*B\)
where \(o^}_)}, o^}_)}\in \\), for A and A’ \(on+off=1\), for B \(o^+o^}_)}+o^}_)}+off = 1\). Parameter values in reaction rates are explained in the previous section, above, with the addition of a new ratio:
Parameter
Description
\(s\)
Factor by which the mRNA production rate of B is lower in the A1’-directed B active state than in A’2-directed B active state
Repression (negative regulation) modelWe also explored gene regulatory network models in which the regulator products \(A, A\) are inhibitors of gene B rather than activators. In this model, although nonsense-induced transcriptional compensation continues to activate expression of A and A’, \(A, A\) products increase the rate of B allele inactivation instead of activation. To simulate differential effects on B alleles, inspired by differential gene regulatory effects such as chromatin modifications and repressive transcription factor recruitment, we changed the gene model of B to include two off states (one directed by \(A\) and one by\(A\)), with one on state. The two off states could have different rates of reversion to the active state, thereby simulating more or less repressed loci. Therefore, while the model confined to the regulation of genes A and A’ remain the same as above, the model for gene B becomes:
Gene B alleles
\(of^ \to o\)
\(_\)
留言 (0)