This retrospective study was approved by the ethics committee of our research centre.
Patients
This study included 234 FLLs from 234 patients who underwent ultrasound and CEUS at our facility between January 2019 and June 2020. For patients with multiple liver lesions, the most suspicious lesion was selected for study. The inclusion criteria were as follows: (1) cirrhosis or chronic hepatitis; (2) detection of malignant lesions and most benign lesions by ultrasound with pathological biopsy results and imaging follow-up for more than 12 months for other benign lesions; and (3) an interval of less than 4 weeks between CEUS and clinical diagnosis. The exclusion criteria were as follows: (1) cirrhosis caused by congenital liver fibrosis or vascular disease; (2) administration of local or systemic therapy; and (3) poor video image quality (except for one patient in the education set). All included lesions met the CEUS LI-RADS criteria.
CEUS examination
All CEUS examinations in the study were performed according to EFSUMB guidelines [9]. The videos included in the study were acquired by two expert radiologists. The ultrasound contrast agent (25 mg, SonoVue) was mixed with 5 mL of 0.9% saline solution, and 2.4 mL of this suspension was injected through the antecubital vein.
All videos comprised images from both ultrasound and CEUS screens. Videos were recorded continuously from the arrival of microbubbles through the first 60 s; thereafter, images were captured intermittently (every 30 s) to minimise microbubble destruction until the microbubbles had cleared completely from the circulation (4–6 min). The phase of angiographic perfusion was based on CEUS LI-RADS.
Image selection and interpretation
CEUS videos of 234 liver lesions were selected and reviewed by two expert radiologists dedicated to CEUS examinations based on CEUS LI-RADS and then reviewed by another four expert radiologists. First, four expert radiologists performed the evaluations separately, and then agreement was reached after discussion. The clinical, histopathological, and CT/MRI findings of all videos were not known by the four expert radiologists during the review to minimise bias in ultrasound interpretation. The videos were classified into four groups (a–d), as follows: (a) The education set comprised 27 videos that showed typical CEUS features or were representative of cases described in the CEUS LI-RADS classification. The education set included ultrasound images of the lesions (including the size of the lesions), dual ultrasound and CEUS videos, the consensus results of the classification and CEUS features of the lesions reached by four expert radiologists based on CEUS LI-RADS, and the pathology and CT/MRI findings. The above contents were recorded on a table. The CEUS features included arterial-phase enhancement features, washout, onset of washout, and degree of washout. (2) The three test sets (b, c, d), each containing 69 videos, were organised like the education set. The three tables (b, c, d) could be reviewed by the trainees after the test. The three test sets (b, c, d) were used for the pretraining, post-training, and 3-months post-training evaluations, respectively.
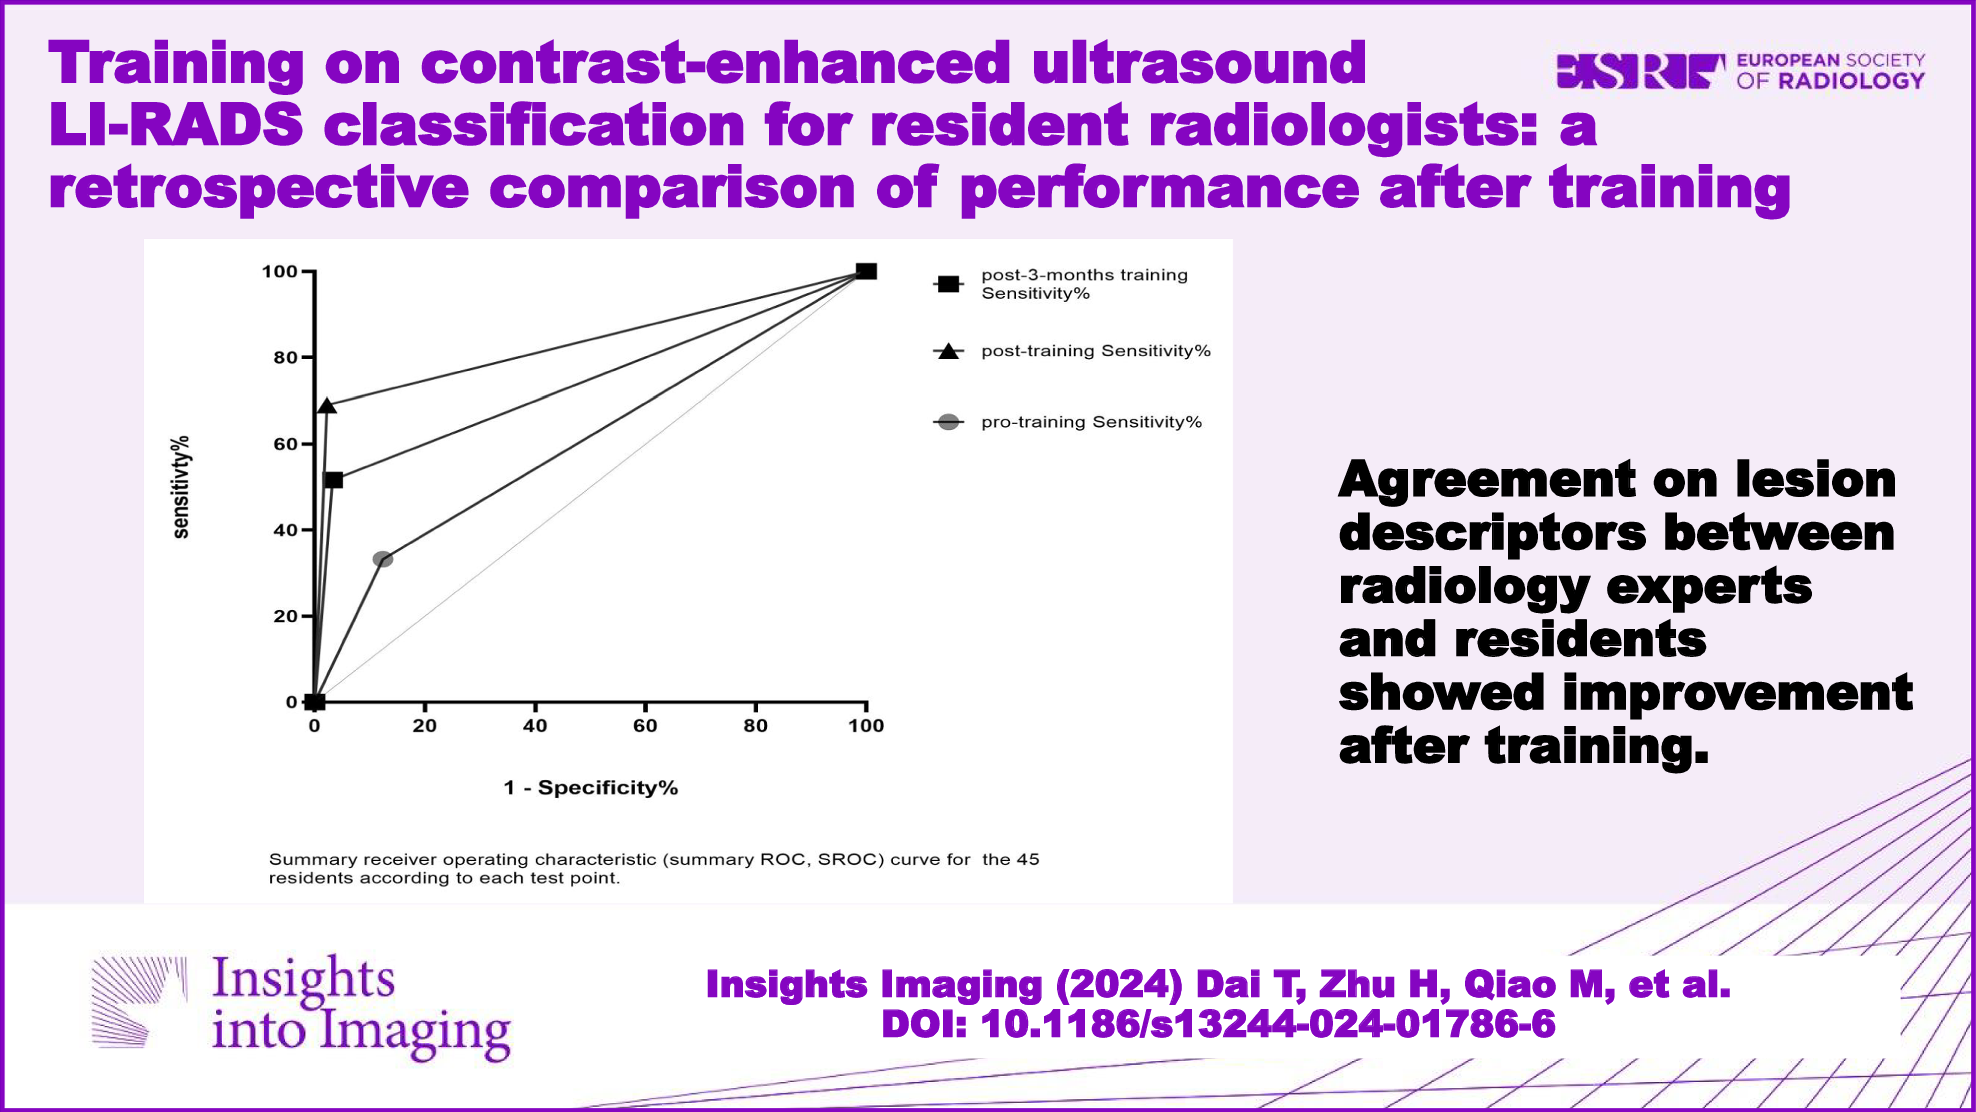
From August 2020 to June 2022, 45 resident radiologists from 9 institutions (2 academic centres and 7 community hospitals) participated in the training. Before training, 45 resident radiologists reviewed test set a. According to the CEUS LI-RADS online, the resident radiologists filled out tables with CEUS features and categories for each lesion. Then, each resident radiologist received theoretical training. Twenty-one resident radiologists participated in the online training, and 24 resident radiologists participated in the offline training. Each training session consisted of three lectures, each of which lasted more than 2 h. The content of the training mainly included the explanation and case presentation of the CEUS LI-RADS. During the training period, 45 resident radiologists were free to review the education set, and 4 expert radiologists answered questions regarding the relevant contents of CEUS LI-RADS during the months of training. Test sets c and d were reviewed, and tables were constructed with CEUS features and categories for each lesion by resident radiologists immediately after training and 3-months after training. The reasons for errors were ascertained with a questionnaire after the three tests. The questionnaire included the following questions: (1) Why did you misclassify the lesion? Please write what you think were the reasons for the classification. (2) If it was a lesion imaging feature recognition error, please state the feature you think, and analyse the reason for the error. To simulate daily diagnosis and prevent “background bias,” the lesions in the three test sets were randomly assigned [14].
Statistical analysis
All the statistical analyses were performed with SPSS software (version 27) and GraphPad Prism (version 9). Continuous variables are presented as averages ± standard deviations, and categorical variables are presented as percentages. One-way ANOVA and the χ2 test were used for comparisons between groups. Cohen’s kappa was used to analyse the consistency of the CEUS feature descriptions and categories between the resident and expert radiologists in the three tests, with kappa values ranging from 0.00 to 0.20 indicating slight agreement; 0.20 to 0.40 indicating fair agreement; 0.40 to 0.60 indicating moderate agreement; 0.60 to 0.80 indicating substantial agreement; and 0.80 to 1.00 indicating almost perfect agreement. Multiple responses were used to analyse the reasons for disagreements between the resident and expert radiologists. For the diagnosis of HCC, LI-RADS category 5 results were considered positive, and other results were considered negative. The diagnostic performance of the residents and experienced radiologists was calculated, including the sensitivity, specificity, Positive predictive value (PPV), and accuracy. The area under the receiver operating characteristic (ROC) curve (AUC) was calculated. All p-values < 0.05 were considered to indicate statistical significance.


留言 (0)