Clinical tissue specimens
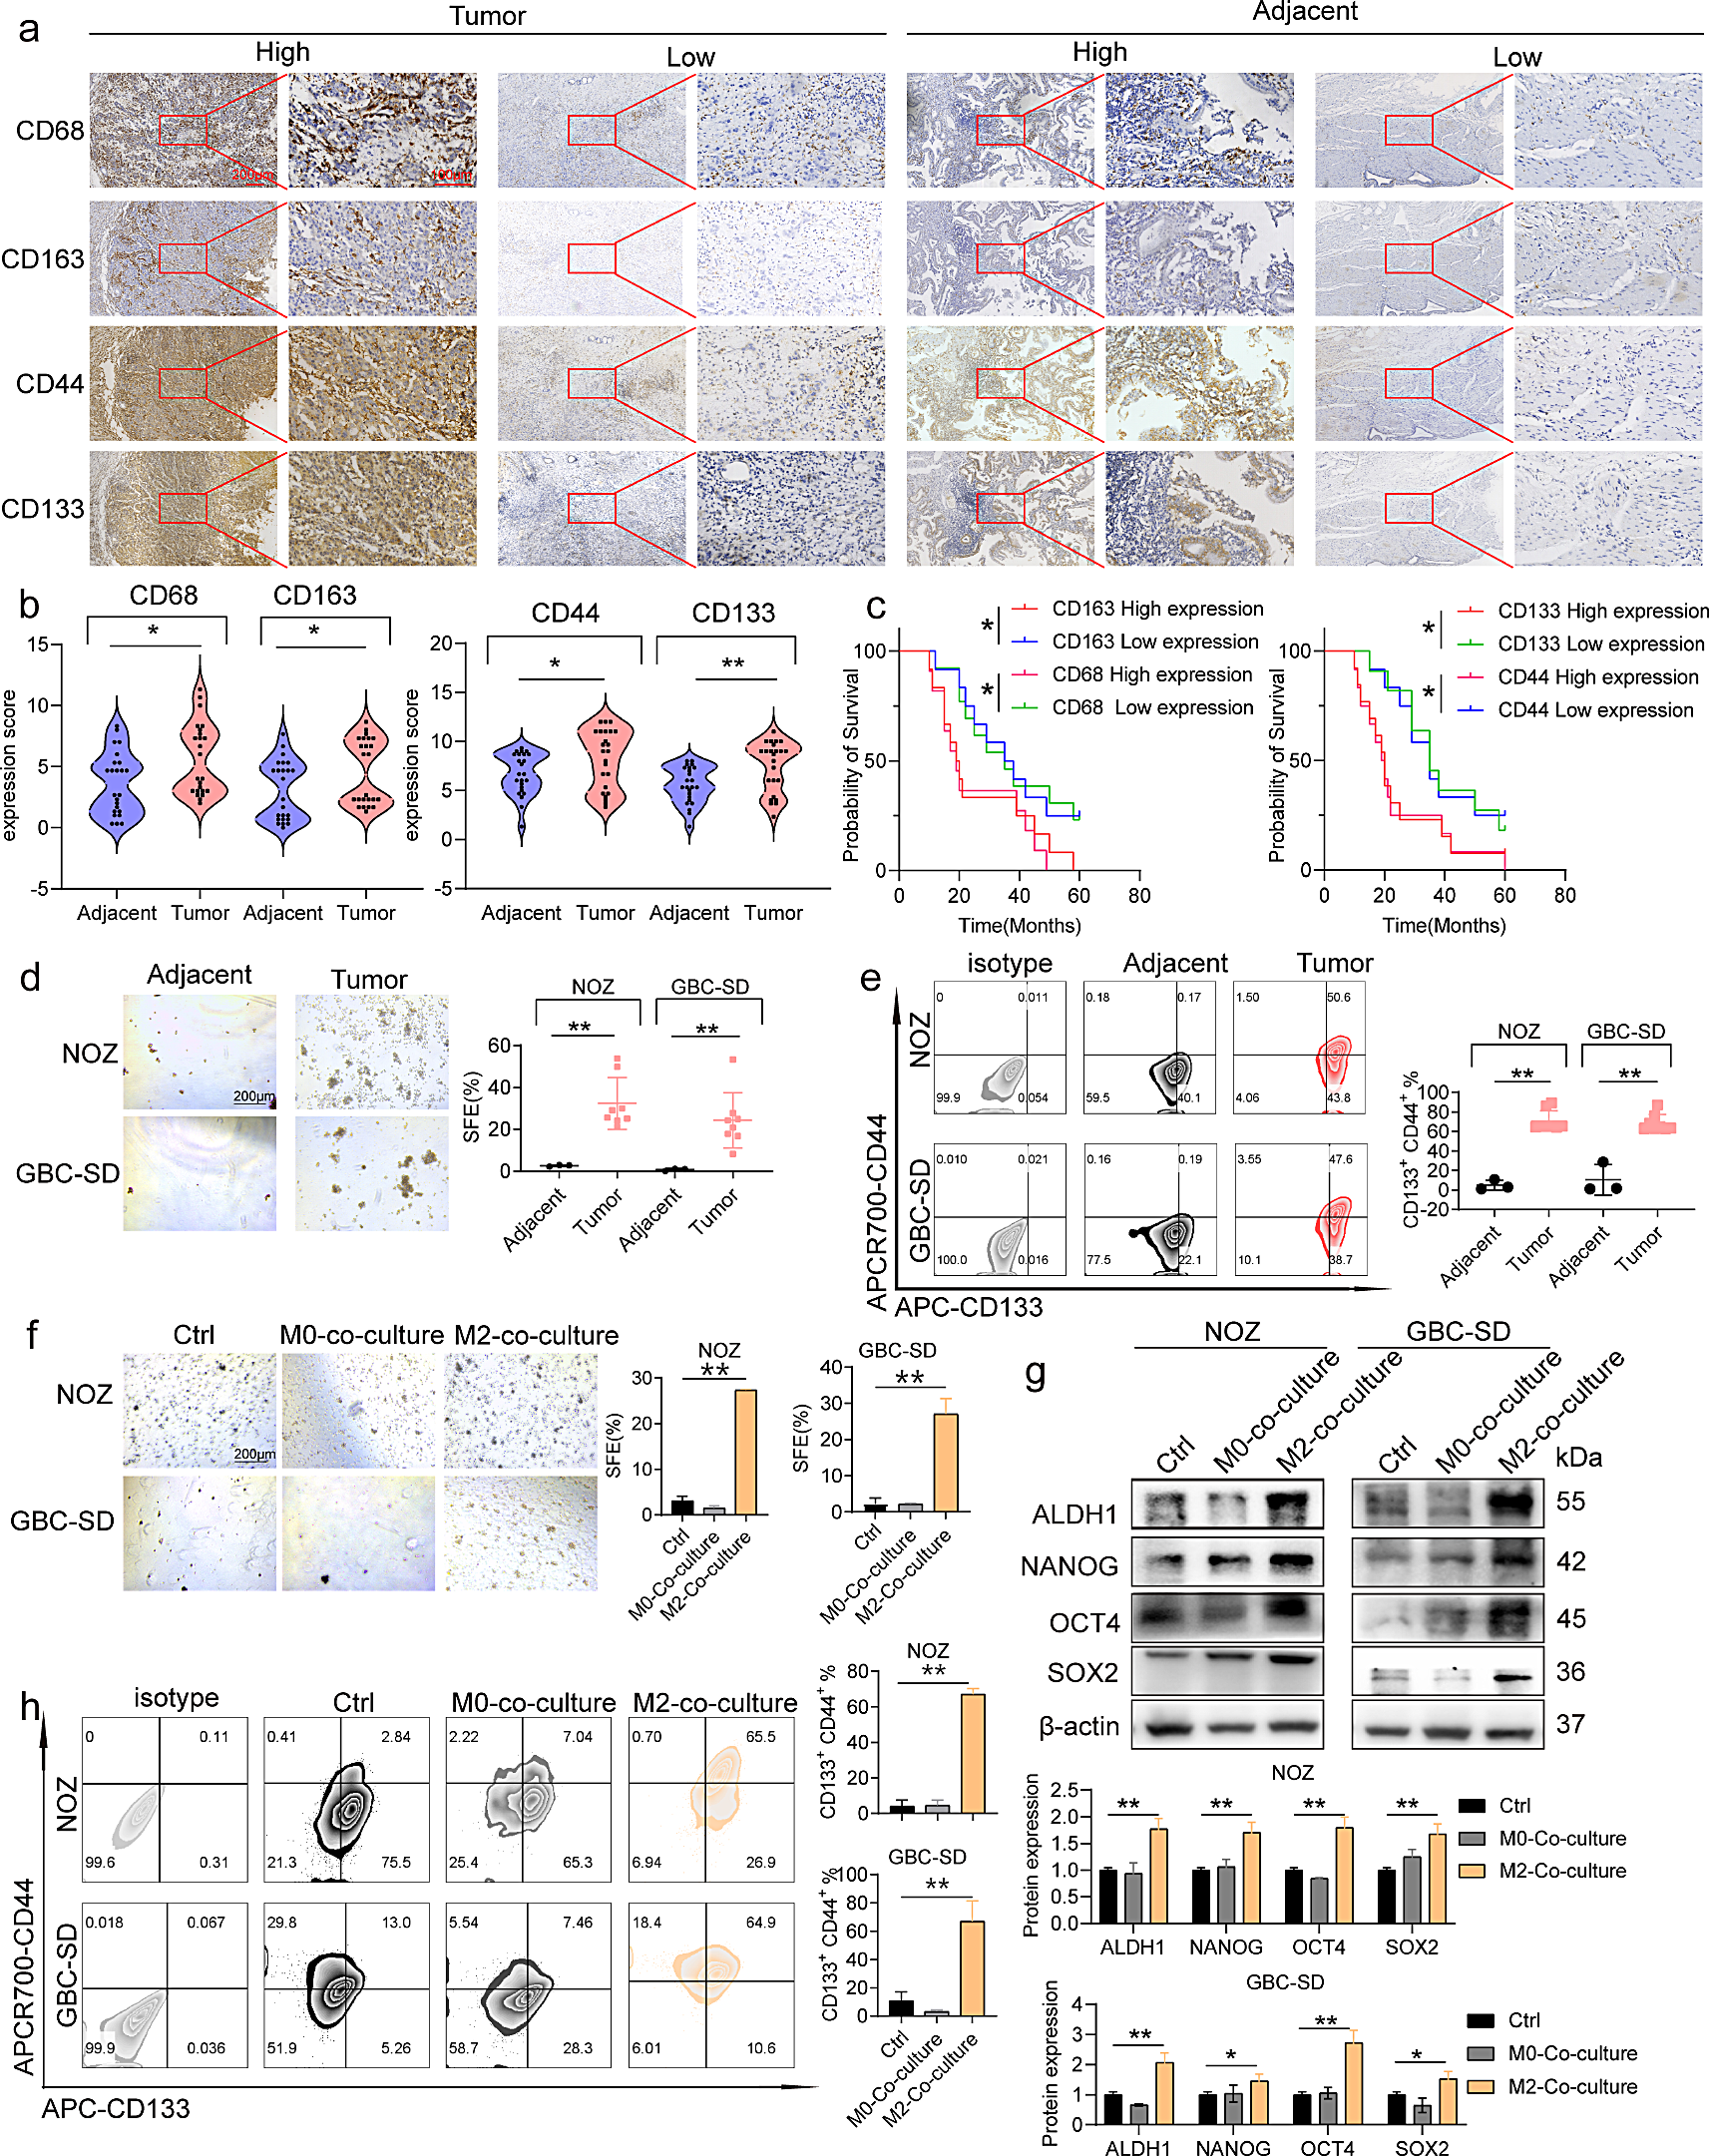
Paraffin-embedded blocks containing GBC and adjacent non-tumor (ANT) tissues from 24 patients with GBC were prepared and collected for immunohistochemistry (IHC) to determine the expression of CD68, CD163, CD133, and CD44 (Supplementary Table 1). Additionally, freshly resected paired samples of GBC and ANT tissues from eight patients with GBC were collected to isolate CD14+ macrophages for subsequent cellular analyses (Supplementary Table 2). All cases were confirmed as GBC at the pathology department, and no patients underwent chemoradiotherapy before tumor resection. This study was approved by the Ethics Committee of Fujian Medical University Union Hospital (Ethical No. 2021QH019).
Cell lines and animals
The human GBC cell lines, GBC-SD and NOZ, were acquired from the Japan Health Sciences Research Resource Bank, and the human mononuclear myeloid leukemia cell line, THP-1, was obtained from the American Type Culture Collection. All cell lines underwent STR analysis to confirm their identity and routine mycoplasma testing to ensure the absence of contamination. Male nude mice (15–20 g, 5–6 W) from Guangdong Pharmachem Biotechnology Co., Ltd. were housed in the Fujian Medical University Experimental Animal Center. The mice were subjected to a 12-h light-dark cycle for feeding. The Fujian Medical University Ethics Committee approved this study (Ethics No. FJMU IACUC 2021 − 0383).
Magnetic activated cell sorting for macrophages
The samples were processed using eye scissors to obtain the dimensions of 1 × 1 × 1 mm. The digestion process was conducted at 37 °C using a digestion solution according to the manufacturer’s instructions (130-095-929, Miltenyi). Ficoll® solution (26873-85-8, MERCK) was used to separate the suspension. Macrophages were isolated from lymphocytes through treatment with the EasySep™ Human CD14 Positive Selection Kit II (17858 100–0694 17858RF, Stemcells).
Cell culture and induction
GBC-SD, NOZ, and THP-1 cells were cultured in Dulbeco’s Modified Eagles’s Medium (12100046, Gibco) or RPMI 1640 medium (11875101, Gibco) supplemented with 10% fetal bovine serum (FBS) (10099141 C, Gibco). The cells were incubated in a humidified atmosphere at 37 °C and 5% CO2. When the GBC cell density reached 90%, the medium was discarded, and trypsin was added (25200072, Gibco) for a 3-min digestion. Subsequently, the cells were centrifuged at 800 × g for 5 min, and a complete medium was added for passaging. After a 48-h culturing of THP-1 cells, the cells were centrifuged at 800 × g for 5 min, and the medium was added to the passenger culture. Next, the THP-1 cells were revulsed into undifferentiated macrophages (M0) and M2-like TAMs through the application of 100 ng/mL PMA (16561-29-8, MERCK), 20 ng/mL IL-4 (200-04, PeproTech), and 20 ng/mL IL-13 (200 − 13, PeproTech) [23]. RPMI 1640 medium supplemented with 2% FBS was introduced to M0 and M2-like TAMs. The resulting supernatant was obtained after 24 h through centrifugation at 2,000 × g for 5 min and stored at -80 °C if not immediately used. Depending on the specific groups, GBC cells were subjected to treatment with 20 µM U0126 [24] (19–147, MERCK), 20 µM RS504393 [25] (300816-15-3, MERCK), and 150 ng/mL CCL2 [26] (300 − 36, PeproTech) for 48 h.
IHC
Tissue samples were prepared by cutting them into blocks of approximately 5 × 5 × 3 mm and embedding them in wax molds. Subsequently, the blocks were sliced using a microtome after being pre-cooled for 10–15 min. The paraffin sections were deparaffinized, and endogenous peroxidase was blocked. Sections were incubated with a drop of 3% bovine serum albumin (BSA) (9048-46-8, MERCK) and titrated with the primary antibody (Supplementary Table 3). The sections were carefully dried, followed by the dropwise addition of secondary antibodies (as listed in Supplementary Table 3) specific to the species corresponding to the designated circles. Color development was performed, the nuclei were stained, and the sections were dehydrated and sealed. At least five fields of view from each section were carefully examined under a microscope at 400× magnification. Immunoreactivity score (IRS) = staining intensity (SI) × percentage of positive cells (PP). The SI was scored as 0 = negative, 1 = weak, 2 = moderate, and 3 = strong. PP was defined as 0 = 0%; 1 = 0–25%; 2 = 25–50%; 3 = 50–75%; 4 = 75–100%. All patients were divided into two groups based on the median expression score (high expression group: > median score; low expression group: ≤ median score) [27, 28].
Sphere-forming assay
GBC cells (2 × 10³ ) were collected and cultured in low-adhesion culture plates (3471; Corning). The cells were cultured in serum-free DMEM/F-20 (21331020, Merck) supplemented with 12 ng/mL FGF (100-18B, PeproTech), 20 ng/mL EGF (100 − 47, PeproTech), and 20 ng/mL IGF (100 − 11, PeproTech). The incubation was performed at 37 °C and 5% CO2 in a humidified environment for 7 days according to the manufacturer’s guidelines. The resulting cell cultures were examined under an inverted microscope. Three random fields of view were selected and analyzed to determine the sphere formation efficiency (SFE).
Flow cytometry and fluorescence-activated cell sorting
For surface staining, the cells were directly incubated with antibodies (Supplementary Table 3). For intracellular staining, cells were first subjected to surface staining, followed by fixation and permeabilization (554722, BD Biosciences). Subsequently, the cells were washed twice with 1× BD Perm/Wash™ Buffer (554723, BD) and treated with antibodys (Supplementary Table 3). All samples were washed twice with phosphate-buffered saline (PBS) containing 2% FBS. Sorting and analysis were performed using a fluorescence-activated cell sorting or Celesta flow cytometer, and the FlowJo software was used for data analysis.
Western blotting
Cells were lysed using RIPA lysis buffer (V900854, Merck) and PMSF (329-98-6, Merck) to extract total protein. Nuclear and non-nuclear proteins were extracted separately according to the manufacturer’s instructions (R0050, Solarbio). The protein concentration was determined using the BCA assay (71285-M, Merck) following the manufacturer’s instructions. Total proteins were separated through Sodium Deodocyl Sulfate Polyacrylamide Gel Electrophoresis and transferred onto a Polyvinylidene Fluoride (PVDF) membrane (IEVH00005, Millipore). The PVDF membranes were blocked with BSA for 30 min and incubated with primary (Supplementary Table 3) and secondary (Supplementary Table 3) antibodies. The resulting color development was achieved using an ECL-Luminescence solution (P0018S, Beyotime), and the bands were detected using the Bio-Rad ChemiDoc XRS + system. The net gray value of these bands was determined using the ImageJ software.
Cytokine array analysis
Culture supernatants of M0- and M2-like TAMs were collected individually. The array membranes were processed following the manufacturer’s instructions (ab 133998, Abcam) and subjected to detection using a detection buffer on a Bio-Rad ChemiDoc XRS + system. The net gray values of the membranes were quantified using the ImageJ software.
Proteomics and RNA-seq
The LC-MS/MS analysis was performed using a Q-Exactive mass spectrometer. The mass spectrometer was operated in the positive ion mode. MS data were acquired using a data-dependent top20 method, dynamically choosing the most abundant precursor ions from the survey scan (300–1800 m/z) for HCD fragmentation. The automatic gain control target was set to 1e6, and the maximum injection time was set to 50 ms. The dynamic exclusion duration was 30 s. Survey scans were acquired at a resolution of 60,000 at m/z 200, the resolution for the HCD spectra was set to 15,000 at m/z 200, and the isolation width was 1.5 m/z. The normalized collision energy was 30 eV, and the underfill ratio, which specifies the minimum percentage of the target value likely to be reached at the maximum fill time, was defined as 0.1%. RNA-seq was performed by the Wuhan Metware Biotechnology Co.
Enzyme-linked immunosorbent assay (ELISA)
A volume of 200 µL of standard and sample was added into each well, followed by washing and incubation with 200 µL of CCL2 conjugate (DCP00, RD) for 1 h. Subsequently, 200 µL of substrate solution was added in a light-free environment, and the optical density was assessed at wavelengths of 450 nm and calibration wavelengths of 540–570 nm.
RNA preparation and quantitative reverse-transcription PCR
Total RNA was extracted using TRIzol reagent (T9424, Merck) following the manufacturer’s instructions. For qPCR, cDNA was synthesized by adding TransScript® II One-Step gDNA Removal and cDNA Synthesis SuperMix (AH311-02, TransGen) to the PCR tube. The amplification process involved a holding stage at 95 ℃ for 10 s, followed by a cycling stage at 95 ℃ for 10 s, 60 ℃ for 20 s, and 72 ℃ for 36 s, repeated in 40 cycles. Relative expression was determined using the 2−ΔΔCt method. The lysis curve was plotted using the default instrument program. The primer sequences used in this study are listed in Supplementary Table 4.
Mouse studies and bioluminescence imaging
NOZ cells, which were in the logarithmic growth phase and had successfully induced M2-like TAMs, were resuspended in PBS. The concentration of the single-cell suspension was adjusted to 5 × 10⁶ cells/mL, and the M2 co-culture group comprised GBC cells and M2-like TAMs at a ratio of 1:1. The subcutaneous xenograft or lung metastasis model was established by injecting 200 µL of tumor cells suspension into the right axilla or tail vein, respectively. After 10 days, peritumoral and intraperitoneal injections of 800 µg/kg CCL2, 20 mg/kg RS504393, and 100 mg/kg gemcitabine (122111-03-9, Merck) were administered every 3 days depending on the group. To evaluate tumor growth, the subcutaneous tumor model involved seven administrations before sacrifice, and the lung metastasis model involved 14 administrations. The volume and weight of the tumor tissues were measured. In addition, tumors and lung tissues were examined using hematoxylin and eosin staining and IHC. The luciferase-tagged lentivirus used in this study was constructed, synthesized, and characterized by Shanghai Genechem Co. Ltd. For imaging purposes, a 150 mg/kg dose of D-fluorescein potassium salt (115144-35-9, Sigma) dissolved in PBS at 30 mg/mL was administered via intraperitoneal injection and allowed to circulate for 10 min. Imaging was performed using an Image Visualization And Infrared Spectroscopy Lumina Series III. The survival rate of experimental mice was assessed following the Wistar IACUC guidelines for sedation, analgesia, anesthesia, and euthanasia.
Immunofluorescence
GBC cells were cultured on slides and immobilized using a fixative (P0098; Beyotime). Subsequently, the sections were exposed to immunostaining permeabilization (P0095, Beyotime) and blocking (P0260, Beyotime) solutions, followed by incubation with labeled primary antibodies (Supplementary Table 3). Fluorescent secondary antibodies (Supplementary Table 3) were used to label the pairs of sections. DAPI (C1002, Beyotime) was used to re-stain the nuclei. The samples were scanned with a confocal laser microscope, with emission wavelengths set at 488 and 555 nm and excitation wavelengths set at 530 and 580 nm. For each section, five fields were randomly analyzed.
Double luciferase reporter gene assay
Cells were lysed according to the manufacturer’s instructions (PM040; Promega). Subsequently, 1 × PLB lysate was introduced for 15 min and transferred to an opaque white 96-well plate, and LARII was added. The amount of luciferase-excited substrate release from the firefly was determined. Next, Stop&Glo Reagent was added, and the amount of the sea cucumber luciferase-excited substrate release was determined.
Chromatin immunoprecipitation (CHIP) assays
Chromatin was cross-linked, and cells were collected and lysed using Cell Lysis Buffer (17-10085, Merck) according to the manufacturer’s instructions. The cross-linked DNA fragments were sonicated to achieve a length range of 200–1,000 bp. ELK-1 and IgG antibodies were introduced (Supplementary Table 3). The DNA was purified through uncrossing. Finally, the purified DNA was subjected to qPCR using specific primers (Supplementary Table 4) for detection.
Plasmid transfection
The recombinant SNAIL promoter-reporter gene vector, recombinant reporter gene vector for each truncated fragment, recombinant SNAIL binding site mutant vector, eukaryotic ELK-1 expression plasmids, sh-ELK-1, and sh-SNAIL were synthesized and characterized by Shanghai GeneChem Co., Ltd. (Supplementary Table 5). GBC cells were transformed using Invitrogen™ Lipofectamine™ 3000 Transfection Reagent (L3000075, Thermo) following the manufacturer’s instructions. All sequences were verified using DNA sequencing.
Migration assay
GBC cells were co-cultured with M0- or M2-like TAMs. The lower chamber of a Transwell (3422, Corning) was filled with 400 µL of various media, while the upper chamber was filled with cells and incubated in a humidified atmosphere with 5% CO2 at 37 ℃ for 24 h. The Transwell was removed and treated with a fixative (G1101, Servicebio) for 30 min. Subsequently, the Transwell was stained with 500 µL of 0.1% crystal violet (G1014, Servicebio) for 20 min. The number of cells in five fields of view was assessed using a microscope, and cell migration was compared between the different experimental groups. After a 48-h incubation of GBC cells with different drugs based on their respective groups, 1 × 10⁶ cells were seeded onto a plate, and a wound was created. The wounds were examined under a microscope at 0 and 24 h, and the wound healing rate was calculated.
Statistical analysis
Statistical graphs were created using GraphPad Prism 9.0. Measurements were presented as mean ± standard deviation (SD). Data were analyzed using Student’s t-test to compare means between two groups with normal distribution, one-way analysis of variance to compare means between several groups, and the chi-square test for correlation analysis. Statistical significance was set at a significance level of P < 0.05.
Flow chart of the study
A flowchart was designed to offer a clear and concise overview of the study’s methodology, highlighting the sequence of events and experimental approaches used (Supplementary Fig. 1).

留言 (0)