
記住我
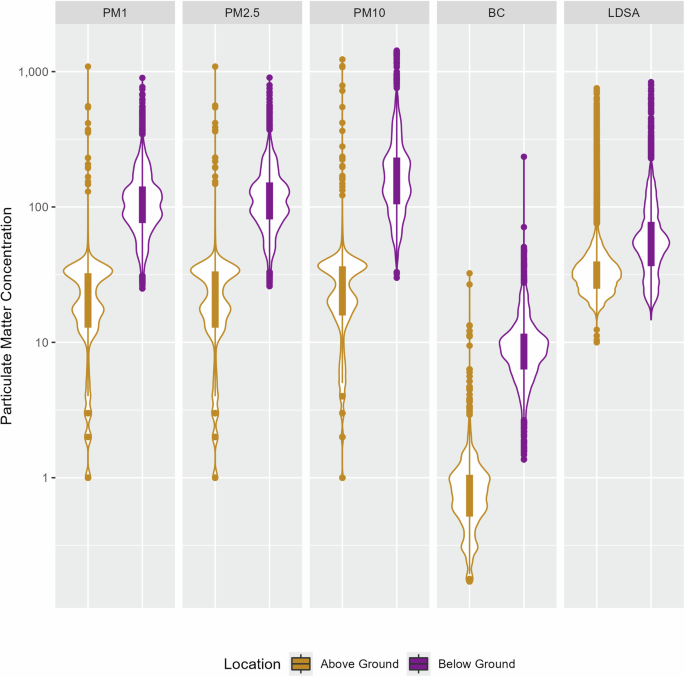

The belowground location had the highest PM concentrations compared to both the aboveground and the suburban location (Fig. 1 and S4). Mean belowground concentrations of PM2.5 and PM10 at 15th Street subway station were 120 ± 65.5 and 182.1 ± 132 µg/m3, respectively, and aboveground concentrations from the same street location were 22.2 ± 13.9 and 26.0 ± 15.7 µg/m3, respectively (Fig. 1, Table S1). At the suburban location, the PM2.5 and PM10 concentrations were much lower, 11.0 ± 5.6 µg/m3 and 11.7 ± 6 µg/m3, respectively, measured during the previous month (Fig. S4). The mean concentrations of UFP LDSA and BC were also higher belowground (59.4 ± 36.2 µm2/cm3 and 9.5 ± 5.4 µg/m3) respectively, compared to the respective aboveground 35.8 ± 21.7 µm2/cm3 and 0.9 ± 0.8 µg/m3 (Table S1).
Fig. 1: PM, BC, and UFP LDSA concentrations at aboveground (AG), belowground (BG).
The box shows the interquartile range with median value for each location, whereas the violin pattern outside shows the entire pollutant distribution. The y-axis is presented in a log scale with units µg/m3 for PM1, PM2.5, PM10 and BC, µm2/cm3 for UFP LDSA. The dots show the outliers near both above and below the whiskers.
Belowground at the Philadelphia 15th Street station, the PM2.5 mean concentration (120 ± 65.5 µg/m3) was higher than other cities’ subway stations such as Singapore (24.1 µg/m3) [44], Munich, Germany (27 to 80 µg/m3) [45], Athens, Greece (88.1 µg/m3) [37], and Stockholm, Sweden (76 µg/m3) [46]. While the mean PM10 concentration (182.1 ± 132 µg/m3) in Philadelphia was higher than a few cities, such as, Singapore (26.9 µg/m3) [44], some cities have higher belowground mean PM10 concentrations than Philadelphia, such as Tianjin, China (162.82 ± 25.6 µg/m3) [47], Athens, Greece (320.8 µg/m3) [37], Seoul, South Korea (359 µg/m3) [48], and Stockholm, Sweden (237 µg/m3) [46]. The BC concentration found belowground (9.5 ± 5.4 μg/m3) was also higher than some of the other subways reported previously, such as, Hongkong (3.6 ± 2.1 μg/m3) [49], Singapore (2.4 ± 1.3 μg/m3) [50], and Toronto (7.8 ± 7.2 μg/m3) [51], while lower than a few stations such as, New York (22.4 ± 7.5 μg/m3) [38]. Since limited studies has been done on UFP (LDSA) in the subway microenvironment, the number concentration of UFP, in few cities were also found to contain higher concentrations such as Beijing, China (13,245 ± 2936 particles/cm3) [10], than this study in this Philadelphia subway (17505 ± 8685 particles/cm3).
Based on data collected in February and August of 2015, Luglio et al. [38] found an overall mean concentration of PM2.5 in Philadelphia of 112 ± 46.7 µg/m3, which is similar to our present findings. In our previous study, [34] we found similar values at 15th Street station, with mean PM2.5 and PM10 concentrations of 110 ± 33 and 127 ± 33 µg/m3, respectively, in spring 2018, and 88 ± 44 and 109 ± 57 µg/m3, respectively, in spring 2019. Higher PM concentration at the 15th Street Philadelphia subway station than other subway systems may be because of inadequate ventilation and cleaning, and old age. High PM1 concentration also indicates an increased concern for adverse health consequences.
Compared to the aboveground, the total mean concentrations for PM2.5 and PM10 in the belowground were 5.7 and 7.6 times higher, respectively (Fig. 2A). For three out of five days of measurement (Fig. 2A), the belowground to aboveground ratio for PM2.5 was smaller compared to that for PM10. This indicates that additional PM sources such as resuspension, brake dust besides combustion source at belowground. For UFP, both the LDSA and number concentration belowground were nearly 1.7 and 1.2 times higher, respectively than the aboveground (Fig. 2B, C). UFP (LDSA and number concentration) shows the smallest difference between aboveground and belowground compared to PM and BC. This indicates the minor UFP sources at belowground compared to that for PM and BC. BC concentration belowground showed the highest difference with 10.7 times higher than aboveground (Fig. 2D). In the absence of major combustion sources belowground, it is unlikely that all BC particles were from incomplete combustion sources. It is likely that some iron particles were measured as black carbon. Though there was a variability between the belowground to aboveground ratios of all the pollutants, the pattern for the variability for all the pollutants was similar in terms of the days (Fig. 2). On July 13th, all the means and ratios were higher than on all other days (except for the PM), whereas for July 15th, means and ratios were the lowest (Fig. 2). It is noteworthy to mention that for all the pollutants, when compared to all the other days, the belowground mean pollutant concentration was significantly lower on July 15th, 2022 (Table S1), whereas there was not very significant change in the mean in the aboveground concentration. One possible explanation for this lower concentration in the belowground on July 15th can be some cleaning activity that might have taken place in belowground (such as cleaning of the belowground floors or train tracks) between July 13th to 15th, 2022.
Fig. 2: Belowground to aboveground ratio of PM2.5, PM10, UFP (number concentration and LDSA), and BC for all sampling days in bar graph.
In the secondary y axis, respective mean pollutant concentration at belowground (BG) is shown with the point-line. Ratio (bar graphs) and mean (line graphs) of PM2.5 and PM10 are shown in (A). Similarly, the ratio and mean of UFP number concentration, LDSA and BC are shown in (B), (C), and (D), respectively.
Both the UFP and BC are products from incomplete combustion and other combustion activities [49, 52,53,54], however, other natural and anthropogenic sources such as heating from the building or the power supply can be a potential source for UFP [13, 55]. Due to the diverse sources, the chemical composition of UFP can be from elemental and organic carbon, or inorganic components such as metals [13, 55]. Higher air dispersion can result in higher UFP concentration in the belowground from outdoor sources. However, the enclosed belowground space with higher UFP concentration indicates other indoor sources such as train frequency, friction of the metal wears, and wheels, electric power supply, crustal particles or even the efficiency of the mechanical ventilation system [13, 53]. A higher belowground BC concentration than the aboveground also indicates less opportunity for dispersion at belowground. There could also be BC originating from equipment for maintenance and cleaning in the subways. Additionally, the aethalometer measures BC based on the light absorption of particles. Therefore, the belowground, aethalometer may detect both soot from the combustion process and also responding to the light absorbing particles such as iron (Fe) particles [56, 57] generated from the wear of the wheels and tracks from the subway cars. Lyu & Olofsson [27] found that the use of graphite lubricant on the brake discs can generate BC. A study conducted in New York City found the BC concentration to be higher (5–23 μg/m3) in the belowground subway than at the street level (3 μg/m3) [26]. In another study of subways in four Northeastern cities (Boston, New York, Philadelphia and Washington D.C), BC in the belowground subway ranged from 5–12 μg/m3, and the highest level of 22.4 ± 7.5 μg/m3 was found in New York City [38]. The authors attributed high BC concentration to the diesel operated cars used in the underground stations at night [38]. Vilcassim et al. [26] found that depending on the station depth and line, BC concentration indicated high spatial variation. Since belowground sampling location was two floors below the street level (Fig. S2), the distant outdoor platform may have limited the air dispersion in the belowground. Thus, there was likely little circulation and mixing of air with outdoor air, suggesting perhaps the primary source of the BC was graphite lubricant on disc brakes and the diesel operated cars used for the maintenance of the subways. However, due to limited available information on the belowground maintenance protocol, mechanical ventilation system of the station, and possible overestimation of measurement artifacts, the sources of the belowground UFP and BC cannot be attributed confidently.
Regarding the overall high concentrations of PM than aboveground, the outdoor polluted air after entering the belowground subways is less likely to be removed by natural ventilation alone. Therefore, removal of belowground pollutants relies more on the mechanical ventilation system. High concentrations of PM in the belowground result from the abrasion of the wheels with the rail tracks and wires, train piston effects, and/or the resuspension of PM from the movement of both the commuters and the trains [34, 58, 59]. The station design, ventilation system, and the age of the infrastructure also play important roles in controlling the belowground air quality. Since this station was built in 1940 [41], the old infrastructure could be another contributing factor for the high level of belowground PM concentration. Hwang et al. [60] found the subway stations built before the 1970s in Seoul, South Korea had higher PM concentration than the stations that were built after the 1970s.
Temporal variability between aboveground and belowground locationsThe pollutant concentrations varied from day to day at belowground and aboveground location (Fig. 3). There was a greater variation of PM (PM1, PM2.5, PM10) and BC at the belowground than the aboveground location (Fig. 3).
Fig. 3: Patterns of PM concentrations for aboveground (AG) and belowground (BG) locations.
A July 13, B July 18, and C July 22, 2022. The figure is presented in a log scale with units µg/m3 for PM1, PM2.5, PM10 and BC and for µm2/cm3 for UFP LDSA and particle/cm3 for number concentration.
Since the belowground location had two tunnels, with each tunnel having 2 subway tracks, the train frequency at this station was about every two to six minutes, causing spikes in the pollutant concentrations with arrivals and departures of trains. For all five days of measurements, BC and UFP concentrations in the belowground showed parallel rise with the aboveground concentration (Figs. 3 and 4) and a possible reason could be polluted air was also being carried out to the tunnel from the aboveground traffic activity [61]. As the primary source of BC and UFP is incomplete combustion activities, it is likely these particles entered the belowground location from aboveground traffic. Yang et al. [49] reported that the UFP number concentration near the busy city roads of Hong Kong was >100,000 particles cm−3, but there was less UFP number concentration in the platform (0.9 ± 0.5 × 10⁴ particles cm−3). In Rome, Italy, the subway systems with shallow underground stations with respect to road surface had greater UFP particles than the subway systems with deeper underground stations [6].
Fig. 4: Correlation between aboveground (AG) and belowground (BG) black carbon (BC) and particulate matter.
PM25 and PM10 in the figure represent PM2.5 and PM10, respectively.
However, for PM, the belowground concentration fluctuations did not always correspond with the aboveground, meaning the belowground PM concentration can be generated from both the outdoor and indoor sources. Bendl et al. [45] found the frequency of trains to the platform had a significant effect on the belowground PM concentration. Additionally, Bendl et al. [45] found that after departure of two trains in opposite directions on adjacent tracks simultaneously, there were noticeable spikes on the PM concentrations for a short time. Given the complex structure of the station with adjacent two tunnels, with four tracks in opposite directions, the station experiences highly variable timings, dependent on train destinations. This variability leads to frequent trains entering and leaving the belowground location, potentially causing sudden spikes in pollutant concentrations.
Correlation of PM and BCCorrelations tests were conducted between PM and BC to assess the combustion related PM. Correlation coefficients of BC and PM (PM2.5, PM10) were higher at the belowground than at the aboveground location (Fig. 4). This is different than what we expected considering the high combustion related sources such as traffic activity at aboveground busy street. This may further indicate that aethalometer is responding to iron-related particles and PM generated at belowground is related to iron particles generated from the train tracks. At the belowground, the correlation of BC with PM2.5 and PM10 was moderate (Fig. 4). Correlation of BC was slightly higher with PM2.5 (r = 0.51, p < 0.05) compared to PM10 (r = 0.46, p < 0.05) (Fig. 4). Whereas at the aboveground, the correlation of BC with PM2.5 (r = 0.16, p < 0.05) and PM10 (r = 0.14, p < 0.05) was much lower compared to the belowground (Fig. 4). Furthermore, the correlations between belowground PM2.5 and PM10 with the respective aboveground PM2.5 and PM10 show positive but weak correlations (r = 0.14, p < 0.05 and r = 0.15, p < 0.05) (Fig. 4). Besides outside traffic sources, factors such as frequency of train, commuter movements, and the particles generated from other sources (e.g. silicon from crustal materials [38], iron from frictions between wheels, rails, collections shoes and third rail [38], ambient soil particles from the tunnels [62]) can influence particle concentration at belowground.
In a study on the exposure to PM2.5 and BC among different subway workers in South Korea, Choi et al. [63] found a strong correlation between PM2.5 and BC (r = 0.72) for subway train drivers in terms of job exposure, followed by the maintenance engineers (r = 0.61) and subway station managers (r = 0.4). In explanation of their findings, Choi et al. [63] mentioned, for the maintenance engineers and station managers, the varying type of the tasks and worksites can be significant factors for the overall exposure to PM2.5 and BC. The maintenance engineers are exposed to the highest concentration of PM2.5 and BC while working on the repair and maintenance of the belowground tunnels at night after their completion of other day-to-day activities depending on the needs. However, the train drivers are constantly exposed to the PM2.5 and BC while operating the subway trains for a longer period.
In comparing different subway stations, Luglio et al. [38] also found a strong correlation between belowground BC and PM2.5 (r = 0.6). In this study, we found that the correlation between PM2.5 and BC belowground was similar to the previous studies (r = 0.51, p < 0.05). This high correlation of BC and PM belowground suggests a similar source of PM such as combustion and iron-related particles. When a train enters the station, it may bring a draft of outside air along with these pollutants, but, unlike the outside environment, there is less opportunity for dispersion of polluted air belowground. While comparing different subway lines in New York City, Vilcassim et al. [26] found that the stations with a shorter distance between the belowground and aboveground had lower BC concentration than the stations with longer distance. Li et al. [64] found BC was higher at the platform than in the train cabs, and upon the train arrival, BC increased which showed the source of BC was from the piston effect of the train. The piston effect is a phenomenon generated by a train moving in a confined tunnel with a high-speed which creates air pressure in front of the train and decreases the air pressure behind the train. In short, the piston effect of the subway can bring pollutants to the belowground generated from outside sources. Vilcassim et al. [26] mentioned that the BC found in the belowground are not necessarily freshly emitted and can be re-entered by rapidly passing trains. Due to the structure of the sampling location, the higher concentration of BC belowground also relates to the passage of trains bringing particles emitted from combustion sources aboveground.
LimitationsDue to logistical limitations for conducting a long day of sampling, the sampling window excluded the extreme rush hours. One of the objectives of this study was to assess the cellular assays on particles collected, and it requires longer duration of sampling. The results from cellular assays will be presented on a separate paper. This data also represents only the conditions during weekdays. Data from weekends would further establish the trends of the pollutant concentration for the locations. Due to the variability in both the gravimetric and real-time measurements as well as the variability on day-to-day measurements, we did not use the correction of PM from dusttrak based on gravimetric measurement.
RecommendationsExposure of PM (PM1, PM2.5, PM10), UFP, and BC belowground were higher than the aboveground location and the suburban location. High PM concentrations (>100 µg/m3) may pose health risks to the travelers and workers at belowground subway stations. Therefore, control strategies are recommended to target reducing PM levels. Because of the confined structure in the belowground station, the trapped air has reduced opportunity to mix with clean and outside air. Improved and frequent mechanical ventilation can enhance such mixing. Implementing regular cleaning schedules for subway platforms can remove dust, litter, and debris from the tunnel walls as well as the belowground [28, 65] thus reducing the resuspension of these particles in air. Most importantly, frequent air circulation from the ventilation system along with regular cleaning of tracks and walls of the tunnels can significantly improve the air quality by reducing the resuspension of particles [58]. Enforcement of strict smoking bans and reducing passenger idling time within subway stations and platforms can also reduce the pollutant concentration in the underground space. In addition, installation of platform screen doors and HEPA filters in the ventilation can reduce pollutant exposure to the commuters and the workers. Martins et al. [58] reported in their study, installation of platform screen doors and separation of the rail track from the platform of a single tunnel station can reduce the belowground pollutant concentration by around 50% compared to the conventional systems (without platform screen doors). Since subways provide important services by reducing vehicle emissions and carrying a large number of passengers at a time, regular air quality monitoring of the underground stations can also help to check state of the indoor air quality, assess the factors/sources affecting air quality, and measure the effectiveness of future control strategies on improving air quality at underground subways.
留言 (0)