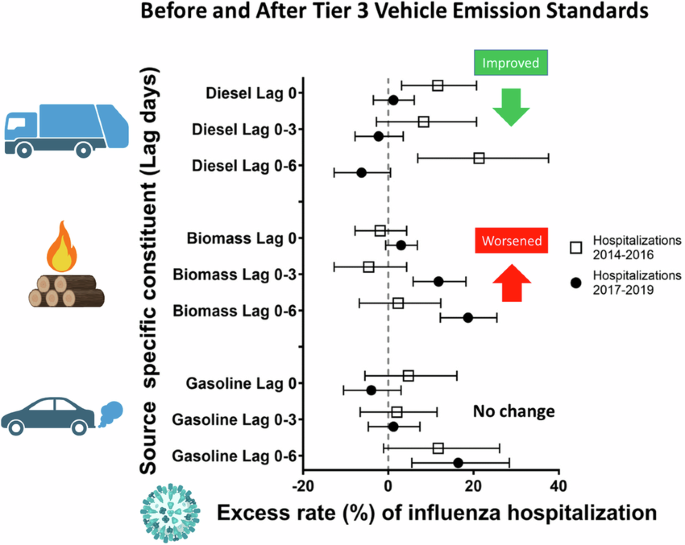
In this study of source-specific PM2.5 concentrations and influenza hospitalizations and emergency department visits in Rochester, NY, we estimated and compared the relative rate of influenza healthcare encounters associated with increased source-specific PM2.5, SOC, and POC concentrations both before (2014–2016) and after (2017–2019) Tier 3 vehicle emissions standards were implemented. As hypothesized, we observed a decrease in the rate of influenza hospitalizations and emergency department visits associated with increased DIE concentrations at all lag times in the 2017–2019 period compared to the 2014–2016 period. Unexpectedly, in the 2017–2019 period, we observed an increase in the rate of emergency department visits associated with spark-ignition/gasoline vehicle emissions (GAS) in the prior one week (lag days 0–6; compared to 2014–2016 period) and no change between periods at other lag times. A similar increase in the rate of healthcare encounters for influenza in the 2017–2019 period was observed for biomass burning, SS, POC, and SOC, but not other PM2.5 sources. The relative toxicity per unit mass of some of these PM2.5 sources may have been affected by implementation of the Tier 3 emissions standards and other prior emissions standards.
The need to examine the health effects of sources of PM2.5 is supported by our recent study on the effect of total PM2.5 on the rate of influenza healthcare encounters [22]. Despite reductions in overall PM2.5 concentrations during the early implementation period of the Tier 3 standards, the rates of influenza healthcare encounters associated with IQR increases in PM2.5 concentrations were not lower in the 2017–2019 period compared to the 2014–2016 period. As policy makers consider interventions to address specific sources of air pollution, the health effects of the remaining PM2.5 (which has a new relative composition) will require continued assessment.
Since the time of our prior study of source-specific PM2.5 and influenza [7] that reported increased rates of influenza hospitalization and emergency department visits associated with increased PM2.5, GAS, and DIE, the global COVID-19 pandemic redirected some of the environmental science community to focus environmental research on COVID-19 infection [23]. The uniqueness of the SARS-CoV-2 infection and its changing pandemic dynamics limited the applicability of the air pollution/COVID-19 studies to other seasonal respiratory viruses [24, 25]. Although there have been several studies estimating influenza/PM2.5 associations [4, 26], there have been few previous studies estimating associations between source-specific PM2.5 or PM2.5 constituents and influenza health care encounters [27]. In the interim from our prior source-specific study, a recent study in Guangdong Province, China observed a 2.8% increase in the relative risk of influenza infection associated with a 10 μg/m3 increase in PM2.5 concentrations in the 8 days prior to symptom onset [6]. Though only indirectly related to respiratory infection, an accountability study in Los Angeles, CA observed a decrease in risks of emergency department visits for asthma associated with increased PM2.5 constituents (organic carbon, sulfate, and nitrate) concentrations over time (2005–2016) [28]. Not all source-specific PM2.5 findings in our current study are consistent with these studies.
Our current study employed an improved PMF analysis to better apportion the aerosol resulting in differences between the effect estimates in the 2014–2016 period when comparing with our prior study source-specific/influenza study [7]. In this prior study we examined the association between increased source-specific PM2.5 (using the prior version of the PMF analysis) and influenza healthcare encounters in New York State from the same SPARCS database. Given the volume of data given the inclusion of three periods from 2005 to 2016 and the inclusion of culture negative pneumonia, we did not present the period-specific data in that study (only the total period). While the absolute values are not directly comparable, the trends in excess rates from 2014 to 2019 are important to compare. For example, the excess rates for GAS/influenza healthcare encounters decreased from 2005 to 2007 (ER 17%; 95% CI: 2.7, 33.3) to 2014–2016 (ER 6.1%; 95% CI: −2.4, 9.8) in lag days 0–6 (and similar pattern for lag days 0–3) (unpublished data). In the current study, rather than a trend of smaller excess rates over time, the excess rates for the GAS/influenza emergency department visit associations appeared similar (or larger) in the 2017–2019 period (ER = 23.9%; 95% CI: 17.6, 30.6) compared to the 2014–2016 period (ER 7.7%; 95% CI: 0.1, 15.8) for lag days 0–6.
The observation of a similar (or increased) relative rate for healthcare encounters for influenza associated with GAS in the 2017–2019 period compared to 2014–2016, despite the early implementation of the 2017 Tier 3 vehicle standards, is inconsistent with the hypothesis that Tier 3 vehicle standards could have reduced the toxicity per unit mass of the GAS component. Specifically, if the early implementation of the Tier 3 emissions standards decreased the secondary organic carbon (SOC) component of PM2.5, thereby reducing the oxidative potential of PM2.5, we would also expect to see a decrease in the rate of healthcare encounters for influenza associated with increased PM2.5 and GAS concentrations. The lack of reduction in the GAS/influenza association may be related to the incomplete fleet penetration of Tier 3 vehicles. While 36% of the current light duty vehicle fleet was purchased after 2017, we do not yet have data on what proportion of those vehicles met the Tier 3 standards (so the actual Tier 3 market penetration must be roughly 36% or lower) [29]. There may be other explanations including a change in the particle size distribution within GAS. The reduction in the mass of relatively less toxic particles such as secondary sulfate may have led to a relative increase in the toxicity per unit mass of the remaining sources. While the proportion of GAS consisting of UFP increased related in part to the 50% penetrance of gasoline direct injection in 2016, the change in toxicity related to this change will require further study.
In our prior study [7], the ERs for the DIE/Influenza emergency department visits were similar in the 2005-2007 period (ER 5.8% [95% CI: 2.6%, 9.0%]) compared to the 2014–2016 period (ER of 6.3% [95% CI 1.3%, 11.6%]) at the 0–6 lag days (unpublished data). In contrast, we observed a substantial decrease in the ER of the DIE/Influenza from 2014–2016 to the 2017–2019 period in the current study. The observed decrease in excess rates of influenza healthcare encounters associated with each 0.3–0.5 μg/m3 increase in DIE may be related to changes prior to the implementation of the 2017 Tier 3 vehicle standard. As a result of multiple diesel fuel related policies targeting the sulfur content of diesel, the concentrations of SO2 (and SS) have decreased [8]. Though NO2 decreased in part due to selective catalytic reduction (SCR) systems (required in new vehicles in 2010), the lack of reduction in SN concentrations may be related to an increase in ammonia that escapes the SCR system [30]. Since the Tier 3 vehicle emission standard predominantly addressed gasoline vehicles, it is unclear to what degree the early implementation of this regulation had the potential to reduce the toxicity per unit mass of DIE. Though not guaranteed, the toxicity of both DIE and GAS would be expected to continue to fall, as the emissions from both diesel and gasoline vehicles come below the recommended Tier 3 standard.
When considering non-traffic related PM2.5 sources, the increase in the rate of influenza healthcare encounters associated with BB concentrations in the 2017–2019 period, compared to the 2014–2016 period, may be related to a change in the characteristics of wildfire smoke or residential wood-burning smoke and/or their interaction with other pollutants in the outdoor atmosphere. While wildfire smoke has been suggested to comprise up to 25% of PM2.5 in the United States (and up to 50% in the Western U.S.) [31], the majority of BB comes from residential wood burning in the Rochester, NY area [32, 33]. The respiratory health effects of residential biomass burning are particularly difficult to study given the complexity of the factors that determine its emission profile including the condition of the fuel sources, efficiency of burning and ventilation of the indoor space [34]. It remains unclear which, if any, of these variables have changed in NYS to explain a change in relative toxicity in BB from residential wood burning. For wildfire smoke, climate change driven increases in outdoor temperature and reductions in humidity, combined with an increase in large diameter solid fuels (felled trees) due to high winds and draught or flooding is expected to lead to an increase in frequency, intensity and duration of wildfires [35]. Since the proportion of PM2.5 comprised of wildfire/biomass burning increases with further climate change, the reactive potential and toxicity per unit mass of PM2.5 may also increase [36, 37]. However, due to lower average temperature in New York State (NYS) compared to California, where the majority of the U.S. based literature focuses, we would expect less atmospheric reactivity, and potentially less toxicity, during studies similar to our current study in the winter months. Though wildfire smoke is not currently the dominant biomass source in NYS, the proportion of BB in NYS from wildfire smoke may increase in the future due to an expected increase in the frequency of dynamic weather patterns similar to the lingering low pressure system which led to significant biomass exposure in NYS from Canadian wildfires during the summer of 2023 [38]. Similar to the increased risk of hospitalization from asthma related to wildfire smoke, we may expect to see an increased risk of influenza associated with PM2.5 since the proportion of BB in NYS that comes from wildfire smoke increases [37].
Though the continued penetrance of Tier 3 vehicles into the New York State vehicle fleet is expected to result in a decrease in SOC [8], it is possible that the increase in organic carbon from wildfire activity over time will contribute more SOC to PM2.5 [39], thereby stabilizing SOC concentrations. The increase in rates of influenza healthcare encounters associated with increased SOC concentrations in 2017–2019 compared to 2014–2016 may indicate an increase in toxicity per unit mass of SOC. This pattern is the same as the main contributors to SOC, gasoline vehicle emissions (GAS) at lag days 0–6, and biomass burning. While we also observed an increased rate of influenza hospitalizations and emergency department visits with secondary sulfate (SS) (except for the 0–6 time period for hospitalization), due to the role of SS as a vector for a heterogeneous collection of condensates, the health effect of specific secondary sulfates remains uncertain [40]. Since the majority of PM2.5 is from inorganic and organic secondary aerosols (i.e. SIA and SOA), the reactivity of each constituent PM2.5 source such as traffic related air pollution (DIE and GAS) and biomass burning have been found to be more similar to the higher oxidative potential of SOC than the less reactive POC [12, 41]. For a viral infection like influenza, PM2.5 constituents with high oxidate potential (e.g. DIE, GAS and BB) have the potential to enhance viral entry into cells, impair pathogen recognition, immune signaling, and immune cell function [14].We will need to continue to focus future studies on the potential pathophysiologic mechanisms of the association between PM2.5 and influenza healthcare encounters and what collection of sources appear to be the main drivers of this association.
Inequity in both exposure to PM2.5 and treatment for influenza exist in the U.S. Our study observed that a higher proportion of Black and Hispanic patients with influenza were treated and released from the ED (48% and 27% respectively) compared to those who were admitted (30% and 19% respectively). Our patient proportions are not consistent with national data observing the odds of hospitalization (including intensive care) and death for influenza are higher in Black, Hispanic, and Asian patients when compared to white patients [42]. It is also well known that Black and Hispanic communities suffer a disproportionate burden of traffic related air pollution [43]. These two facts combine to increase the risk of a poor outcome from influenza infection in Black and Hispanic communities when compared to White communities. In a future analysis, we will need to consider how the difference in our local healthcare practice patterns and geographic distribution of source-specific PM2.5 may affect the association between PM/influenza in different racial and ethnic communities.
Although there were several strengths of this study, including a large sample size and inclusion of the 4 largest cities in New York State, there are several limitations that should be considered when making inference. First, there is likely exposure misclassification and downward bias resulting from assignment of the same air pollutant concentrations for everyone within 15 miles of an individual monitor (e.g., Buffalo), no matter how far they live from the monitoring station. Second, this study was a wintertime study given the seasonality of influenza infection, limiting the generalizability to year-round respiratory infections or bacterial respiratory infections. Last, to be consistent with our previous analyses, we used a case-crossover design and conditional logistic regression analyses to estimate the rate of influenza hospitalizations and emergency department visits associated with source-specific PM2.5, SOC, and POC concentrations in the previous 7 days. However, as described in our previous analysis of influenza/PM2.5 associations in these same cities, we cannot assess lag periods longer than 7 days without overlap of case and control period dates and thus case and control period pollutant concentrations [22]. Thus, we are limited to assessment of pollutant concentrations in just the previous 1–7 days. Last, the study population is only adult residents, and not children, and only those adults living in urban centers of the state (i.e., within 15 miles). Thus, generalizability of results to children or to adult residents in rural locations is less certain.


留言 (0)