
記住我
Head-and-neck squamous cell carcinoma (HNSCC) is one of the most common type of head and neck cancer worldwide and constitutes approximately one-third of all cancer cases from India1. Along with tobacco, differential human papillomavirus (HPV) [high risk(hr)-HPV 16/18] infection rate (0-86.6%), irrespective of anatomical sub-sites, has also been reported to be a major etiological factor2, 6. It appears that recurrent exposure of stem cell-like cells in the basal/parabasal layers of normal oral epithelium to HPV infection or tobacco-associated carcinogens might promote alteration in the intracellular environment, such as oxidative stress response, leading to activation of hypoxia response pathway, which is directly involved in cancer development and progression2,7, 9. The hypoxia response pathway is characterized by the stabilization of hypoxia-inducible factor1α (HIF1α) protein and vascular endothelial growth factor (VEGF) overexpression, plays a prominent oncogenic role in HNSCC development along with various other solid tumours10,11. Escalating over-expression of HIF1α (15-50%) has been noted during HNSCC progression, resulting in adverse prognosis12. Additionally, VEGF, responsible for angiogenesis, has been reported to be overexpressed in 90 per cent of the HNSCC samples, indicating its correlation with disease progression, chemoresistance and poor survival13. It is well reported that Von Hippel–Lindau (VHL) ubiquitinates HIF1α within the nucleus through its interaction with LIMD1 as a bridging protein, followed by cytoplasmic transportation of the protein complex for HIF1α degradation that subsequently results in reduced expression of VEGF11,14,15. Frequent inactivation of LIMD1 and VHL in different sets of HNSCC samples have been reported16,17 along with LIMD1 alterations (mutation, methylation/deletion), reduced mRNA and protein expression18,19. Similarly, loss of heterozygosity (52-67%) at chromosomal location 3p25, residing position of VHL, has been reported in HNSCC20. While null or low expression of VHL was noted in 63 per cent of the tongue cancer samples irrespective of VHL allelic alterations17. Therefore, HIF1α regulation is indisputably a crucial aspect linked to both the development as well as progression of HNSCC. In addition, HPV infection adds scope of alternative molecular features within HNSCC, resulting in heterogeneity within this tumour21. However, the role of the hr-HPV infection in the modulation of HIF1α regulation during HNSCC development has not yet been evaluated in detail.
This study focussed on investigating the comparative expression patterns of HIF1α pathway-associated and regulatory genes in different HNSCC datasets in association with or without HPV infection, followed by validation of the data at gene expression (RNA and protein) and epigenetic level in the independent HNSCC sample set of different clinical stages. It was found that HPV infection shows a distinct effect on the HIF1α regulation in HNSCC samples.
Material & MethodsThis study was undertaken at the Department of Oncogene Regulation, Chittaranjan National Cancer Institute (CNCI), Kolkata after appropriate approval of the Institutional Ethical Committee and hospital authorities.
Sample collectionFreshly operated tumour tissues (n=62) and corresponding adjacent normal oral epithelium (n=58) were collected from 62 inpatients from the hospital section of CNCI, Kolkata. The collected tissues were divided to use for (i) immunohistochemical analysis by formalin fixation followed by paraffin embedding, (ii) RNA isolation and (iii) DNA isolation (Supplementary Fig. 1). Tumour grading and staging were done by two independent pathologists and clinicopathological information was collected.
Detection of human papillomavirus (HPV) 16 and 18HPV infection was detected by polymerase chain reaction (PCR) technique, using MY09 and MY11 primers from the consensus L1 region of virus in the samples. HPV 16/18 typing analysis was done using type-specific primers from the E6 region of HPV 16 and the LCR region of HPV 1822 (Supplementary Table I).
Quantitative analysis of mRNA expressionTotal RNA was isolated from primary HNSCC tissue samples (n=30) and their adjacent normal oral tissues (n=30), using TRIzol reagent as manufacturer’s instructions (Invitrogen, USA) (Supplementary Fig. 1). To perform reverse transcription for cDNA preparation, 1 μg of total RNA was used along with Random hexamer (Invitrogen, USA) and M-MuLV-Reverse Transcriptase (Promega, USA)22. Real-time PCR was done using SYBR Green Master Mix (Invitrogen, USA) as described earlier22. Fold expression change (2-ΔΔCT) was used to measure the relative expression of the genes against β2 microglobulin for normalization and was plotted on a log scale23, where ≥0.2 was considered as overexpression, ≤ - 0.2 as underexpression threshold and the range in between as no change (Supplementary Table I and II)
Protein expression analysis by immunohistochemistryProtein expression of HIF1α, VHL, LIMD1 and VEGF was studied by immunohistochemistry in the adjacent normal oral epithelium (n=58) and the corresponding HNSCC tissues (n=62) (Table I and Supplementary Fig. 1), which were sectioned at 5 μm thickness. The tissue sections (paraffin-embedded/cryosections) of HNSCC as well as the normal adjacent tissue were incubated overnight with primary antibodies against HIF1α (sc-53546), VHL (sc-5575), LIMD1 (mouse monoclonal) and VEGF (sc-507) at a dilution of 1:100 at 4°C. Next, the HRP conjugated secondary antibodies, namely anti-mouse (sc-2005) and anti-rabbit (sc-2004) were used at 1:500 dilution each. 3, 3’ diaminobenzidine (DAB) was used for chromogenic reaction and counterstained with haematoxylin. Slides were photographed under a Bright Field microscope (Leica DM1000, Germany) and evaluation was done according to method followed by Perrone et al24, where two independent observers grade the staining intensity as weak, moderate, or strong along with the percentage of positive cells. The final protein expression was reported as 0-2=low, 3- 5=intermediate, 6-7=high24.
Table I. Demography of the patients with reference to human papillomavirus infection status
Features n(%) HPV 16 +ve, n(%) –ve, n(%) P Total 62 30 (48) 32 (52) Age, mean±SD 52±13.37 Mean≤ 30 (50) 17 (57) 13 (43) 0.21 Mean> 32 (52) 13 (41) 19 (59) Gender Male 39 (63) 20 (51) 19 (49) 0.55 Female 23 (37) 10 (43) 13 (57) Primary site BM 28 (45) 9 (32) 19 (68) 0.077 TNG 10 (16) 5 (50) 5 (50) ALV 9 (15) 5 (56) 4 (44) Oropharynx 11 (18) 7 (64) 4 (36) Larynx 4 (6) 4 (100) 0 (0) TNM stage I 16 (26) 9 (56) 7 (44) 0.19 II 13 (21) 7 (54) 6 (46) III 17 (27) 10 (59) 7 (41) IV 16 (26) 4 (25) 12 (75) Grade Mild/WDSCC 39 (63) 23 (59) 16 (41) 0.09 Moderate/MDSCC 14 (23) 4 (29) 10 (71) Poor/PDSCC 9 (14) 3 (33) 6 (67) Node +ve 26 (42) 16 (62) 10 (38) 0.078 –ve 36 (58) 14 (39) 22 (61) Tobacco +ve 39 (63) 20 (51) 19 (49) 0.55 –ve 23 (37) 10 (43) 13 (57) Microdissection and DNA extraction(i) Microdissection of the malignant lesions was done for tumour region enrichment (>60%), using surgical knives under a dissecting microscope (Leica MZ16, Germany). The genomic DNA was isolated from the tissues as per routine protocol, described earlier22. The concentration of DNA was measured spectrophotometrically (Supplementary Fig. 1). (ii) The layer-wise promoter methylation analysis was done by using laser capture microscope (LCM, Palm microbeam, Zeiss, Germany) in normal oral epithelium, (n=30), following serial sectioning (paraffin/cryosections) and Haematoxylin-Eosin staining to identify basal/parabasal and spinous layers as described previously22. DNA was isolated from each layer according to the standard procedure22. (Supplementary Fig. 1).
Promoter methylation analysisIn order to study the epigenetic alterations, the promoter methylation analysis of VHL and LIMD1 genes was performed in 30 composite oral epithelium samples, separated basal/parabasal (n=30) and spinous layer (n=30) from the same normal samples as mentioned above and corresponding HNSCC tumour tissues (n=30) as used in the RT-PCR analysis. The promoter methylation status was analyzed by PCR-based methylation-sensitive restriction analysis (MSRA). HpaII (CCGG) restriction enzyme (Promega, Fitchburg, WI) was used to target the CpG‐rich islands in the promoter regions of the genes22. The 445 bp fragment of the β-3A adaptin gene (K1) and the 229 bp fragment of RARβ2 (K2) served as controls for digestion and integrity, respectively22 (Supplementary Table I and II).
Statistical analysisTo determine the risk associated with gene expression and other clinicopathological factors, Fisher’s exact test was applied. All statistical tests used were 2-tailed and a significant level was considered at probability value, P<0.05. Kaplan–Meier method, followed by the Log-rank test, was used to plot survival curves. A multivariate Cox-proportional hazard regression model was used in order to test potential prognostic factors. Hazard ratio was then estimated for each potential prognostic factor with a 95 per cent confidence interval. All calculations were done using software Epi Info 7 (CDC, Atlanta) and IBM SPSS 23 (SPSS, Chicago, IL, USA).
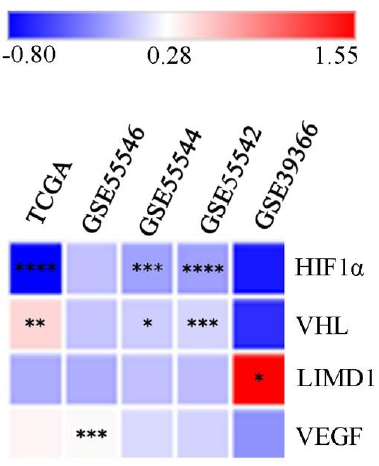
Bioinformatics analysisThe differential mRNA expression pattern of the genes between HPV positive (HPV+ve) and HPV negative (HPV–ve) samples was data mined from HNCDB database25 (http://hncdb.cancerbio.info). Five datasets: TCGA (HNSCC), GSE55542, GSE55544, GSE55546 and GSE39366 were used. The log fold change of the expression in HPV+ve samples with respect to HPV–ve samples was plotted on a heatmap for better visualization and understanding25.
Results Human papillomavirus (HPV) prevalence in the samplesThe HPV infection was seen in 48 per cent (30/62) of the samples irrespective of clinical stages (Table I). Only HPV16 type was identified among the infected samples (Supplementary Fig. 2). Larynx (100%, 4/4) and oropharynx (64%, 7/11) subsites showed maximum infection rate, followed by alveolus (56%, 5/9), tongue (50%, 5/10) and buccal mucosa (32%, 9/28) subsites (Table I). HPV infection frequency was comparable between early-stage (stage I/II) (55%, 16/29) and late-stage (stage III/IV) (42%, 14/33) tumours (P=0.324) (Table I). In the case of tumour grade, node positivity and tobacco usage, HPV infection did not show any significant association (Table I).
Expression profile of the hypoxia-inducible factor-1α (HIF1α) pathway associated genes Different head-and-neck squamous cell carcinoma (HNSCC) datasetsThe comprehensive data mining from the HNCDB database in HPV+ve and HPV–ve HNSCC samples showed a differential expression pattern of HIF1α (log fold change –0.8 to 0.11). Interestingly, significantly low HIF1α expression was noted in HPV+ve samples in three of the datasets (GSE55544, GSE55542 and TCGA) (Fig. 1, Supplementary Fig. 3A and Supplementary Table III). Similarly, significant low expression of VHL (log fold change: –0.07 to 1.55) and LIMD1 (log fold change: –0.61 to –0.48) were evident in HPV+ve samples in three of the datasets (GSE55544, GSE55542, TCGA) and one dataset (GSE39366), respectively (Fig. 1, Supplementary Fig. 3B, C and Supplementary Table III). On the other hand, VEGF (log fold change: –0.19 to 0.33) showed significantly higher mRNA expression in HPV+ve samples in a single dataset (GSE55546) (Fig. 1, Supplementary Fig. 3D and Supplementary Table III).
Export to PPT
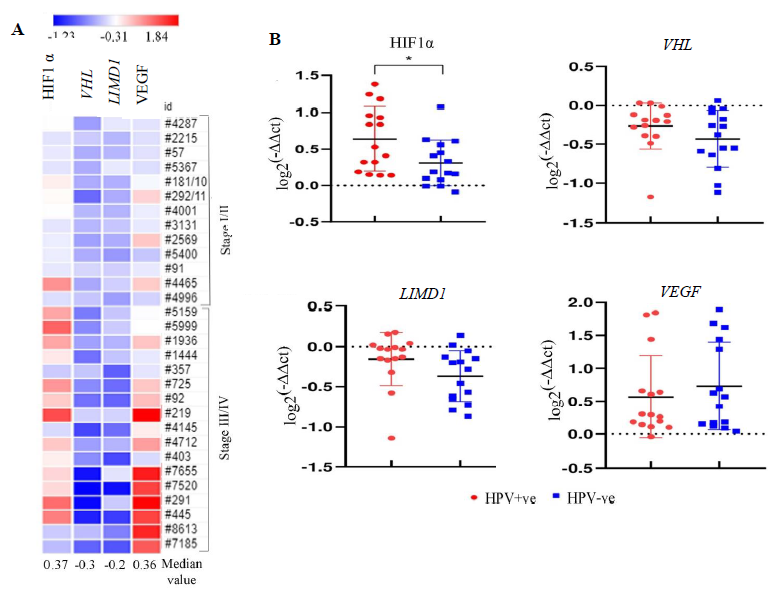
Primary head-and-neck squamous cell carcinoma (HNSCC) samplesOf the HNSCC samples (n=30), overexpression of HIF1α and VEGF with 0.36 and 0.37 median log-fold changes was seen, respectively, with gradual increase with the advancement of the disease (Fig. 2A). However, reduced expression in VHL (-0.3 fold change) and LIMD1 (-0.2 fold change) was noted in the samples with continuous downregulated expression with the disease progression (Fig. 2A). Interestingly, the expression of HIF1α was significantly higher in HPV+ve HNSCC than in the HPV–ve HNSCC samples (P=0.025); whereas VHL (P=0.182), LIMD1 (P=0.083) and VEGF (P=0.493) expression was comparable in between HPV+ve and HPV–ve HNSCC samples (Fig. 2B and Supplementary Table IV).
Export to PPT
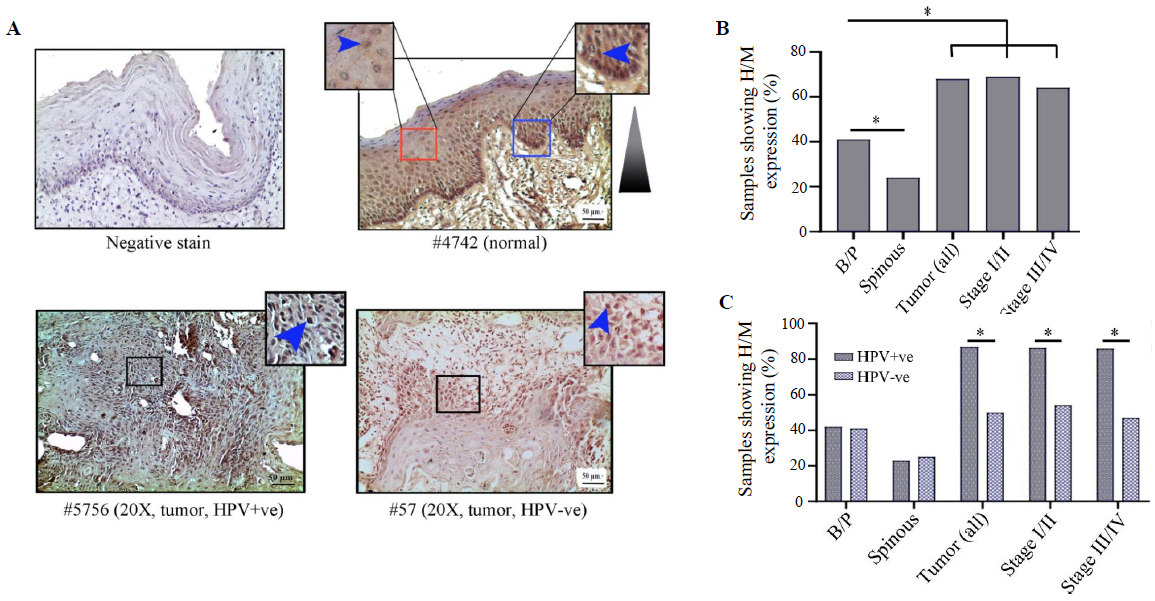
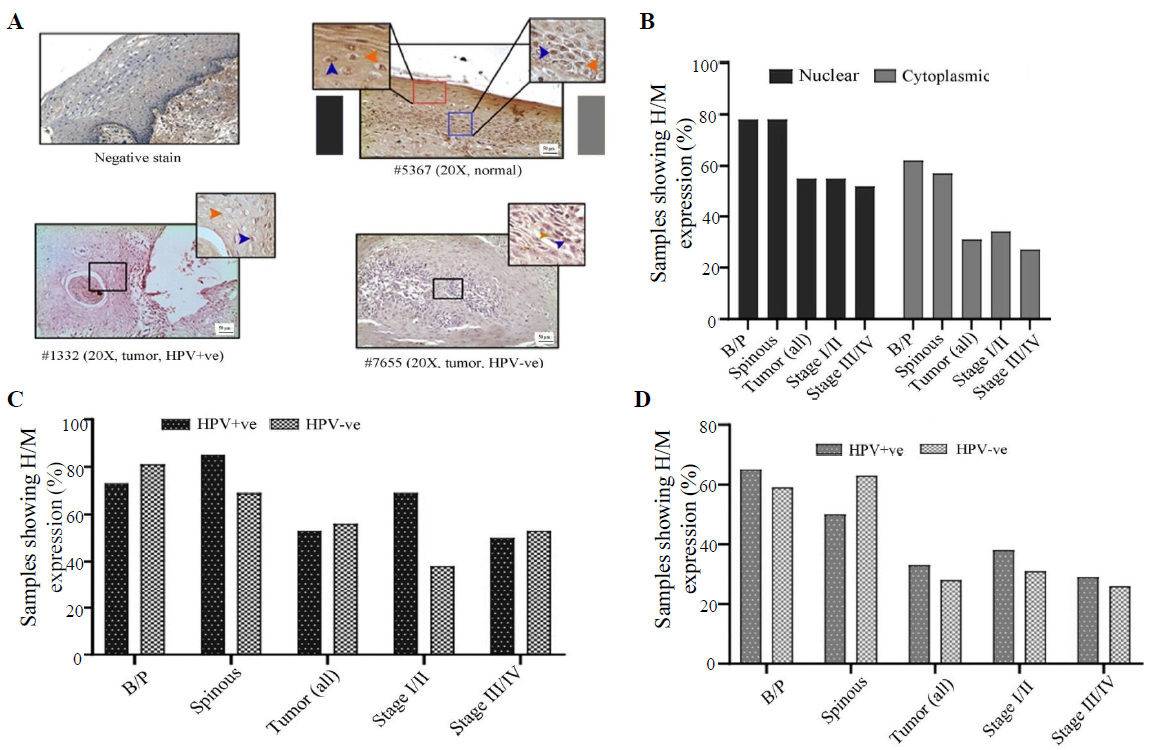
Expression analysis of HIF1α/LIMD1/ VHL/ VEGF proteins in samples HIF1α expression profileHIF1α showed distinct nuclear expression in the tissues. The basal/parabasal expression (43%, 25/58) was significantly higher than the spinous layer (24%, 14/58) (P=0.03) (Fig. 3A and B). The tumours showed substantially higher expression (68%, 42/62) than the basal/parabasal layers (P=0.006) (Fig. 3A, B and Supplementary Table V). Further, the distribution of tumours in early (stage I/II) and late (stage III/IV) stages demonstrated comparable high/medium (H/M) expression pattern in 72 per cent (21/29) and 64 per cent (21/33) of the samples, respectively (Fig. 3B).
Export to PPT
The expression profile of HIF1α was comparable in both HPV+ve and HPV–ve basal/parabasal as well as spinous layers of the normal oral epithelium (Supplementary Table V), whereas HPV+ve tumour samples (87%, 26/30) showed significantly higher expression in comparison to the HPV–ve tumour samples (50%, 16/32) (P=0.002) (Fig. 3C and Supplementary Table V). A similar expression pattern was also noted with the progression of the disease in HPV+ve vs. HPV–ve samples, i.e. stage I/II (88% 14/16 vs. 54%, 7/13, P=0.045) and stage III/IV (86%, 12/14 vs. 47%, 9/19, P=0.023), respectively (Fig. 3C).
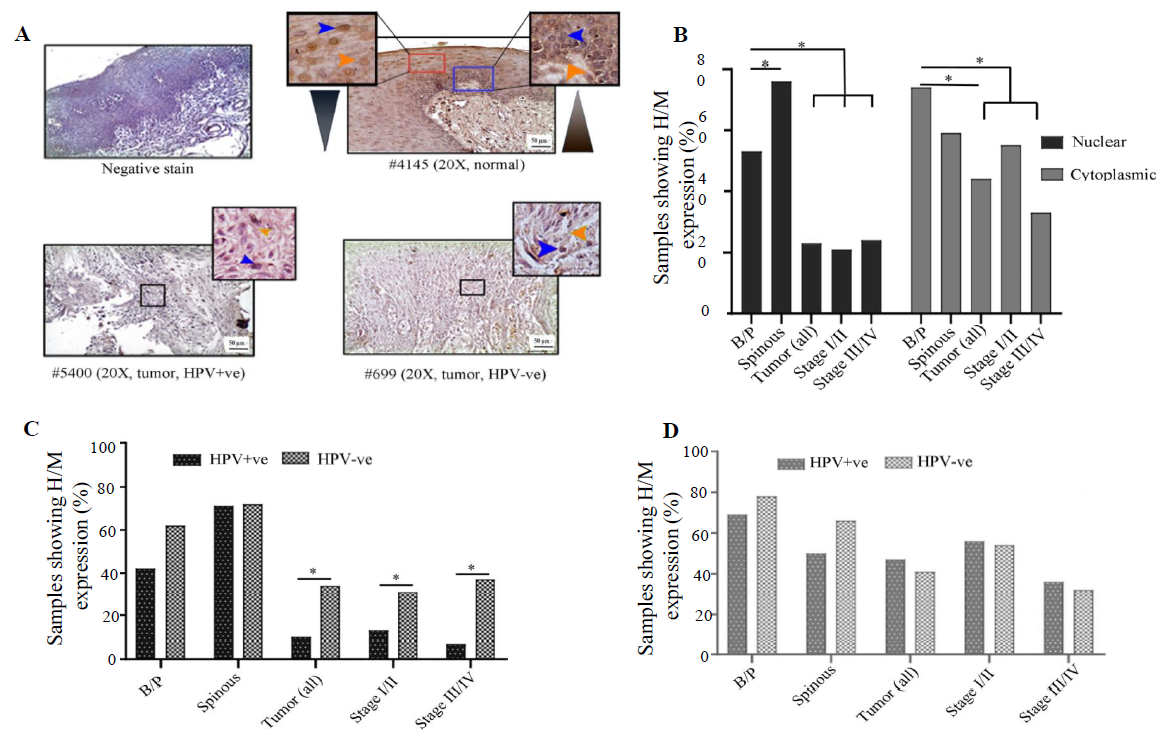
VHL expression profileVHL showed differential subcellular expression patterns between basal/parabasal and the spinous layers of normal oral epithelium (Fig. 4A and B). It was noted that the proliferating basal/parabasal layers had predominant high/medium cytoplasmic expression (74%, 43/58) than the nuclear compartment (53%, 31/58) (Fig. 4A, B and Supplementary Table V). Contrastingly, cells in spinous layers showed prevalent high/medium nuclear expression (71%, 44/62) than the cytoplasmic subcellular location (55%, 34/62) (Fig. 4A, B and Supplementary Table V). The signature expression pattern of VHL in the basal/parabasal layers was noted in tumour samples but in significantly lower frequency with 44 per cent (27/62) cytoplasmic (P=0.0006) and 23 per cent (14/62) nuclear expression (P=0.0004) (Fig. 4A, B and Supplementary Table V). It was also noted that the nuclear expression (stage I/II: 21%, 6/29 and stage III/IV: 24%, 8/33) remained comparable (P=0.74), but the cytoplasmic expression (stage I/II: 55%, 16/29 and stage III/IV: 33%, 11/33, P=0.086) of VHL decreased with the progression of the disease (Fig. 4A and B).
Export to PPT
HPV infection status-specific expression analysis showed that nuclear expression in both HPV+ve and HPV–ve basal/parabasal (HPV+ve: 42%, 11/26 and HPV–ve: 63%, 20/32; P=0.13) and spinous layers (HPV+ve: 70%, 21/26 and HPV–ve: 72%, 23/32; P=0.44) of normal oral epithelium were comparable (Fig. 4C and Supplementary Table V). Similarly, cytoplasmic expression of the basal/parabasal (HPV+ve: 69%, 18/26 and HPV–ve: 78%, 25/32; P=0.45) and spinous layers (HPV+ve: 50%, 13/26 and HPV–ve: 66%, 21/32; P=0.24) were also uniform in both the groups i.e. HPV+ve and HPV–ve (Fig. 4D and Supplementary Table V). In the case of tumour tissues, nuclear expression was significantly low in HPV+ve (10%, 3/30) than the HPV–ve samples (34%, 11/32) (P=0.022) in different clinical stages (Fig. 4C and Supplementary Table V). However, cytoplasmic expression of VHL was comparable between HPV+ve (47%, 14/30) and HPV–ve (41%, 13/32) tumour samples regardless of the progression of the disease (Fig. 4D and Supplementary Table V).
LIMD1 expression profileIn normal oral epithelium uniform nuclear (both basal/parabasal and spinous: 78%, 45/58) and cytoplasmic (basal/parabasal: 62%, 36/58; spinous: 60%, 35/58), the expression of LIMD1 was noted (Fig. 5A, B and Supplementary Table V). In tumours, only 55 per cent (34/62) of the samples showed high/medium nuclear expression, which was significantly low in comparison to basal/parabasal layers (P=0.0084) (Fig. 5A, B and Supplementary Table V). Stage-specific distribution showed comparable high/medium nuclear expression (stage I/II: 59%, 17/29 and stage III/IV: 52%, 17/33; P=0.58) (Fig. 5B). Similarly, only 31 per cent (19/62) of the tumours showed high/medium cytoplasmic expression, which was considerably lower than the cytoplasmic expression of basal/parabasal layers (P=0.018) and the expression pattern also gradually decreased with the progression of the disease (stage I/II: 34%, 10/29 and stage III/IV: 27%, 9/33; P=0.55) (Fig. 5A and B).
Export to PPT
The expression pattern depending on HPV infection status showed that nuclear expression in basal/parabasal (HPV+ve: 73%, 19/26 and HPV–ve: 81%, 26/32; P=0.47) and spinous layers (HPV+ve: 85%, 22/26 and HPV–ve: 72%, 23/32; P=0.17) of normal oral epithelium were comparable (Fig. 5C, D and Supplementary Table V). Similar result was obtained for the cytoplasmic expression of LIMD1 in basal/parabasal (HPV+ve: 65%, 17/26 and HPV–ve: 59%, 19/32; P=0.65) and spinous layers (HPV+ve: 50%, 13/26 and HPV–ve: 69%, 22/32; P=0.35) (Fig. 5C, D and Supplementary Table V). The nuclear (HPV+ve: 53%, 16/30 and HPV–ve: 56%, 18/32; P=0.82) and cytoplasmic (HPV+ve: 33%, 10/30 and HPV–ve: 28%, 9/32; P=0.66) expression of LIMD1 was also found to be comparable in both HPV+ve and HPV–ve tumour samples (Fig. 5C, D and Supplementary Table V), even when the tumours were distributed according to the stage (stage I/II and stage III/IV) (Fig. 5C and D).
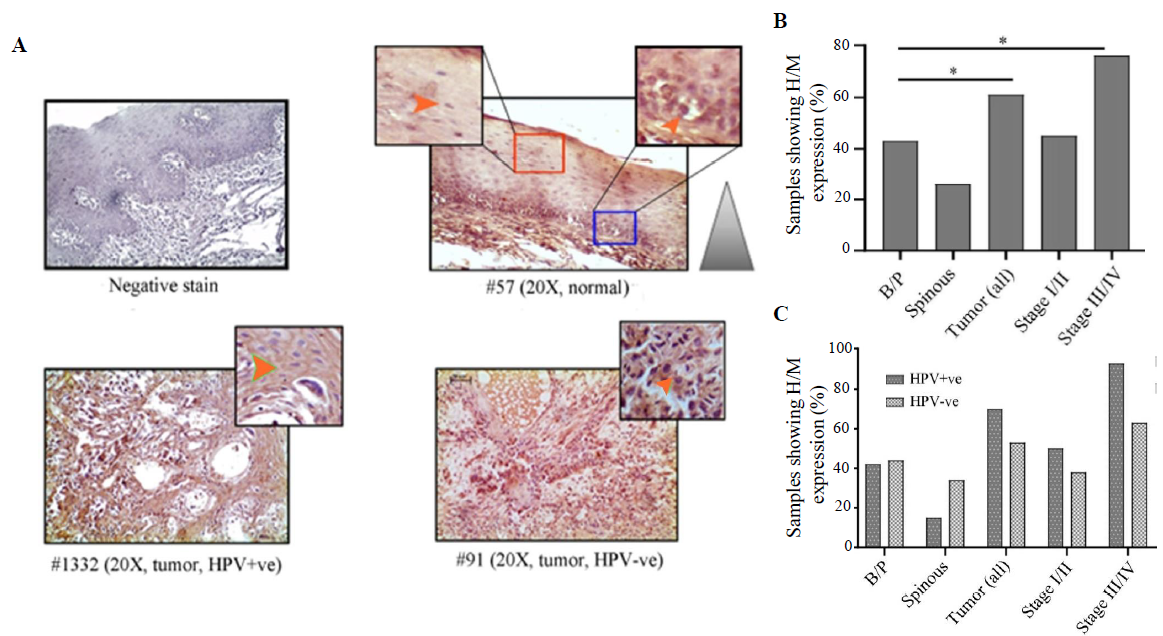
VEGF expression profileVEGF expression was restricted in cytoplasm in both normal oral epithelium and tumours. It was noted that 43 per cent (25/58) and 24 per cent (14/58) of the samples showed high/medium cytoplasmic expression in basal/parabasal and spinous layers in normal oral epithelium, respectively (P=0.051) (Fig. 6A, B and Supplementary Table V). However, 61 per cent (38/62) of the samples showed high/medium cytoplasmic expression in tumours, which was significantly different from basal/parabasal layers (P=0.04) (Fig. 6A, B and Supplementary Table V). The stage-specific distribution showed 45 per cent (13/29) and 76 per cent (25/33) high/medium expression in stage I/II and stage III/IV tumour samples, respectively (P=0.012) (Fig. 6B).
Export to PPT
It was found that HPV+/–ve basal/parabasal (HPV+ve: 42%, 11/26 HPV–ve: 44%, 14/32; P=0.91) and spinous (HPV+ve: 15%, 4/26 HPV–ve: 34%, 11/32; P=0.1) layers of oral epithelium showed comparable cytoplasmic expression (Fig. 6C and Supplementary Table V). In the case of tumours, 70 per cent (21/30) of the HPV+ve samples and 53 per cent (17/32) of the HPV–ve samples showed high/medium VEGF expression (Fig. 6C and Supplementary Table V). However, the difference in the expression pattern between HPV+ve and HPV–ve groups was not significant (P=0.18). However, the expression pattern was distinctly different between HPV+ve (93%, 13/14) and HPV–ve (63%, 12/19) tumours in late-stage (stage III/IV) (P=0.051) than the early-stage (stage I/II) tumours (HPV+ve: 50%, 8/16; HPV–ve: 38%, 5/13; P=0.55) (Fig. 6C).
Association between HIF1α, LIMD1, VHL and VEGF proteins based on expressionIt was found that high HIF1α protein expression in the nucleus was significantly correlated with reduced nuclear expression of VHL (r=-0.45, P=0.002) and high expression of VEGF (r=0.037, P=0.003) in tumour samples. However, no such association was noted between the nuclear expression of HIF1α and LIMD1 (r=0.072, P=0.58) in the tumour tissues (Supplementary Fig. 4).
Methylation status of VHL and LIMD1 genes in the samplesIn normal oral epithelium, the overall methylation frequency of VHL was seen in 17 per cent (5/30) of the samples (Fig. 7Ai and ii) with a gradual decrease from basal/parabasal (39%, 11/28) to spinous layers (29%, 8/28) (Fig. 7Ai and ii). Like the basal/parabasal layers, high methylation in VHL (60%, 18/30) was seen in the tumours (P=0.12) (Fig. 7Ai and ii). However, the promoter methylation pattern of VHL was comparable in basal/parabasal, spinous and composite normal samples irrespective of HPV infection (Fig. 7A-iii). Similarly, comparable methylation frequencies were also noted in HPV+ve (53%, 8/15) and HPV–ve (67%, 10/15) tumours (P=0.47) (Fig. 7Aiii).
留言 (0)