
記住我
The term cardiovascular diseases (CVDs) includes a spectrum of diseases related to the heart and blood vessels. They are a leading cause of mortality and morbidity worldwide, with the prevalence doubling in the past three decades1. CVDs, especially ischemic heart disease (IHD) and stroke, account for almost half of all non-communicable disease (NCD)-related deaths in low- and middle- income countries (LMICs). India, which is undergoing a rapid epidemiological transition, is also facing a huge burden of CVDs. Having the world’s second-largest population, the prevalence of IHD and stroke in absolute numbers (IHD: 23.8 million, stroke: 6.5 million) in India is alarming2. Though India has an advantage in the demographic dividend, the growing burden and cost of NCDs in young adults, especially CVDs, could upset that. For example, the CVD-related medical expenditure in 2010 was estimated to be 7.5 billion dollars3.
However, this rising incidence of CVDs can be prevented by a number of strategies, such as population-wide reduction in the prevalence of CVD risk factors (primary prevention) and primary prevention among individuals with high CVD risk. A number of risk prediction tools have been developed to identify individuals with high CVD risk. The Framingham risk score was the first CVD risk prediction tool developed from the Framingham heart study4. Later, multiple CVD risk prediction tools, such as the Reynolds risk score, QRISK and PROCAM, were devised and are now in use5-7. However, these tools have primarily been developed based on studies conducted in high-income Western countries, which may not be applicable to the Indian population. In 2007, the World Health Organization (WHO), in collaboration with the International Society of Hypertension (ISH), developed cardiovascular disease (CVD) risk prediction charts for 14 different WHO epidemiological regions8. These charts incorporate several risk factors, such as blood cholesterol and blood glucose levels, which can limit their usability in resource-limited settings. In 2019, WHO released the updated laboratory-based and non-laboratory-based CVD risk prediction charts9.
Given the complex nature of CVDs, prioritizing total CVD risk management proves more cost-effective than focusing on individual risk factors. Assessing population-wide total CVD risk helps identify different risk levels, enabling timely interventions (e.g., drug treatments, lifestyle management) to prevent CVD development. Recent WHO updates to CVD risk prediction charts in 2019 address limitations in applicability to LMICs, improving accuracy for each of the 21 global regions defined by the Global Burden of Diseases study. The non-laboratory-based risk prediction chart utilizes only age, gender, smoking, systolic blood pressure and body mass index (BMI) for risk calculation. Based on these risk factors, the CVD risk of an individual is stratified into very low (<5%), low (5 to <10%), moderate (10 to <20%), high (20 to <30%) and very high (≥30%)10.
In the Indian context, the limited use and availability of laboratory testing for CVD risk factors makes the non-laboratory-based CVD risk estimation chart developed by WHO an ideal way for initial risk estimation and further referral of high-risk individuals. However, there are lack of national studies that estimated the population-level CVD risk in India based on the non-laboratory tool. Therefore, the main aim of this study was to assess the distribution of 10-yr CVD risk among adults at the population level in India. This was attained by utilizing the WHO’s non-laboratory-based CVD risk estimation tool in a national survey that included a representative sample of older adults (aged 40-69 yr) in India11. We also aimed to find the factors related to elevated 10-yr CVD risk (≥10%) in the same population.
Material & MethodsThis study was conducted at ICMR-National Centre for Disease Informatics and Research (ICMR-NCDIR, Bengaluru, India). The survey received approval from the ICMR-NCDIR Institutional Ethics Committee (IEC) and respective survey implementing agencies IECs. Informed consent was obtained from subjects aged 18-69 yr.
Study design and study populationThis is a secondary analysis of the data from the National Noncommunicable Disease Monitoring Survey (NNMS) ( https://www.ncdirindia.org/nnms/), which was a population-based cross-sectional survey conducted in 2017-2018. The primary objective of the survey was to generate estimates of important NCD-related indicators at the national level. The survey adopted a stratified multistage sampling design as per the 2011 Census of India to make the sample nationally representative.
The detailed methodology of the survey is provided elsewhere11. Additionally, the findings of other NCDs prevalence and their risk factors have been published earlier12-15. CVD risk algorithms have been developed by five-year age groups ranging from 40 to 74 yr of age9, mirroring the population targeted in primary prevention efforts for CVD. Using the WHO CVD risk non-laboratory-based charts for southeast Asia, the risk score was calculated for individuals aged 40-69 yr who participated in the NNMS survey16.
Tools and data collectionData collection involved using adapted questionnaires from WHO-STEPS17 and the global adult tobacco survey-India18 tools for the Indian context. Physical Activity questions were derived from the WHO-Global Physical Activity Questionnaire14. The survey, available in English and translated into 11 Indian languages, was conducted by trained investigators, monitored by supervisors and utilized the Kish grid method approach for representative results across age groups and genders. Standard procedures and calibrated equipment were used for physical measurements, including blood pressure and body mass index. Three blood pressure measurements were recorded in a seated position with a five-minute resting interval between the measurements, and the average of the last two readings was considered12
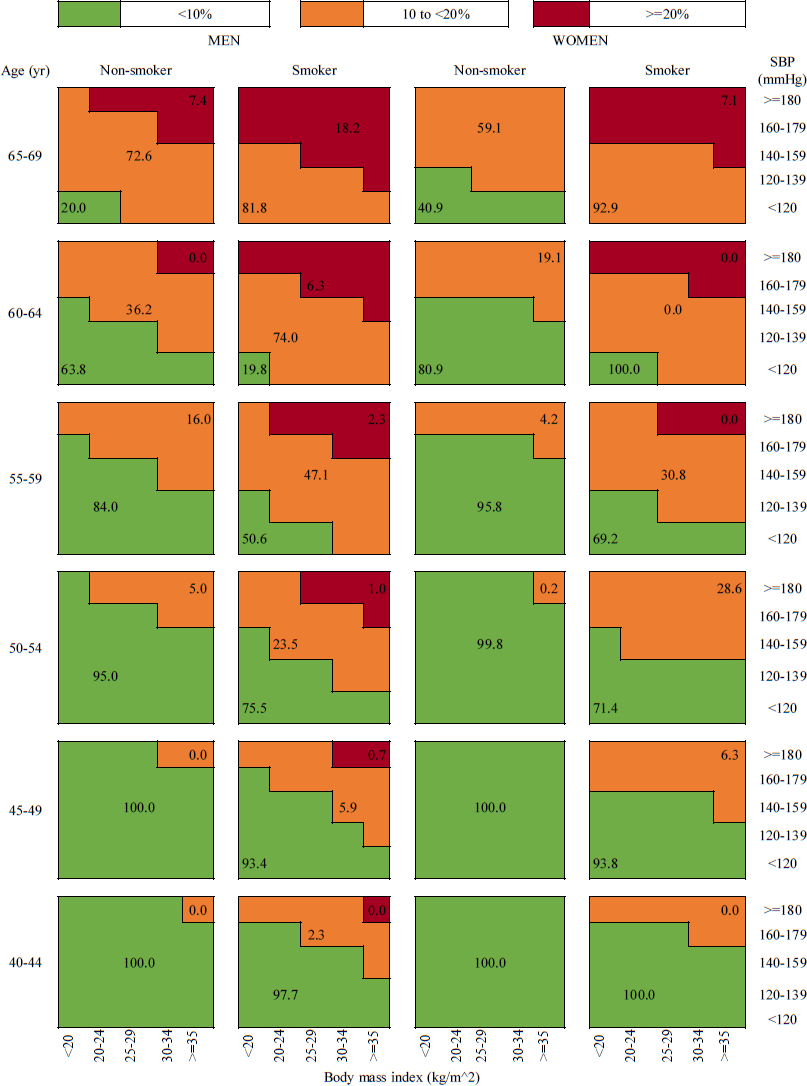
CVD risk score estimationWHO CVD-risk non-laboratory-based charts developed for southeast Asian countries, including India, were used to estimate the 10-yr risk of fatal and non-fatal cardiovascular events10. CVD risk algorithms have been provided based on measured Body mass index (BMI) (kg/m2) and systolic blood pressure (mg/dL), with separate charts for five-year age groups (40-44, 45-49, 50-54,55-59, 60-64, 65-69 yr), gender (men and women) and smoking status (non-smoker or smoker). Based on the combination of these CVD risk factors, an individual was attributed a CVD risk percentage. As the number of persons with risk greater than 20 per cent was very low for Indian adults, it was further grouped into three categories as very low to low risk (<10%), moderate risk (10 to <20%) and high to very high risk (≥20%).
Outcome and predictor variablesBased on evidence from the literature, a number of possible factors were tested to see if they were linked to the risk of CVD. The estimated risk of CVD was used as the outcome variable. The independent variables such as area of residence (urban and rural), educational status (no formal education, 1-5, 6-8, 8-12 yr, degree and higher), occupational status (employed, unemployed, homemaker), marital status (currently married, others) and wealth index which was derived using the principal component analysis method, as a composite index of assets and housing characteristics classified into quintiles19 were included in the analysis. Behavioural factors included current smokeless tobacco use, current alcohol use, insufficient physical activity, second-hand smoke exposure and metabolic risk factors such as fasting blood glucose, raised systolic blood pressure, BMI and central obesity.
Statistical analysisThe samples were weighted and a complex survey analysis was performed. The gender-wise distribution of the sample was presented using frequency (percentage) or mean (standard deviation). The individual risk score was calculated using WHO CVD-risk non-laboratory-based charts for southeast Asia and a comprehensive risk chart by gender was presented. The risk was classified into three categories: very low to low risk (<10%), moderate risk (10 to <20%), and high to very high risk (≥20%). Univariate association of the CVD risk classification with predictors was carried out using Chi-square analysis. Multivariate logistic regression analysis was performed with CVD risk ≥10 per cent and crude and adjusted odds ratios (AOR) were presented along with 95 per cent confidence intervals (CI). Factors with a P value <0.05 were considered significant. The analysis was done in IBM SPSS version 27.0 (IBM Corp., Armonk, NY) software.
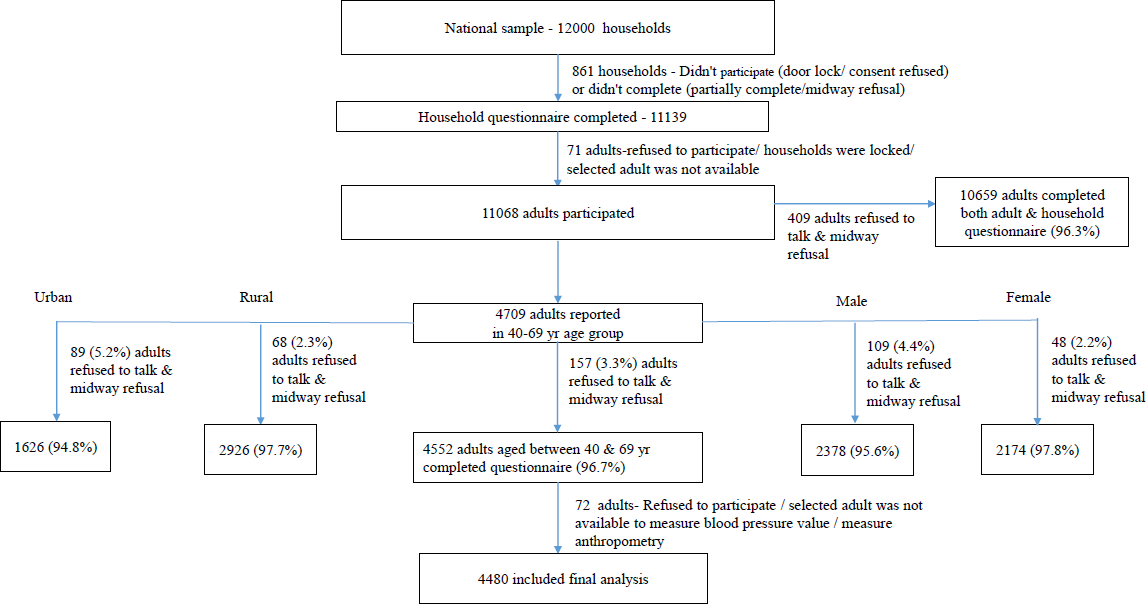
ResultsThe NNMS survey included 10659 adult participants aged 18-69 yr from 12,000 households, of which 4552 adults were aged between 40 and 69 yr. Among them, 72 had a missing value for blood pressure or anthropometry measurements, and hence 4480 were finally included in this study (Fig. 1).
Export to PPT
Sociodemographic, behavioural and metabolic characteristicsThe sample consisted of 52 per cent men (2328/4480) and the rest were women (2152/4480) (Table I). Almost two-third of the participants (64.6%; 2895/4480) were from rural backgrounds and half of the participants belonged to 40-49 yr age group (48.3%; 2162/4480). In socioeconomic aspects, 41.3 per cent had no formal education, 60.2 per cent were employed and 33.4 per cent belonged to lowest wealth quartile. About 26 per cent of men and 3 per cent of women reported smoking, and 28 per cent of men and 3 per cent of women reported consuming alcohol. Around 16 per cent and 43 per cent of the participants had raised blood glucose and raised blood pressure, respectively.
Table I. Weighted characteristics of the study sample by gender
Variables Men, n(%) Women, n(%) Overall, n(%) n=2328 n=2152 n=4480 Age (yr), mean (±SD) 51.41 (8.77) 50.96 (8.75) 51.18 (8.76) Age groups (yr) 40-49 1171 (50.3) 991 (46.1) 2162 (48.3) 50-59 611 (26.2) 607 (28.2) 1218 (27.2) 60-69 546 (23.5) 554 (25.7) 1100 (24.5) Place of residence Rural 1487 (63.9) 1408 (65.4) 2895 (64.6) Urban 841 (36.1) 744 (34.6) 1585 (35.4) Educational status No formal education 594 (25.5) 1256 (58.4) 1850 (41.3) 1-5 yr 468 (20.1) 330 (15.4) 798 (17.8) 6-8 yr 309 (13.3) 205 (9.5) 514 (11.5) 8-12 yr 689 (29.6) 275 (12.8) 964 (21.5) Degree & higher 268 (11.5) 86 (4) 354 (7.9) Occupation status Employed 2036 (87.7) 659 (30.6) 2695 (60.2) Unemployed 268 (11.5) 80 (3.7) 348 (7.8) Homemaker 19 (0.8) 1413 (65.7) 1432 (32) Wealth index quartiles First quartile (<0-25% of WI) 785 (33.7) 711 (33.1) 1496 (33.4) Third quartile (50-75% of WI) 482 (20.7) 476 (22.1) 958 (21.4) Fourth quartile (>75% of WI) 485 (20.9) 395 (18.3) 880 (19.6) Marital Status Currently married 1233 (53) 948 (44.1) 2181 (48.7) Others* 1095 (47) 1204 (55.9) 2299 (51.3) Current tobacco smoker No 1729 (74.2) 2090 (97.1) 3819 (85.2) Yes 599 (25.8) 62 (2.9) 661 (14.8) Current smokeless tobacco user No 1528 (65.7) 1794 (83.4) 3322 (74.2) Yes 800 (34.3) 358 (16.6) 1158 (25.8) Current alcohol user No 1676 (72) 2092 (97.2) 3768 (84.1) Yes 652 (28) 60 (2.8) 712 (15.9) Exposure to second hand smoke No 1047 (45) 1378 (64) 2425 (54.1) Yes 1281 (55) 774 (36) 2055 (45.9) Physical activity Sufficient 1574 (67.6) 1014 (47.1) 2588 (57.8) Insufficient 754 (32.4) 1138 (52.9) 1892 (42.2) Fasting blood glucose (mg/dl), mean (±SD) 104.21 (32.64) 101.82 (35.52) 102.97 (34.18) Fasting blood glucose Normal 1827 (84.6) 1666 (82.9) 3493 (83.8) Raised 333 (15.4) 343 (17.1) 676 (16.2) Systolic blood pressure (mmHg), mean (±SD) 131.01 (23.37) 130.54 (21.7) 130.77 (22.51) Blood pressure Normal 1375 (59.1) 1198 (55.7) 2573 (57.4) Raised 953 (40.9) 954 (44.3) 1907 (42.6) BMI (kg/m2), mean (±SD) 23.65 (5.08) 22.55 (4.36) 23.08 (4.75) BMI categories Lean (<18.6 kg/m2) 423 (18.2) 333 (15.5) 756 (16.9) Normal (18.6-24.9 kg/m2) 1306 (56.1) 1042 (48.4) 2348 (52.4) Overweight (25-29.9 kg/m2) 471 (20.2) 548 (25.5) 1019 (22.7) Obese (≥30 kg/m2) 128 (5.5) 229 (10.6) 357 (8) Central obesity No 1585 (68.1) 1077 (50.1) 2662 (59.4) Yes 743 (31.9) 1075 (49.9) 1818 (40.6) 10-year CVD riskIn the total sample, 84.9 per cent had a very low to low (<10%) 10-year risk of CVD, while 14.4 per cent had moderate risk (10 to <20%) and 0.7 per cent had high to very high risk (≥20%) of CVD (Table II). Hence, a total of 15.1 per cent of participants in the age group of 40-69 yr had an elevated 10-year risk (≥10%). Almost half the individuals in the age group 60-69 yr had an elevated risk (Fig. 2). However, the prevalence of an elevated CVD risk was lower in younger age groups, with 99.6 per cent of individuals aged 40-49 yr experiencing a very low to low CVD risk. On examining the gender pattern, the proportion of men with a CVD risk ≥10 per cent was double that of women (men: 19.8%, women: 10%). The percentage distribution of different CVD risk categories according to the levels of risk factors considered for CVD risk estimation is provided in Figure 3.
Table II. Distribution of non-laboratory-based cardiovascular disease risk according to background sample characteristics
Variables Very low to low (<10%) Moderate (10% to <20%) High to very high (≥20%) P value (Chi2) n=3803 (84.9%), n(%) n=645 (14.4%), n(%) n=32 (0.7%), n(%) Place of residence Rural 2495 (86.2) 387 (13.4) 13 (0.4) 0.01 Urban 1308 (82.5) 258 (16.3) 19 (1.2) Educational status No formal education 1565 (84.6) 275 (14.9) 10 (0.6) 0.58 1-5 yr 671 (84.1) 123 (15.4) 4 (0.5) 6-8 yr 434 (84.4) 71 (13.9) 10 (1.7) 8-12 yr 832 (86.3) 125 (13) 7 (0.7) Degree & higher 301 (85.2) 51 (14.4) 1 (0.4) Occupation status Employed 2343 (86.9) 337 (12.5) 15 (0.6) <0.0001 Unemployed 186 (53.5) 146 (42) 16 (4.5) Homemaker 1271 (88.7) 161 (11.3) 1 (0) Wealth index quartiles First quartile (<0-25% of WI) 1264 (84.5) 220 (14.7) 12 (0.8) 0.96 Second quartile (25-50% of WI) 974 (85) 166 (14.6) 6 (0.5) Third quartile (50-75% of WI) 817 (85.3) 134 (14) 7 (0.7) Fourth quartile (>75% of WI) 748 (85) 125 (14.2) 7 (0.8) Marital Status Currently married 1853 (84.9) 308 (14.1) 21 (1) 0.33 Others 1950 (84.8) 338 (14.7) 11 (0.5) Current smokeless tobacco user No 2808 (84.5) 488 (14.7) 26 (0.8) 0.41 Yes 995 (86) 157 (13.6) 6 (0.5) Current alcohol user No 3228 (85.7) 514 (13.6) 26 (0.7) 0.02 Yes 575 (80.7) 131 (18.5) 6 (0.8) Exposure to second hand smoke No 2078 (85.6) 329 (13.6) 19 (0.8) 0.37 Yes 1725 (84) 316 (15.4) 13 (0.6) Physical activity Sufficient 2268 (87.6) 309 (12) 11 (0.4) <0.0001 Insufficient 1535 (81.1) 336 (17.8) 21 (1.1) Fasting blood glucose Normal 3025 (86.6) 456 (13) 12 (0.4) <0.0001 Raised 511 (75.5) 147 (21.7) 18 (2.7) Central obesity No 2305 (86.6) 343 (12.9) 14 (0.5) 0.01 Yes 1498 (82.4) 302 (16.6) 17 (0.9)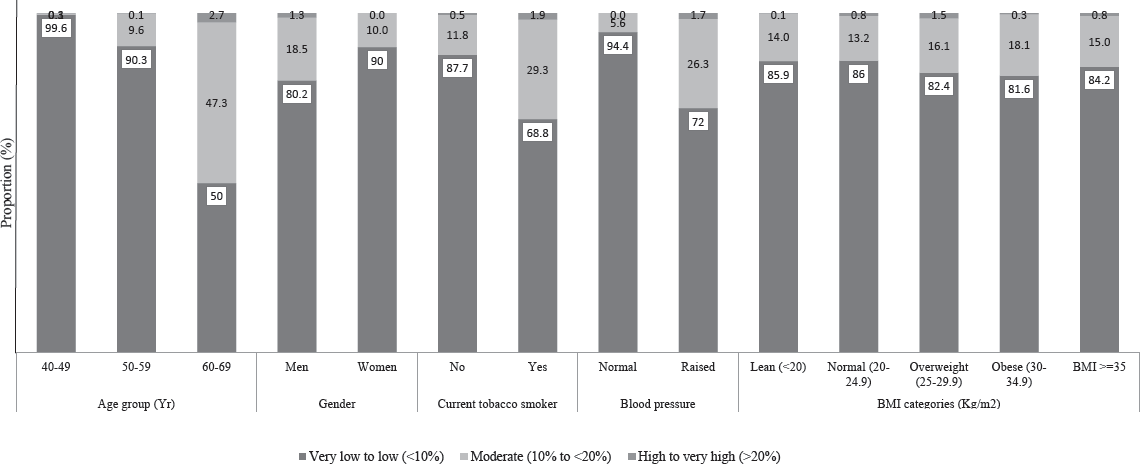
Export to PPT
Export to PPT
More individuals from urban areas of residence had an elevated risk of CVD, where 17.5 per cent had a risk ≥10% compared to only 13.8 per cent in rural populations. There was no significant difference in CVD risk between different educational attainment statuses or between wealth index quartiles. However, the unemployed group had a significantly higher risk of CVD than the employed or homemaker populations. While 87-88 per cent of the latter two groups had a low risk of CVD, only 54 per cent of the unemployed population had a low risk.
Association of 10-year CVD risk with sociodemographic characteristicsThe results of univariate and multivariate logistic regression for the total sample and for men and women separately are provided in Table III. Among the sociodemographic variables, residence, occupation and marital status were significantly associated with an elevated risk of CVD in women, while educational status and occupation were significant in the model for men. Women in urban areas had an 86 per cent higher probability of having elevated 10-year CVD risk (AOR: 1.86; 95% CI: 1.14, 3.03) than women in rural areas. The elevated risk of CVD had a graded association with educational status in men, where individuals with no formal education, 1-5, 6-8 and 9-12 yr of education had AORs 3.24 (95% CI: 1.71-6.13), 2 (95% CI: 1.08-3.72), 1.78 (95% CI: 0.95-3.34) and 1.29 (95% CI: 0.75-2.21), respectively, when compared to individuals with a degree or higher level of education. A similar pattern was also observed in women, but the estimates were not statistically significant.
Table III. Univariate and multivariate logistic regression stratified by gender
Variables Total Male Female COR (95% CI) AOR (95% CI) COR (95% CI) AOR (95% CI) COR (95% CI) AOR (95% CI) Place of residence Rural Ref Ref Ref Ref Ref Ref Urban 1.32 (1.03-1.69) 1.3 (0.98–1.72) 1.19 (0.85–1.66) 1.15 (0.79–1.68) 1.58 (1.08–2.31) 1.86 (1.14–3.03) Educational status No formal education 1.05 (0.71–1.56) 1.93 (1.18–3.14) 1.53 (0.94–2.49) 3.24 (1.71–6.13) 2.06 (0.76–5.58) 2.57 (0.92–7.22) 1-5 yr 1.09 (0.71–1.68) 1.72 (1.03–2.87) 1.07 (0.65–1.76) 2 (1.08–3.72) 2.26 (0.83–6.14) 2.42 (0.84–6.94) 6-8 yr 1.07 (0.7–1.64) 1.57 (0.89–2.77) 1.14 (0.69–1.87) 1.78 (0.95–3.34) 1.76 (0.57–5.42) 1.88 (0.59–6.02) 9-12 yr 0.92 (0.6–1.39) 1.17 (0.75–1.83) 0.97 (0.63–1.49) 1.29 (0.75–2.21) 0.86 (0.25–2.96) 0.85 (0.23–3.06) Degree & higher Ref Ref Ref Ref Ref Ref Occupation status Homemaker 0.85 (0.67–1.07) 0.74 (0.56–0.98) 0.19 (0.03–1.24) 0.25 (0.03–1.87) 2.09 (1.31–3.33) 2.24 (1.39–3.61) Unemployed 5.78 (4.03–8.28) 5.12 (3.63–7.24) 6.47 (4.36–9.62) 5.58 (3.80–8.18) 4.25 (1.92–9.42) 3.61 (1.52–8.57) Employed Ref Ref Ref Ref Ref Ref Wealth index quartiles First quartile (<0–25% of WI) 1.04 (0.8–1.36) 1.26 (0.88–1.81) 0.97 (0.68–1.38) 1.08 (0.66–1.78) 1.29 (0.82–2.01) 1.69 (0.92–3.12) Second quartile (25-50% of WI) 1 (0.75–1.34) 1.17 (0.82–1.66) 0.99 (0.66–1.48) 1.05 (0.64–1.71) 1.17 (0.75–1.8) 1.48 (0.87–2.52) Third quartile (50–75% of WI) 0.98 (0.72–1.33) 1.09 (0.78–1.52) 1.03 (0.69–1.56) 1.17 (0.74–1.84) 0.99 (0.62–1.56) 0.96 (0.59–1.57) Forth quartile (>75% of WI) Ref Ref Ref Ref Ref Ref Marital Status Currently married 0.99 (0.77–1.28) 0.9 (0.69–1.17) 1.2 (0.88–1.63) 1.03 (0.74–1.44) 0.55 (0.38–0.8) 0.6 (0.4–0.92) Others Ref Ref Ref Ref Ref Ref Current smokeless tobacco user No Ref Ref Ref Ref Ref Ref Yes 0.89 (0.7–1.13) 0.87 (0.66–1.16) 0.7 (0.53–0.94) 0.77 (0.56–1.06) 0.87 (0.52–1.45) 0.95 (0.54–1.69) Current alcohol user No Ref Ref Ref Ref Ref Ref Yes 1.43 (1.09–1.88) 1.47 (1.1–1.97) 1.03 (0.76–1.4) 1.16 (0.85–1.57) 1 (0.35–2.83) 0.99 (0.32–3.12) Exposure to second hand smoke No Ref Ref Ref Ref Ref Ref Yes 1.14 (0.9–1.44) 1.41 (1.11–1.8) 1.05 (0.76–1.45) 1.48 (1.08–2.02) 0.86 (0.61–1.23) 1.03 (0.71–1.5) Physical activity Sufficient Ref Ref Ref Ref Ref Ref Insufficient 1.65 (1.37–1.98) 1.36 (1.08–1.72) 2.32 (1.81–2.97) 1.58 (1.15–2.15) 1.56 (1.12–2.17) 1.12 (0.76–1.64) Fasting blood glucose Normal Ref Ref Ref Ref Ref Ref Raised 2.09 (1.58–2.77) 1.81 (1.39–2.34) 2.29 (1.56–3.36) 1.77 (1.24–2.54) 2.02 (1.33–3.05) 1.85 (1.21–2.85) Central obesity No Ref Ref Ref Ref Ref Ref Yes 1.38 (1.13–1.69) 1.41 (1.09–1.81) 1.65 (1.27–2.14) 1.55 (1.1–2.18) 1.61 (1.15–2.27) 1.71 (1.14–2.58) Association of 10-year CVD risk with behavioural and metabolic factorsIn men, individuals whose physical activity was insufficient and individuals who were exposed to second-hand smoke had 1.5 times higher risk than the respective reference groups. Further, though alcohol use was significant in the model with all participants, it was not significant in gender-specific models. This indicates that gender was confounding the association of alcohol with elevated CVD risk. Both metabolic risk factors examined raised blood glucose and central obesity and were significant in both men and women. In comparison to individuals with normal blood glucose, women with raised blood glucose had an 85 per cent risk (AOR: 1.85; 95% CI: 1.21, 2.85) of elevated 10-yr CVD risk. The corresponding estimate was slightly lower in men (AOR: 1.77; 95% CI: 1.24, 2.54). Similar results were obtained with central obesity, where women and men who were centrally obese had 71 per cent (AOR: 1.71; 95% CI: 1.14, 2.58) and 55 per cent (AOR: 1.55; 95% CI: 1.1, 2.18) additional risk, respectively, then their non-obese counterparts.
DiscussionThis study determined the 10-year risk of fatal or non-fatal cardiovascular events in an older adult Indian population using the non-laboratory-based WHO charts and categorized the population into three groups: very low to low risk, moderate risk and high to very high risk. Almost 85 per cent of the study population, aged 40-69 yr, was observed to have a CVD risk <10 per cent. To the best of our knowledge, this is the first study estimating the CVD risk in India using the new non-lab charts. However, a limited number of studies have studied the CVD risk in India using the previous WHO/ISH charts, which use diabetic status and/or serum cholesterol levels. They have observed a varied prevalence of the study population having low CVD risk (<10%), ranging from 50 to 86 per cent20-24.
All these studies were done using a geographically localized population, and hence, a national estimate of CVD risk is missing in India. A study by Madhu et al24 in a rural setting in South India observed that 40 per cent of the rural population and half of the tribal population had elevated CVD risk of CVD24. The reason for the higher risk could be due to the fact that 35 per cent of the population is aged 60 and that a very high prevalence of tobacco usage (90%) was observed among the tribal population. In another study, a similar proportion (44.4%) of people in rural North India were seen to have an elevated risk of CVD in another study21. However, the sample size was very small (n=133) and almost half the population was elderly (aged 60 yr and above), increasing the overall CVD risk of the study population.
Two other studies in rural settings in South India observed results similar to the findings of our study. In rural Puducherry, it was estimated that 86 per cent of the study population had a low risk of CVD23, and the corresponding estimate was 80 per cent in a village in Tamil Nadu20. Deori et al22 noted that 78.5 per cent had low CVD risk in rural Lucknow when the CVD risk chart that included cholesterol levels was used, and this dropped to 76.8 per cent when the chart without cholesterol was used. In a multinational study, 79.2, 87.2 and 94.9per cent of the population studied had low CVD risk in Pakistan, Nepal and Sri Lanka, respectively25.
India falls within the WHO epidemiological region, sharing similarities with Nepal’s 87.2 per cent low CVD risk estimate. Another Nepalese study, employing the WHO/ISH chart, reported 86.4 per cent with low CVD risk26. A singular regional study conducted in Bangladesh using the updated WHO non-laboratory chart revealed a higher CVD risk (72.5%) than our findings. Notably, their population skewed older (≥60), with 10 per cent aged 70 and above, all exhibiting elevated CVD risk27. In contrast, our study focused on individuals aged 40-69 yr, with half falling within the younger age group (40-49 yr). Additionally, our population exhibited a lower prevalence of smoking (25%) compared to their study, resulting in a comparatively lower CVD risk.
Our findings also showed that urban residents have a higher prevalence of elevated risk than rural residents (13.8 vs. 17.5%). The higher prevalence of CVD risk factors and consequently, CVD events in urban areas than rural areas is well documented in India28-30. Factors such as sedentary lifestyle, low physical activity, altered dietary habits, higher prevalence of obesity, etc., are commonly quoted as reasons for higher CVD risk in urban regions28,31. A higher proportion of men had an elevated risk of CVD than women, which is consistent with previous findings20,23,27. Further, as expected, the risk increased with age, as age is one of the predictive factors for CVD risk.
Among the factors examined for association with elevated CVD risk, place of residence was significant, as expected. However, it was significant only for women, suggesting a greater urban disadvantage for women. There is no significant difference in CVD risk experienced by men living in urban or rural areas. The differing findings between men and women can be further explored by the contributions of sociodemographic, behavioural and metabolic risk factors. A graded pattern of decreasing CVD risk with increasing education was evident in the Bangladeshi population as well27. Education can be a factor in determining the awareness levels of individuals, thus leading to better adoption of preventive lifestyle habits. Further, the well-established metabolic risk factors for CVD, such as raised blood glucose and central obesity, had a significant association with elevated CVD risk.
The findings of this study reveal a notable discrepancy between educational status and employment concerning their association with CVD risk. While no significant difference was observed in CVD risk across various educational attainment levels or wealth index quartiles, the unemployed group demonstrated a significantly higher risk compared to the employed or homemaker populations. This disparity suggests that factors related to employment status may play a more substantial role in influencing CVD risk in this population than educational attainment or wealth. Sub-analysis was performed to identify the disparity between educational status and unemployment. This revealed that the majority of the unemployed males and females belong to the age group of 60-69 yr (72.5 and 57.8%, respectively), due to which CVD risk was significantly high among the unemployed. Further investigation is warranted to understand the specific dynamics contributing to this difference and to inform targeted interventions for CVD prevention. Strategic initiatives play a crucial role in helping India progress towards meeting the targets outlined by the WHO and Sustainable Development Goals in the context of CVD, as the country is currently lagging behind in achieving these objectives32.
This study adds to the knowledge of the increasing burden of CVD and its risk factors in India. The novel contribution of this paper lies in identifying unexpected disparities in CVD risk among different socioeconomic groups in the Indian population using nationally representative data. Traditionally, higher educational attainment and wealth have been associated with lower CVD risk. However, this study reveals a notable absence of significant differences in risk across various educational and wealth levels. Contrary to expectations, the unemployed group exhibited a significantly higher CVD risk compared to both the employed and homemaker populations. This unexpected finding underscores the complexity of socioeconomic determinants of health, indicating that factors beyond education and wealth, such as employment status, play a crucial role in shaping CVD risk.
This risk stratification method is very useful for efficiently channelling limited resources in resource-poor primary care settings33. The use of a non-laboratory-based chart for risk stratification reduces the overdependence on laboratory investigations for CVD risk estimation. Individuals with elevated risk, according to the non-laboratory-based chart, can be subjected to further investigation, reducing resource utilization. However, the non-lab-based chart has been observed to underestimate the proportion with >10 per cent CVD risk as it excludes the additional CVD risk due to elevated blood glucose9. While ethnicity can influence cardiovascular risk, utilizing a region-specific tool may be more feasible in resource-limited settings and offer broader generalizability. However, researchers should consider conducting further analyses if ethnicity significantly impacts cardiovascular risk in the population of interest. The results haveto be read with caution as the sample in the study was relatively younger and included only up to age 69, which could have underestimated the CVD risk of the population. Finally, factors such as diet, family history and past medical history were not considered for risk estimation, so the results have to be interpreted with caution for assessing the individual level of CVD risk.
Overall, the population’s moderate to very high 10-year CVD risk was 15 per cent higher in urban areas. More men than women faced elevated CVD risk. The non-laboratory chart aids individual and policy-level risk estimation. It’s beneficial for efficient policymaking and resource allocation, addressing India’s growing CVD burden. Further research is needed on the positive association of secondhand smoke with CVD risk in India. Future studies should focus on local CVD risk estimation and validate non-laboratory charts against laboratory-based methods.
留言 (0)