
記住我


Stratification of the expansive study cohort (n = 82,041) involved allocating individuals to either the GLP-1RAs group (n = 1685, 2.1%) or the LAI control group (n = 32,750), based on the administration of GLP-1RAs or LAI within timeframe spanning of one day to three months subsequent to the index date at dialysis commencement. (Table 1). Among the types, dulaglutide (n = 715, 42.4%) was the most commonly used GLP-1RAs, followed by semaglutide (n = 420, 24.9%) and liraglutide (n = 371, 22.0%). Adhering to this methodological rigor, 1,682 GLP-1 RA users and an equivalent number of LAI users, intricately balanced on pertinent covariates, were purposefully selected for the study. The mean age of the GLP-1RAs group was younger than that of the LAI group (59.3 ± 11.6 vs. 61.8 ± 12.8 years, p < 0.001) (Table 1). Males were the major gender, as well as the White was the predominant race in both groups. The eGFRs in the GLP-1RAs were higher than the LAI group (41.4 ± 36.1 vs. 36.6 ± 37.1 ml/min/1.73m2, p < 0.001). After further investigating for the presumptive causes of dialysis commencement, the leading cause was ischemic heart disease (17.2%), followed by heart failure (13.6%) and sepsis (6.5%), with a majority of patients (25.0%) whose baseline kidney function was less than 15 ml/min/1.73m2 (Supplementary Table 1).
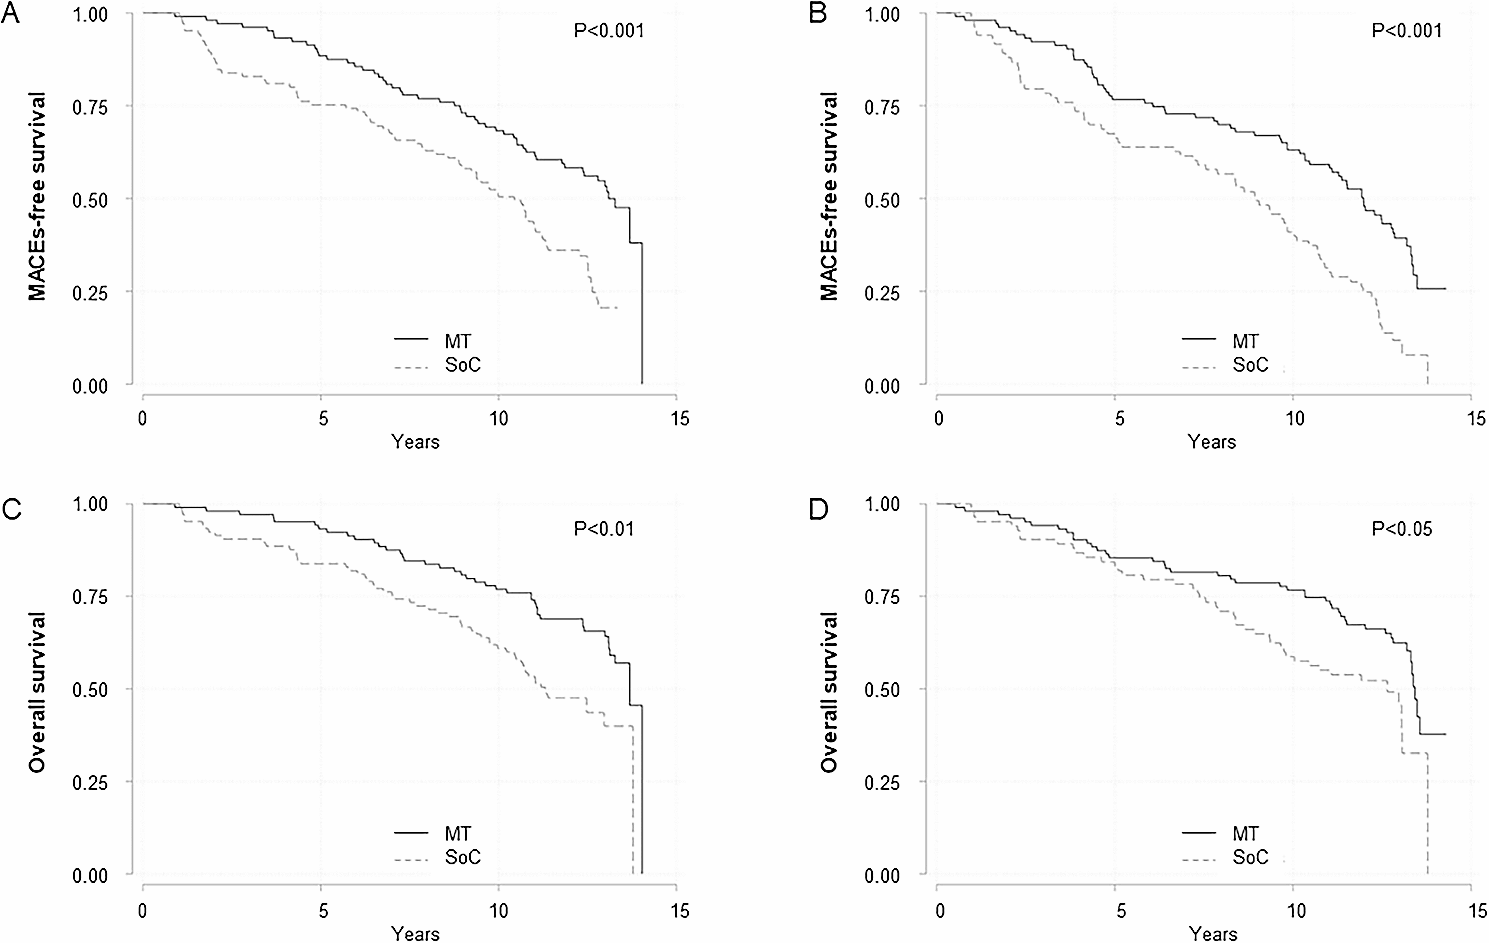
Table 1 Baseline characteristics of study subjects before and after propensity score matchingThe overall cohort had a median duration of 1.4 years, bracketed by the 25th percentile at 0.8 years and the 75th at 2.1 years, with the 90th percentile reaching 2.6 years (Supplementary Table 2). The all-cause mortality rate was 6.5% in the GLP-1RAs group and 11.0% in the LAI group, where the GLP‐1RAs group users displayed a significantly diminished risk of all-cause mortality (aHR = 0.63, p < 0.001) (Table 2, Supplemental Table 3). The E-value for the effect of GLP-1RAs on mortality was 2.54 (with a lower bound of 95% CI of 3.41). Additionally, a decreased risk of MACE (aHR = 0.65, p < 0.001), as well as a lower risk of MAKE (aHR = 0.75, p < 0.001) were detected in the GLP‐1RAs group compared to the LAI group (Fig. 2, Supplemental Tables 4, 5). The E-value for the effect of GLP-1RAs on MACE was 2.47 (with a lower bound of 95% CI of 3.33), and on MAKE was 1.75 (with a lower bound of 95% CI of 2.07) (Table 2).
Table 2 Incidence of outcomes among GLP-1 RA group compared to LAI control group after prosperity score matchingFig. 2
Kaplan–Meier curves of the pre-specified long-term outcome. The green curve represents individuals who are GLP-1 RA users, while the brown curve represents those who are GLP-1 RA non-users (LAI). A All-cause mortality (log-rank p < 0.001). B 4P-MACE (log-rank p < 0.001). C MAKE (log-rank p < 0.001). GLP-1 RA glucagon‐like peptide‐1 receptor agonists, LAI long‐acting insulin, 4P-MACE four-point major adverse cardiovascular event, MAKE major adverse kidney event
Subgroup analysisSubgroup analyses were undertaken based on medication usage, comorbidities, body mass index, HbA1c, eGFR, and the utilization of short-acting and long-acting GLP-1RAs (Fig. 3). The results consistently unveiled an association between the use of GLP-1RAs and a reduced risk of mortality, MACE and MAKE, which is particularly noteworthy in patients devoid of proteinuria (aHR = 0.66, p < 0.001), characterized by HbA1C < 7.5% (aHR = 0.55, p < 0.001), and exhibiting BMI ≧ 30 kg/m2 (aHR = 0.51, p < 0.001). Remarkably, the salutary impact of GLP-1RAs was accentuated in the context of long-acting GLP-1RAs. However, the association between GLP-1RA use and a decreased risk of mortality and MACEs remained consistent, regardless of different timeframes.
Fig. 3
The forest plots illustrated the adjusted HRs of all-cause mortality, 4p-MACE and MAKE for GLP-1 RAs users versus LAI users at dialysis commencement. The plots present both the adjusted HRs and their 95% confidence intervals (CIs), represented as error bars. The vertical line denotes an aHR of 1.00, with lower limits of the 95% CIs exceeding 1.00 indicating a statistically significant increased risk. ACEI angiotensin-converting enzyme inhibitors, ARB angiotensin-receptor blockers, BMI body mass index, CHF congestive heart failure, eGFR estimated glomerular filtration rate, GLP‐1 RAs glucagon‐like peptide‐1 receptor agonists, HTN hypertension, LAI long‐acting insulin, 4P-MACE four-point major adverse cardiovascular event, MAKE major adverse kidney event, SGLT2i sodium–glucose cotransporter 2 inhibitor
Patients with baseline kidney function better than 15 ml/min/1.73m2 obtained significant benefited from GLP-1RAs usage compared to the LAI group [mortality (aHR = 0.57, p < 0.001), MACE (aHR = 0.68, p = 0.011), and MAKE (aHR = 0.77, p = 0.009)], but the benefit was not found in those with kidney function less than 15 ml/min/1.73m2 [mortality (aHR = 0.60, p = 0.119), MACE (aHR = 0.89, p = 0.687), and MAKE (aHR = 1.11, p = 0.595)]. Among patients who had GLP-1RAs usage before the index date, the trend was only noted in long-term users [mortality (aHR = 0.57, p = 0.003), MACE (aHR = 0.53, p = 0.001) and MAKE (aHR = 0.69, p = 0.003)]. It is noteworthy that GLP-1RAs new users also exhibited a significantly decreased risk of mortality (aHR = 0.70, p = 0.013), MACE (aHR = 0.74, p = 0.047) and MAKE (aHR = 0.74, p = 0.004) compared to the LAI group. Surprisingly, GLP-1RAs ever users who discontinued the treatment did not show any improvement in mortality (aHR = 0.99, p = 0.967), MACE (aHR = 1.01, p = 0.971) or MAKE (aHR = 1.00, p = 0.995).
GLP-1RAs with an exendin backbone are primarily cleared by the kidneys [27]. Our analysis of this subgroup of GLP-1RAs users, including exenatide did not reveal a significant reduction in mortality (adjusted hazard ratio [aHR] = 0.45, p = 0.154), major adverse cardiovascular events (MACE) (aHR = 0.48, p = 0.193), or major adverse kidney events (MAKE) (aHR = 0.47, p = 0.230) compared to the LAI group (Supplementary Table 6).
Sensitivity and specificity analysisAngiotensin-converting enzyme inhibitor (ACEI) or angiotensin II receptor blocker (ARB) use among diabetic patients recovered from dialysis-requiring AKI was associated with a lower risk of ESKD and all-cause mortality [28]. As an extension to the current evidence, a positive outcome analysis was performed and showed a significant reduction of MACE and all-cause mortality among ACEI/ARB users in our study population (Supplementary Table 7, Supplementary Fig. 1).
In order to gain insights into the possibility of discontinuing dialysis, compared to LAI, GLP-1RAs were consistently associated with a decreased risk of all-cause mortality, MACE, and MAKE at various selection periods of 14, 30, 60, and 90 days (Supplementary Table 8). To delineate each component of outcomes of interest, we analyzed mortality as well as MI (aHR = 0.63), heart failure (aHR = 0.73), and stroke (aHR = 0.74). The findings indicate that GLP-1RAs use was independently associated with improved outcomes for all these endpoints.
Of note, in dialysis patients who could withdraw from acute dialysis, defined as being free from dialysis at 180 days after the index date (Fig. 3), akin to the main analysis, GLP-1RAs users were associated with a reduced risk of all-cause mortality (aHR = 0.67, p = 0.004), and MACE (aHR = 0.62, p = 0.001). However, this effect was not observed in patients who continued to be dependent on dialysis.
To investigate the effect of GLP-1RAs on glycemic control, laboratory data of HbA1c were analyzed and showed consistently higher HbA1C levels in the GLP-1 RAs group throughout the study (Supplementary Fig. S2). Additionally, the magnitude of body weight and lipid profile changes among GLP-1RAs and LAI users were analyzed. Though HbA1c and body weight were reduced after treatment, no greater improvement of the lipid profile (low-density lipoprotein, LDL) and systolic blood pressure (SBP) were seen among patients treated with GLP-1RAs compared to LAI (Supplementary Table 9, Figs. S3–S5). Moreover, after dialysis, HbA1C levels and body weight were consistently higher in the GLP-1RAs group compared to the LAI group, indicating that the reduced risk of adverse outcomes associated with GLP-1RAs is not attributable to the “legacy effect”.
We further adjusted for diabetes-related organ injury, such as diabetic retinopathy and neuropathy, as proxies for diabetic severity. The results remained consistent with our main findings [mortality (aHR = 0.56, p < 0.001), MACE (aHR = 0.69, p = 0.001), and MAKE (aHR = 0.76, p < 0.001), Supplementary Table 10], suggesting that the worse outcomes observed in LAI patients were not solely attributable to differences in glycemic control or CVD burden. Additional specificity analyses were performed to compare the efficacy of GLP-1RAs and other second-line antihyperglycemic treatments users (thiazolidinedione (TZD), dipeptidyl peptidase IV inhibitor (DPP4i) or sulfonylureas (SU)), where the results were also consistent with our main finding [mortality (aHR = 0.71, p = 0.005), MACE (aHR = 0.76, p = 0.028), and MAKE (aHR = 0.84, p = 0.031), Supplementary Table 11)].
Positive and negative outcome controlsWe utilized patients with gastroparesis and tachycardia as positive outcome controls to assess potential systematic bias [29, 30]. Notably, the risk of gastroparesis (adjusted hazard ratio [aHR] = 1.36, 95% CI = 1.00–1.85, p = 0.047) and tachycardia (aHR = 1.51, 95% CI = 1.00–2.28, p = 0.047) was significantly higher in the GLP-1RAs group (Supplementary Fig. 1). Conversely, incidences of melanoma, traumatic head injury, hernia, GI bleeding, and pneumonia, which were not expected to be linked to GLP‐1RAs use, showed no significant differences between the groups. Moreover, the risk of hypoglycemia among type 2 diabetes patients undergoing acute dialysis did not significantly differ between GLP-1RAs users and LAI users (aHR: 1.33 [0.94–1.88], p = 0.102) (Supplementary Table 12).
留言 (0)