Glioblastoma stem cell lines, patient-derived GB tumoroids and GBCs growing in tumor organoids
Primary human glioblastoma stem-like cell lines (GBCs: S24, BG5, T269, P3) [18, 19] were cultured under serum-free, non adherent, stem-like conditions in DMEM-F12 medium (#11,330–032, Life Technologies, part of Thermo Fisher Scientific, Waltham, Massachusetts, USA) with B27 supplement (#17504044, Life Technologies), insulin (5 μg/ml; #I9278, Sigma, part of Merck, Darmstadt, Germany), heparin (5 μg/ml; #H4784, Sigma), epidermal growth factor (20 μg/ml EGF; #PHG0311, Life Technologies), and fibroblast growth factor (20 μg/ml basic FGF; #PHG0021, Life Technologies). All GBCs used were diagnosed as glioblastoma, IDH wild-type and their origins confirmed via Methylation EPIC Array (#WG-317–1003, Illumina, San Diego, California, USA). Authenticity and absence of contamination were regularly checked (Multiplexion GmbH, Heidelberg, Germany).
For 2DTM, GBCs were plated after singularization with Accutase (#1110501, Thermo Fisher Scientific) and maintained in high glucose medium (HGM; 50 mM glucose; #G7021-1 KG, Sigma) as previously described [7].
The choice of the terms “tumoroids” and “brain tumor organoids” is intended to clarify the origin and composition of 3D GB models. The term “tumoroids” emphasizes their direct derivation from GB tumor tissue, and we avoid the use of the term “organoid” because of its association with “organ”, which typically denotes a complex, functional structure composed of multiple tissues that perform specific physiological functions critical to the survival of an organism. In contrast, “brain tumor organoids” are GBCs cultured within brain organoids. This designation emphasizes their growth in a 3D structure resembling a simplified brain-like organ.
To generate acute patient-derived GB tumoroids, tumor tissue was enzymatically dissociated into a single cell suspension as previously described [20, 21]. Tumor tissue was washed with phosphate buffer saline (PBS; #D8537, Sigma), mechanically dissociated using the brain tumor dissociation kit (#130-095-942, Miltenyi Biotec, Bergisch Gladbach, Germany) and gentleMACS dissociator (#130-093-235, Miltenyi Biotec). Dissociated GBCs were resuspended and cultured in ultra-low attachment culture dishes (#CLS3814, Corning, Corning Inc., New York, USA) with Neurobasal-A medium (#10888022, Thermo Fisher Scientific) supplemented with N2 (10 µg/ml; #17502048, Thermo Fisher Scientific), B27 (10 µg/ml), L-glutamine (4 µg/ml; #25030081, Thermo Fisher Scientific), FGF (25 ng/ml) and EGF (25 ng/ml). Cells were cultured for about with medium changes every three days.
Brain organoids were generated from human induced pluripotent stem cells (hiPSCs) as previously described [7]. See Supplementary Material for more details.
To initiate tumor co-culture, brain organoids were each cocultured with 5000 GBCs. After two days, the GBCs growing in cortical spheroids were transferred to standard cell culture dishes precoated with Pluronic (0.5%). After seven days of co-culture, the growth factors EGF and FGF were removed and on day ten the GBCs growing in cortical spheroids were exposed to TTFields. After 5 days of TTFields treatment, GBCs growing in cortical spheroids were fixed and processed.
In vitro TTFields simulation using inovitro live and inovitro systems
To study the effects of in vitro modeled TTFields on GBC morphology, we used the Inovitro system (Novocure, Haifa, Israel). This device, with ceramic wells, applies alternating current (AC) electric fields to GBCs. Each plate can accommodate up to 8 ceramic wells, allowing different treatment durations synchronized samples. For live Ca2+ imaging, we used the Inovitro Live system with plates that have a translucent bottom, enabling time-lapse imaging and real-time quantitative analysis during continuous AC electric field application. Both devices use two perpendicular pairs of electrodes on the outer ceramic wall to model TTFields, with the cell culture dish connected to an electric field generator. To offset heat generated by the electric field, the plate temperature is maintained at 37 °C by placing the dish in a cooling incubator (set at 25 °C; #CCL-170B-8-P, Esco Lifesciences, Friedberg, Germany). The temperature is continuously monitored by two thermistors attached to the walls of the ceramic dish. The intensity of the applied electric field is proportional to the set ambient temperature and is expected to be in the clinically relevant range at approximately 1.12 V/cm when 200 kHz AC is applied [22].
Control experiments were cultured in the same dishes with media changes at the same frequency as the experimental samples. These control samples were maintained in an incubator set at a constant temperature of 37 °C.
To verify the accuracy of the temperature records from the Inovitro hardware and software, manual temperature measurements were taken in the tumor cell media using the Lollipop Traceable Precision Thermometer (#620-2723, Avantor part of VWR International, Pennsylvania, USA). The recorded temperatures were then compared with the values documented by the Novocure Inovitro software.
The Inovitro Live system allows uni-linear electric field orientation to study directional effects. To understand the directional aspects of the electric field, we applied linear AC and assessed the angle at which the TMs aligned relative to the orientation of the applied electric field.
In this study, TTFields experiments were conducted using alternating electric fields at an intermediate frequency of 200 kHz, unless otherwise stated. Previous data indicated a reduced effect at 50 kHz [10], which is why we also used this alternative frequency to confirm these findings.
Morphological analysis, immunohistochemistry and lentiviral transduction
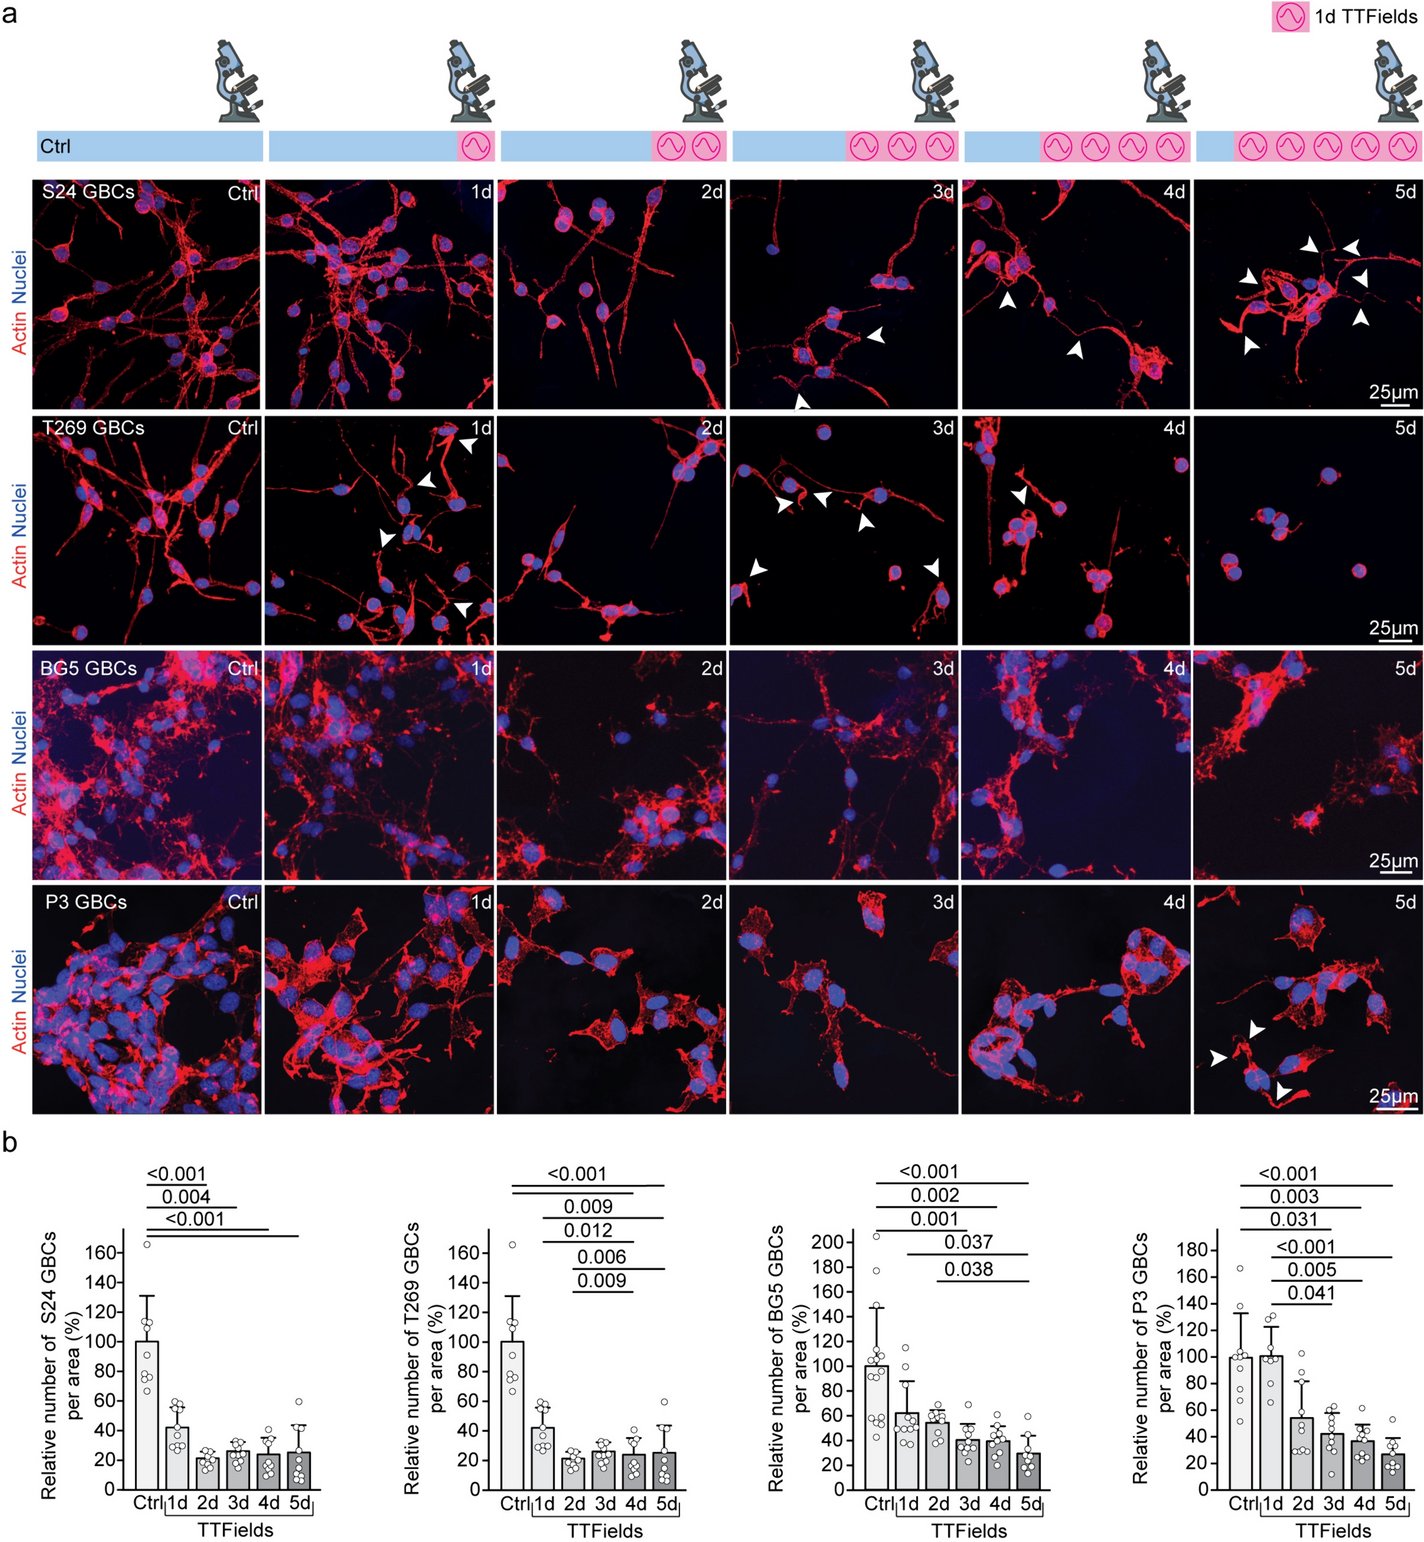
For morphological analysis of tumor cell networks, 90,000 S24 and T269 GBCs were plated on Matrigel (#356231, Corning Inc.) coated glass coverslips in 24-well plates and maintained in HGM [7].
GBCs were fixed with paraformaldehyde (4% PFA; #P087.1, ROTI Histofix, Roth, Karlsruhe, Germany) for 10 min, washed with Tween 20 (0.5%; #9005-64-5, Sigma) in PBS, stained with Alexa Fluor Phalloidin 546 (#A22283, Molecular Probes, part of Thermo Fisher Scientific) and Hoechst33342 (#H3570, Invitrogen, part of Thermo Fisher Scientific) for 30 min, then mounted (Vectashield Hardset; #H-1400, Vector Laboratories, Newark, California, USA).
Fixed GBCs in organoids were processed, sunk in sucrose (30%; #84097, Sigma) overnight, embedded in 10%/7.5% gelatin/sucrose (gelatin; #9000-70-8, Sigma) and cryosectioned at 20 μm. Samples were blocked in bovine serum albumin (0.5% BSA; #9048-46-8, Sigma) and Triton X-100 (0.1%; #A4975, AppliChem, Darmstadt, Germany), incubated with primary antibodies overnight, washed, incubated with secondary antibodies, counterstained with Hoechst33342 and mounted (Vectashield Hardset).
Primary antibodies used included Nestin (1:600; #MAB1259, Novus Biologicals, part of Bio-Techne, Minneapolis, Minnesota, USA) and Ki67 (1:500, #9129S, Cell Signaling Technology, Danvers, Massachusetts, USA). Caspase (1:500; #ab13847, Abcam, Cambridge, UK). Donkey anti-mouse IgG Alexa Fluor 488 (1:1000; #A-21202, Thermo Fisher Scientific) and goat anti-rabbit IgG Alexa 555 (1:1000; #A-21429, Thermo Fisher Scientific) secondary antibodies were used. Nuclei were stained with Hoechst33342.
For stable fluorescent labeling, GBCs were transduced with lentiviral vectors using pLKO.1-puro non-target shRNA (#SHC016V, Sigma) for cytoplasmic GFP expression. Cells were incubated with lentiviral particles and polybrene (10 μg/ml; #TR-1003-G, Merck, Darmstadt, Germany) for 24 h as previously described [23].
Quantification of proliferation (Ki67), cell death and infiltration (nestin) in brain tumor organoids
We quantified proliferating cells based on their Ki67 immunofluorescence, cell death based on caspase 3 immunofluorescence and tumor cell infiltration using nestin fluorescence in mature brain tumor organoids (BTO) with Fiji 2.0.0 (RRIDD:SCR_002285). Images were reconstructed into multi-channel 2D maximum intensity projections. The tumor core was defined by dense nestin fluorescence. The Fiji area selection tool measured the overall size of the BTO, the tumor core, and the diffusely infiltrated area. Ki67+ cells and caspase 3+ cells were manually counted.
Nestin staining quantification was done using a Fiji macro. Two 200 μm square regions within the diffusely infiltrated area were analyzed per BTO. The green nestin channel was isolated from the blue Hoechst33342 channel, and a standard iterative thresholding algorithm was applied. The green channel area was normalized the blue channel area to account for cell number variations.
Cell viability (PI) and proliferation (EdU) assays in the 2DTM model
We seeded 90,000 S24 GBCs onto Matrigel-coated glass coverslips. Inovitro application was performed for 3 and 5 days. On day 5, cells were exposed to 5-ethynyl-2-deoxyuridine (10 μM EdU) for 3 h and stained using the EdU click assay (#BCK-EdU488, Sigma) and Hoechst33342. For viability assessment S24 GBCs were stained with Hoechst33342 and propidium iodide (1.5 μM PI; #P4170, Sigma). Confocal microscopy was used for imaging. Images were processed with ImageJ, and quantification was performed manually. Proliferation was determined by the ratio of EdU-positive to Hoechst33342-positive nuclei. Dead cells still adhering to the Matrigel matrix were determined as the ratio of PI-positive nuclei to Hoechst33342-positive nuclei.
Recording of intercellular Ca2+ transients
1.5 million S24 or BG5 GBCs were plated in 2DTM culture on a Matrigel-coated polymer coverslip bottom (#81,156, Ibidi, Fisher Scientific) in HGM [7]. After 24 h, cells were exposed to TTFields for 24 h. To assess acute effects, cells were exposed to TTFields after 2 days of culture, and images were acquired within 2 h of exposure. Untreated control GBCs were maintained for 2 days before imaging. Prior to Ca2+ transient analysis, cells were loaded with Rhod-2AM (1 μM; #R1244, Sigma) for 30 min.
Acute patient-derived GB tumoroids were also loaded with Rhod-2AM.
Live Ca2+ imaging was performed in temperature-controlled media at 37 °C and 5% CO2 using confocal microscopy. Each time series lasted 10 min with images acquired at 1.52 s per frame.
Image processing and analysis
Images were acquired using a ZEISS LSM 710 confocal microscope and ZEISS ZEN software (Zeiss, Germany). Fiji 2.0.0 (RRID:SCR_002285) and Imaris (Bitplane, Zurich, Switzerland) were employed for image processing, including channel subtraction to remove non-specific background signals. Fiji was also used for data analysis, with manual quantification of TM number following established criteria [2, 3, 24].
Network analysis
Ca2+ transient analysis was performed as previously described [7]. In summary, Ca2+ transient analysis utilized Fiji to obtain single-cell mean intensity traces, which were smoothed using MATLAB 2020b (MathWorks Inc., Natick, Massachusetts, USA). Peaks and their amplitudes were identified, and cells with periodic Ca2+ activity were defined based on specific criteria. Graph theory and cross-correlation analysis were performed using MATLAB, evaluating synchronization between cells and the speed of Ca2+ signal propagation [7, 25, 26]. See Supplementary Material for more details.
Statistical analysis
Image analyses results were imported into SigmaPlot software (Systat Software, Inc., Erkrath, Germany) for statistical assessment. Normality was evaluated using the Shapiro–Wilk test. For normally distributed data, a two-tailed Student’s t-test was employed, while non-normally distributed data were analyzed using the Mann–Whitney test. One-way analysis of variance (ANOVA) followed by Dunnett’s test or the Kruskal–Wallis test was utilized for datasets with more than two groups. Statistically significance was considered at p < 0.05.


留言 (0)