
記住我
Acute inflammatory exacerbations represent a key feature in the evolution of interstitial lung diseases (ILD). This cluster of chronic progressive pathologies includes idiopathic pulmonary fibrosis, non-specific interstitial pneumonia, connective tissue disease associated ILD, chronic hypersensitivity pneumonitis, pneumoconiosis, sarcoidosis, and more (1, 2). The exact sequence of events igniting these flare-ups have yet to be fully understood. However, epidemiological and experimental evidence suggest that a combination of genetic susceptibility, preexistent pulmonary and systemic conditions, biological aging/senescence of the alveolar compartment, and external stressors (environmental toxic exposure) contribute to the repeated cycles of focal inflammation, spatially heterogenous injury, and aberrant repair characteristic of fibrotic disease (3–7).
To date, over 60 mutations in the alveolar epithelial type 2 specific gene encoding for the surfactant protein C (SP-C) have been linked to the development of a fibrotic phenotype, with the isoleucine-to-threonine missense substitution at position 73 of the SP-C proprotein (SP-CI73T) representing the most common (8–10). Our group has previously characterized endoplasmic reticulum toxicity and macroautophagy block resulting from aberrant processing and trafficking of the SP-C proprotein and described the sequelae of immunological events accompanying tissue remodeling (8, 9, 11, 12). Here, we expand on this prior investigation by defining the spatial and phenotypic distribution of monocytes and macrophages responding to the initial epithelial injury and establish patterns of intercellular communication among cellular species in the lung.
Mounting evidence supports the notion that inflammatory monocyte mobilization in the fibrosing lung represents a valid indicator of poor disease prognosis (13, 14). Yet, experimental modeling and clinical trials designed to non-specifically target inflammation (e.g., corticosteroids, broad spectrum cytokine modulation) have revealed low efficacy or even harmful toxicities (15). Among the reasons for this therapeutic failure is the absence of a nuance approach capable of controlling the maturation, activation, and persistence of ontologically and phenotypically heterogeneous cellular entities, and the relatively fragmented understanding of the spatial distribution of cells and signals in a temporally extended pathology such as fibrosis (16–18). Experimental evidence highlights distinct transcriptomes emanating from tissue-resident and monocyte-derived macrophages (19, 20), with the latter generating a complex fibrogenic signature (10, 21, 22). The fibronectin/FN1, osteopontin/SPP1, tumor growth factor (TGF)β1, and interleukin 4/13 signaling pathways represent the most studied networks mediating tissue remodeling (23–27), while metabolic networks have gained traction as potential targets in chronic inflammatory diseases (28, 29). In vitro systems establish a reliance on glycolysis in response to canonical pro-inflammatory signals (IFNγ, LPS), juxtaposed to fatty acid oxidation, tricarboxylic acid cycle, and mitochondrial oxidative phosphorylation following challenge with anti-inflammatory and pro-remodeling signals (IL-10, IL-4/13, TGFβ1) (30–32). This evidence emphasizes the importance of factors governing lipid synthesis, handling, and metabolism (PPARγ, LXR, FXR, SREBP1) in regulating macrophage function (33, 34). The cholesterol and phospholipid transporter apolipoprotein E (ApoE) has been linked to monocyte-derived macrophage activation in chemical-induced injury, though there is limited evidence that these responses are consistent across the spectrum of fibrosis (35, 36).
Through a combination of bulk, single cell, and spatial transcriptomics we show a hyperactive niche of macrophages surrounding fully remodeled lung regions during fibrogenic exacerbations triggered by mutant SP-C induction. Cellular annotation and communication analysis identify time-related changes in intercellular networks, with alveolar and interstitial/Trem2+ macrophages and inflammatory monocytes responsible for Spp1, Fn1, and Tgfβ1 pro-fibrotic signaling. Analysis of human idiopathic PF confirms the presence of an interstitial population responsible for pro-fibrotic signaling in the diseased lung. Our findings also highlight disease-related shifts in lipid transcriptional signatures and interstitial/Trem2+ macrophages as the sole cellular cluster expressing ApoE. While genetic ablation of ApoE in SP-CI73T induced injury did not significantly impact fibrotic disease outcome, our results pinpoint this molecule as a potential biomarker identifying fibrogenic myeloid populations. Together, these results reveal temporal and phenotypic heterogeneity in the macrophage compartment and implicates Trem2+ interstitial macrophages and their monocytic precursors as viable targets for anti-fibrogenic therapy.
Materials and methodsSex as a biological variableThese studies utilized both male and female mice.
Murine model of SP-CI73T induced lung injuryTamoxifen inducible SP-CI73T mice were generated as previously reported (9). For studies investigating the role of the apoliproprotein E in SP-CI73T induced injury, a parallel line was crossed with ApoE knock out mice purchased from Jackson laboratories (Strain #002052, The Jackson Laboratory, Bar Harbor, ME). Briefly, an estrogen receptor (ER)-2 controlled Flp-O recombinase strain knocked into the Rosa26 locus (The Jackson Laboratory). Adult homozygote SP-CI73TFlp mice (8-12 weeks) received two tamoxifen oral gavages three days apart (90 mg/kg each) to excise a neomycin cassette placed within the Sftpc gene. Both male and female animals were used for the studies. For studies involving apoE mutants, a SP-CI73TApoEWT/KO breeding pair was utilized (SP-CI73TApoEHET) so as to generate wild type, heterozygous, and homozygous experimental littermates. Control groups mice are represented as pooled data from tamoxifen treated SP-CI73T not expressing Flp-O recombinase or oil (vehicle) treated Flp-O expressing SP-CI73T mice. All mice were housed under pathogen free conditions in AALAC approved barrier facilities at the Skaggs College of Pharmacy, University of Utah. All experiments were approved by the Institutional Animal Care and Use Committee, University of Utah.
ReagentsTamoxifen (non-pharmaceutical grade) was purchased from Sigma-Aldrich (St Louis, MO). Giemsa cytological stain was purchased from Sigma-Aldrich. Antibody list: Spp1 (RNAscope® Probe Green, Ref#435191); Tgfb1 (RNAscope® Probe Red, Ref# 407751-C2); Apoe (for in situ hybridization – Advanced Cell Diagnostics, RNAscope® LS 2.5 Probe #313278; for immunohistochemical - Abcam; Cat #ab183597, 1:500; for western blot – Cell Signaling Technology, Cat #49285, 1:1000), CD68 for immunohistochemistry (Cell Signaling Technology; Cat # 97778; 1:1000). Flow cytometric panel for cell sorting and bulk sequencing of macrophages CD16/32 (clone 93; eBiosciences, San Diego, CA), CD11b (clone # M1/70; eFluo450, eBiosciences); Fixable Viability dye (Cat # 65-0865-14; eFluo780, eBiosciences); SigF (clone S17007L; PE-CF594, BD Biosciences, San Jose, CA); CD45 (clone 30-F11; PerCP5.5, Biolegend, San Diego, CA); CD11c (clone # N418; BV705, Biolegend); Ly6G (clone # 1A8; AF700, Biolegend); CD64 (clone X54-5/7.1; PE/Cy7, Biolegend); CD3 (clone # 17A2; BUV395, Biolegend). All other reagents were purchased from Thermo Fisher Scientific, Inc. (Waltham, MA) or Sigma-Aldrich.
Bronchoalveolar lavage, cell counts, ELISA, and western blot analysisFollowing terminal anesthesia, inert mice were subject to cannulation. Bronchoalveolar lavage (BAL) fluid was collected from mice using 1 mL sterile saline lavage and collected into a microcentrifuge tube. Four additional lavages were performed and collected in a separate container. The two fractions were then spun at 400 × g, 6 min. Supernatant from the first lavage was collected and immediately frozen at -80°C for ELISA and western blot analysis, while the two cellular pellets were combined and suspended in 1 ml of saline solution for cell counts, flow cytometric, or RNA sequencing analysis. BAL cells were enumerated using a NucleoCounter (New Brunswick Scientific, Edison, NJ). Aliquots of first lavage were analyzed for IL-4 and IL-13 levels using the Luminex platform (Panel MCYTOMAG-70K-17) following Thermo Fisher’s protocol. For western blot, equal volumes (15 µl) of thawed BAL fluid were loaded onto 4-12% NuPage Bis-Tris gels (ThermoFisher Scientific) with NuPage 4X LDS sample buffer (ThermoFisher Scientific) and then electrophoresed approximately 90 minutes using a constant voltage of 100V. Proteins from the gels were then transferred to a 0.45 μm PVDF membrane at 30V and 4°C for one hour and blocked in 5% non-fat dried milk (NFDM). The membranes were subsequently probed with primary ApoE antibodies. The SuperSignal West Dura Chemiluminescent Substrate detection system was applied before exposing the membrane on the ProteinSimple FluorChem M imager (BioTechne).
Histology, histochemical and In situ hybridization analysisFor histological and histochemical analysis, lungs from unresponsive anesthetized mice were cleared of excess blood through cardiac perfusion with 0.9% sodium chloride solution. A 20-gauge cannula was inserted in the trachea for tissue fixation with 10% neutral buffer formalin at constant pressure (25 cm H2O). A suture was used to seal the tracheal opening upon cannula removal, thus avoiding pulmonary deflation during the fixation process. Tissue was placed in a histology cassette and submerged in 10% neutral buffer formalin for 72 h. The suture was then removed, and the lung sequentially moved to a 2% sucrose solution (in PBS, two washes of 5 min) and 70% ethyl alcohol. The submerged cassettes were submitted to the University of Utah histology core (Associated Regional and University Pathologists Inc.) for embedding. Paraffin blocks were sectioned at 6 µm thickness and used for Hematoxylin & Eosin (H&E) or immunohistochemical staining, alone or in combination with in situ hybridization as previously described (37). For protein staining, paraffin was removed using xylene solutions followed by gradient alcohol washes (100-50%). Citrate antigen retrieval (10.2 mM sodium citrate, pH 6.0, for 20 min) and endogenous peroxidase quenching with 3% hydrogen peroxide in methanol (30 min) were performed. Serum-based blocking (10% goat serum in PBS) preceded the overnight incubation with anti-rabbit primary antibody. In all studies, a serum/IgG control was used. During the second day, slides underwent incubation with a biotinylated secondary antibody (30 minutes, Vectastain Elite ABC kit, Vector Labs, Burlingame, CA) and chromogenic reaction achieved using a Peroxidase Substrate Kit DAB (Vector Labs). Counterstain was accomplished with Harris Modified Hematoxylin (Thermo Fisher Scientific, Inc.). For in situ hybridization studies, after paraffin removal with xylene/alcohol solutions, slides were air dried. Peroxidase quenching (10 min, away from light) was followed by antigen retrieval (20 min, RNAscope® Target Retrieval Reagent, ACD) and incubation with protease IV (30min, RNAscope® Protease IV Reagent, ACD). Excess solution was then washed off. Slides were then incubated for 2 hours in a 40°C hybridization oven with a Spp1, Tgfb1, or Apoe probe. A series of signal amplification steps (6 for single color detection, 10 for double-staining assay) and washes were followed by chromogen development. At this point the experiment was either concluded with counterstain and toluene-based permount coverslip placement, or the immunohistochemistry protocol resumed from the blocking and primary antibody step as described above.
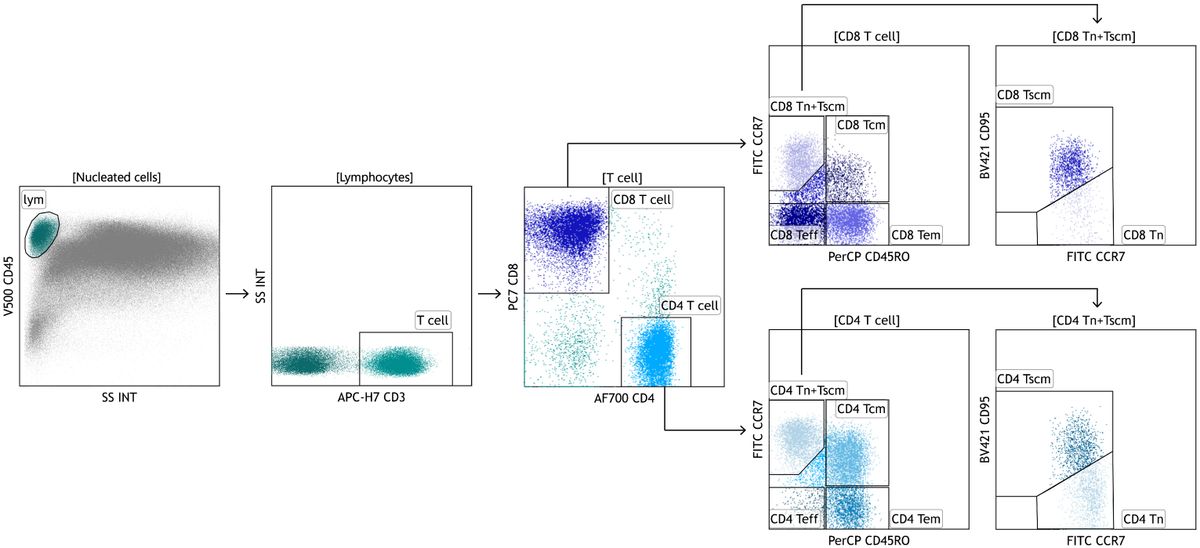
Fluorescence activated cell sortingIn some studies, following cardiac perfusion the left lobe was tied off with a suture and removed for flow cytometric and FACS analysis. Tissue was minced with surgical scissors and transferred into a 50 ml conical tube and incubated (37°C, 30 minutes) in DMEM + 5% FBS + 2 mg/ml Collagenase D (Cat #11088866001, Roche, Indianapolis, IN). Digested lungs were passed through 70-μm nylon mesh to obtain a single-cell suspension, counted and mixed with ACK Lysis Buffer (Thermo Fisher Scientific, Inc.) to remove any remaining red blood cells. The single cell suspension was counted and resuspended to yield 1 x 10⁶ cells per 100µl of flow cytometry staining buffer (PBS+0.1% sodium azide). Cells were then incubated with anti-mouse CD16/32 antibody for 10 min at 4°C to block nonspecific binding. This was followed by 30-minute incubation with fluorescently-tagged antibodies or appropriate isotype controls (0.25–1.5 µg/106 cells) for 30 minutes (4°C). Cells were then spun and resuspended in staining buffer for viability staining (30 minutes at 4°C). Cells were fixed in 2% paraformaldehyde and sorted using a FACS ARIA (BD Biosciences). Alveolar macrophages (SigF+CD11b-CD11c+) were identified following forward and side scatter selection of singlet CD45+ viable cells. To ensure cell sorting of a purified population, a series of exclusion gates were designed to remove eosinophils (SigFintCD11b+CD11c-), neutrophils (Ly6G+) and lymphocytes (CD3+). All analysis was performed using FlowJo software (FlowJo, LLC, Ashland, Oregon).
Bulk and single-cell RNA sequencing preparation and analysisFor bulk RNA sequencing studies (deposited on NCBI GEO GSE166300), sorted SigF+CD11b-CD11c+ macrophages underwent RNA extraction using Qiagen RNeasy Plus Universal mini kit following manufacturer’s instructions (Qiagen, Hilden, Germany). Extracted RNA samples were quantified using a Qubit 2.0 Fluorometer (Life Technologies, Carlsbad, CA, USA) and RNA integrity was checked using Agilent TapeStation 4200 (Agilent Technologies, Palo Alto, CA, USA). RNA sequencing libraries were prepared using the NEBNext Ultra RNA Library Prep Kit for Illumina following manufacturer’s instructions (NEB, Ipswich, MA, USA). Briefly, mRNAs were first enriched with Oligo(dT) beads. Enriched mRNAs were fragmented for 15 minutes at 94°C. First-strand and second strand cDNAs were subsequently synthesized. cDNA fragments were end-repaired and adenylated at 3’ends, and universal adapters were ligated to cDNA fragments, followed by index addition and library enrichment by limited-cycle PCR. The sequencing libraries were validated on the Agilent TapeStation (Agilent Technologies, Palo Alto, CA, USA), and quantified by using Qubit 2.0 Fluorometer (Invitrogen, Carlsbad, CA) as well as by quantitative PCR (KAPA Biosystems, Wilmington, MA, USA). The sequencing libraries were pooled and clustered on 1 lane of a flow cell. After clustering, the flowcell was loaded on the Illumina HiSeq4000 instrument according to manufacturer’s instructions. The samples were sequenced using a 2x150bp Paired End (PE) configuration. Image analysis and base calling were conducted by the HiSeq Control Software (HCS). Raw sequence data (bcl files) generated from Illumina HiSeq was converted into fastq files and de-multiplexed using Illumina’s bcl2fastq 2.17 software. One mismatch was allowed for index sequence identification. Analysis of RNA counts was performed using R (3.6.3) (38). Differential gene expression analysis was conducted using the hciR package (39). Further pathway analysis was conducted using IPA (QIAGEN Inc). Datasets were filtered using log2 fold change (minimum -1 or 1) and p-value cut offs (minimum p<0.05) to ensure an appropriate number of molecules (200-3000) were used in the IPA pipeline.
Single-cell RNA sequencing raw data of SP-CI73T model were deposited in NCBI’s Gene Expression Omnibus and are accessible through GEO Series accession numbers GSE247520 and GSE196657. Tissue collection and single cell suspension were achieved using mechanical mincing, digestion in Collagenase D, red blood cell lysis, and suspension created by using a 70-μm strainer. RNA extraction and library preparation are described in the published manuscript (10). Mining of human control and IPF lungs are accessible through GSE136831 (40). As described by Adams et al., representative apical and basal segments of explanted lungs were minced mechanically, digested [elastase (30 U/ml) + deoxyribonuclease I (0.2 mg/ml) + liberase (0.3 mg/ml) + 1% penicillin/streptomycin], cleared of red blood cells, and single cell suspension created using a 100/70/40 strainers (40). Re-analysis of each single-cell dataset included dimension reduction and clustering by SCTransformation (0.3.5) using the Gamma-Poisson generalized linear model method (glmGamPoi, 1.8.0) and were performed using the Seurat (4.0.4) package (41–45). Multiple levels of resolution were evaluated using Clustree (0.5.0). The data was assessed for cell cycle effects using CellCycleScoring and regressed for uneven cell cycle expression across clusters. Cell types were identified using differential gene expression and all manual annotations were compared to those produced through automated classification using SingleR (1.10.0). A specific R package was used to interface with enrichR database (46). For pseudotime analysis, monocle-3 software was used, while cell-cell communication analysis was conducted with CellChat software (47–51).
Spatial transcriptomic analysisFor spatial analysis (deposited on NCBI GEO GSE264128), neutral buffered formalin-fixed lungs were inflated without bronchoalveolar lavage. Paraffin-embedded sections were baked for 1 hour at 60°C and stained according to the NanoString Leica BOND RX RNA FFPE Semi-Automatic protocol. Following Proteinase K (1.0ug/mL, 15 min) and ER2 (20 min) processing, sections were incubated with fluorescently tagged antibodies against PanCytokeratin (PanCK, Novus Biologics, NBP2-33200AF488; 1:400), Syto83 (S11364; 1:10, Thermo Fisher Scientific, Inc.), CD45 (Nanostring Technologies, 121302304; 1:5), and CD68 (Abcam, ab125212; 1:25). Regions of interest (ROI; N = 3, healthy; N = 4, peri-injured, N = 5, injured/remodeled) were selected based on histopathological assessment of inflammation and epithelial thickening and remodeling. Tissue segmentation selectively identified CD45+CD68+ macrophages. The collection plate was then removed from the GeoMx instrument and prepared for sequencing. The GeoMx library was prepared, processed, and sequenced according to the NanoString NGS Readout User Manual Protocol (ref. MAN-10153-04). Sequencing was performed on the Illumina NovaSeq 6000, S2 v1.5 with a 100 cycles flowcell at 27 bp pair-end reads. Generated FASTQ files were then processed to DCC files utilizing the NanoString GeoMx NGS Pipeline according to manufacturer’s instructions. Gene expression was analyzed using Nanostring DSP analysis software (NanoString Technologies) with built-in statistical analyses. Raw data counts were run through internal quality control and biological probe quality control.
Statistical analysisUnless otherwise indicated, all data are presented as group mean ± SE. Statistical analyses were performed with Prism GraphPad 9.4 (GraphPad Software, San Diego, CA). Student’s t-tests were used for paired data; for analyses involving multiple groups, one-way or two-way analysis of variance (ANOVA) was performed with post hoc testing as indicated. Survival analyses were performed using Log Rank (Mantel-Cox) test. For spatial analysis, segments were filtered to 55% of the limit of quantitation (LOQ) to render the top 6,000 expressed genes. Filtered genes were normalized to Q3 (3rd quartile of all selected targets). Hierarchical clustering was performed as quality control. CD68 ROIs were compared across regions using a linear mixed model (LMM) with Benjamini-Hochberg (BH) correction and a random effect for the region. For RNA sequencing pathway analysis, Wilcoxon rank sum test was used. In all cases, statistical significance was considered at p ≤ 0.05.
ResultsSpatial discrimination of activated macrophages during SP-CI73T-induced injuryTo spatially define the phenotype of macrophages involved in fibrotic lung injury, fluorescent antibodies recognizing DNA (green), CD45 (yellow) and CD68 (red) were used to perform bulk sequencing in the injured/remodeled or peri-injured alveolar regions of the lung 14 days post SP-CI73T injury. A control (non-induced) lung was used to define baseline activation. Identification of injured regions was based on histopathological evaluation of all five lobes in the tissue sections. Four peri-injured areas were selected: two in relative proximity to the injury (areas of interest 006 and 010) and two distal region (areas of interest 009 and 012) (Figure 1A). Cell-type deconvolution analysis was used to resolve monocyte/macrophage specific expression signature from the dataset (52) (Supplementary Table 1). Principal component analysis identified clustering of transcriptomes based on sampling annotation, with separation in the peri-injured regions based on proximity to injury (Figure 1B; Supplementary Table 1). Global pathway map showed extensive expression of genes involved in metabolism (including RNA metabolism), signal transduction, transcriptional regulation, immune system function and cell cycle (Supplementary Figure 1A). Reactome-based analysis revealed 20.9% (148/712 pathways) and 34.9% (249/712 pathways) of pathways as differentially expressed when comparing peri-injury vs. healthy macrophages and peri-injury vs. injured cells, respectively. Notably, macrophages isolated form injured regions did not produce a particularly strong signaling signature and demonstrated a considerable degree of similarity to healthy macrophages (≈90% of pathways) (Figure 1C; Supplementary Figures 1B–D). Peri-injured macrophages were enriched in pathways associated with neutrophil degranulation, ROS/RNS production and release, activation in oxidative stress-induced senescence, pro-remodeling functions (TGF-beta and GPVI cascade), and metabolic alterations (citric acid cycle, gluconeogenesis, lipoprotein assembly/remodeling/clearance) compared to healthy- and injured-derived CD68+ macrophages (Figures 1D, E; Supplementary Table 1). When compared to controls, injured region macrophages were defective in programmed cell death signaling, ROS detoxification, and elastic fiber formation, but displayed enhanced DNA damage-induced senescence, degradation of extracellular matrix (ECM), and metalloproteinase function (Figure 1F). Hierarchical gene expression analysis of pathways related to degradation of ECM (Figure 1G), assembly of collagen fibrils (Figure 1H), complement system, adaptive immunity, and L13a-mediated ceruloplasmin expression all showed robust clustering based on region of origin (Supplementary Figures 1B–D, Supplementary Table 1).
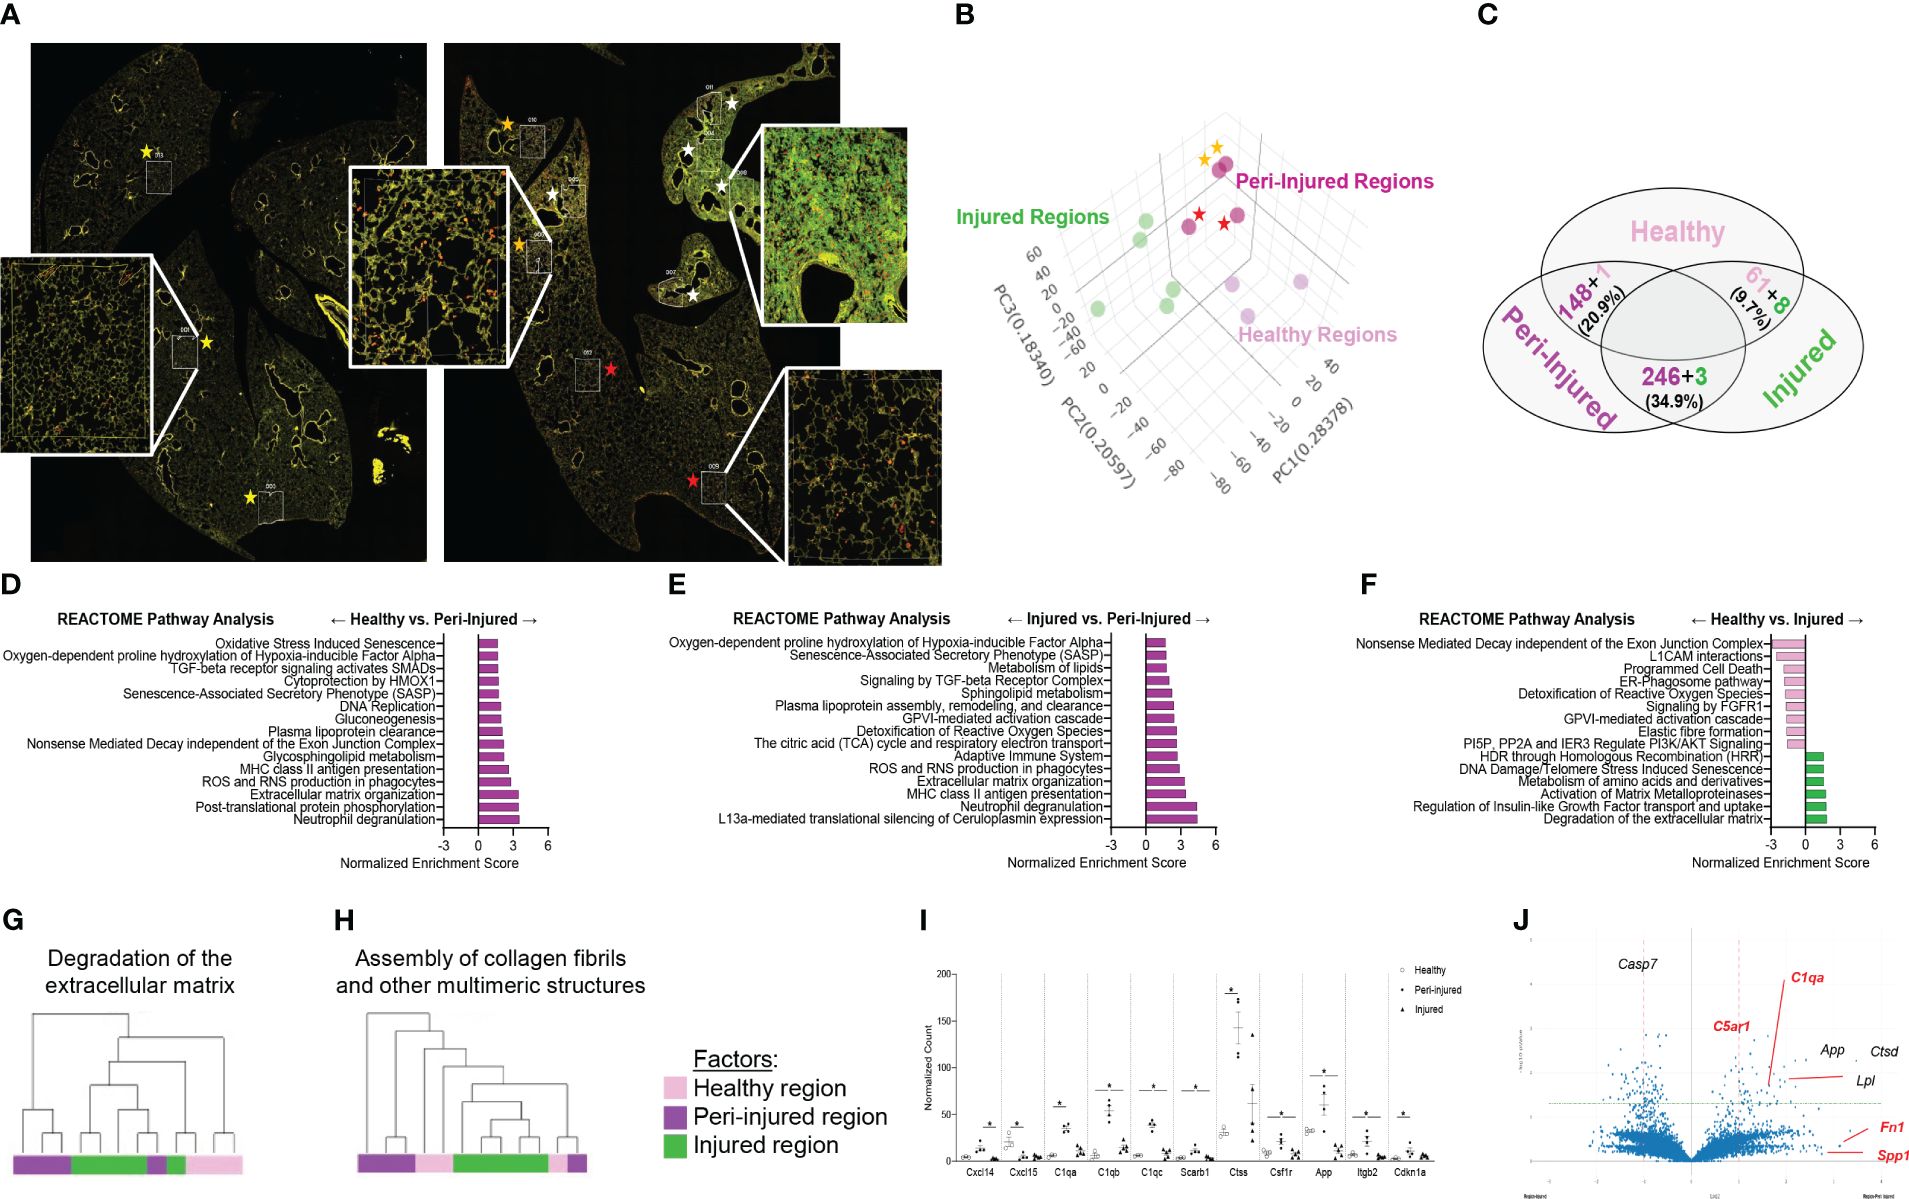
Figure 1 Spatial analysis of CD68+ macrophages in SP-CI73T induced injury. Paraffin-embedded sections from controls or 14 days post SP-CI73T injury were stained with fluorescent antibodies against CD45, CD68, and DNA. (A) Twelve alveolar regions were selected for CD68+ macrophage RNA sequencing (cells labeled in red). Regions from an untreated mouse were used as controls (three technical replicates; yellow asterisks). Injured/remodeled (five technical replicates; white asterisks) and peri-injured (two proximal technical replicates, orange asterisks; two distal technical replicates; red asterisks) region selection was based on histopathological assessment of inflammation and loss of alveolar architecture structure. Insets show representative regions. (B) Three dimensional PCA plot shows the clustering of samples based on sampling regions. Orange asterisks indicate two proximal technical replicates; red asterisks indicate two distal technical replicates. (C) Venn diagram of Reactome-based pathway analysis shows differentially regulated pathways between each pairing. (D–F) Bar graphs representing normalized enrichment scores for selected pathways. (G-H) Hierarchical clustering of ‘Degradation of the extracellular matrix’ and ‘Assembly of collagen fibrils and other multimeric structures’ signaling pathways in healthy (dark purple), peri-injured (pink), and injured (green) regions of the lung 14 days after SP-CI73T induced injury. (I) Box plots of selected genes associated with macrophage activation (chemokine, metalloproteinases, complement cascade). The Y-axis represents normalized counts. A p-value ≤0.05 was considered significant using Linear Mixed Model. (J) Volcano plot comparing gene expression between peri-injured and injured macrophages. Fold changes are represented on log2 scale. Significance is shown as -log10(pvalue) using linear mixed model. In red are representative complement and fibrosis-associated genes.
Among the top 6,000 genes expressed genes in the dataset, genes associated with complement responses (C1qa, C1qb, C1qb), myeloid cell recruitment (Cxcl14, Cxcl15), inflammation (Csf1r, Ctss, App) and metalloproteinases (Mmp13, Mmp14, Mmp15) were most abundant in peri-injured macrophages (Figure 1I). Despite increases in normalized counts for fibrogenic genes and significant enrichments in the associated pathways, expression of the individual genes did not meet significance (Fn1, Spp1) (Figure 1J; Supplementary Figures 1E–G).
Temporal heterogeneity of resident alveolar macrophages during SP-CI73T-induced injuryTo better understand macrophage behavior in the events leading up to end-stage fibrosis, we sought to examine transcriptional changes in resident macrophages using a model of fibrogenic injury triggered by mutant SP-CI73T. For these studies, we leveraged bulk RNA sequencing of flow cytometry sorted CD11b-SigF+CD11c+CD64+ resident mature macrophages isolated from naïve (controls) and inflamed lungs. Exclusion gate ensured no contamination from Ly6G+ neutrophils, B220+ B cells, and CD3+ lymphocytes. Ingenuity Pathway Analysis highlighted distinct gene and signaling signatures in lung macrophages during inflammatory initiation (3 days post mutant induction) and early remodeling (14 days). Principal component analysis highlighted transcriptional variance across the study groups (Figure 2A). Differential gene expression analysis revealed a relatively small set (48 genes) between controls and 3-day injury, while these responses were more pronounced between controls vs. 14-day post induction (3393) or 3-day vs. 14-day comparison (1446) (Figure 2B). Volcano plots showed increases in genes linked to innate immunity (the hematopoietic transcription factor, Gata2; histidine decarboxylase, Hdc; interferon induced transmembrane protein 1, Ifitm1; colony stimulating factor 1, Csf1; chemokine ligand, Ccl17; immunoglobulin epsilon receptor, Ms4a2) and metabolism (cholesterol side-chain cleavage enzyme, Cyp11a1; ATPase Na+/K+ transporting subunit alpha 3, Atp1a3; adenylate cyclase 6, adcy6; peptidyl arginine deiminase 2, Padi2; and myristoylated alanine rich protein kinase C substrate, Marcks) 3 days post injury (Figure 2C). By comparison, macrophage expression profile was bidirectional at 14 days, and demonstrated more sizable changes (as represented by adjusted p-values and log fold changes). Immunity, cell cycle, and metabolism genes were among the most significantly altered genes (complement C1q C-chain, C1qc; peptidoglycan recognition protein 1, Pglyrp1; ADAM metallopeptidase domain 19, Adam19; secreted protein acidic and cysteine rich, Sparc; apolipoprotein E, Apoe; insulin like growth factor 1 receptor, Igf1r; toll-like receptor 7, Tlr7; cyclin D2, Ccnd2 (Figure 2D). Ingenuity Pathways Analysis predicted signaling related to activation, proliferation, and apoptosis of leukocyte predominantly at 3 days, while distinct cell movement and chemotaxis pathways, proliferation, angiogenesis and fibrogenesis were projected to be induced 14 days post-induction (Figure 2E; Supplementary Table 2). Specific pathways linked to NFAT dependent regulation of immune responses (directionality/z-score 1.90), Th1 and Th2 activation (no predicted z-score), granulocyte adhesion and diapedesis (no predicted z-score), and STAT3 signaling (z-score 1.13) were noted 3 days post injury. Comparatively, glycoprotein 6 (z-score 5.48), IL-15 production (z-score 5.00), fibrosis (z-score 6.71) and epithelial-mesenchymal transition signaling (no z-score), and osteoarthritis (z-score 3.34) were identified in macrophages at 14 days (Figure 2F). Notably, IPA’s Upstream Regulators analysis predicted activation of pro-inflammatory signals at 3 days (NFKB1, IL5, IFNG, prostaglandin E2, STAT3 and STAT6), and conventional fibrogenic pathways (TGFB1, TP53, FGF2, and SOX2) 14 days (Figure 2G). Reactome-based breakdown of top differentially expressed genes from the Interferon-γ pathway identified distinct gene-sets expressed during inflammatory initiation (Ifi203, Ifi206, Ifi209, Ifi213, Stat4) and 14 days post injury (S100a8, Arg1, Csf1, Alox15, Retnla, Il4) (Figure 2H; Supplementary Table 2). A comparable dual response was observed in the TGF-β1 (3 days: Ms4a2, Ctsk, Clec2i and Cd55; 14 days: Il1rl1, Arg1, Alox15, F13a1, Itgam, Ptgs2, C1qc, and Anxa8) and IL-4 signaling pathways (3 days: Ms4a1, Cxcl5, Il6, Stat4; 14 days: S100a8, Agf2r, Csf1, Retnla, Il4) (Figures 2I, J). ELISA-based validation of this established pro-fibrotic pathway confirmed increases in IL-4 and IL-13 expression in the bronchoalveolar lavage fluid 7-14 days post SP-CI73T injury (Figure 2K). Notably, IL-15 and Glycoprotein-6 signaling, as well as angiogenesis displayed time restricted enrichments (14 days post-induction) (Supplementary Figures 2A, B, and not shown).
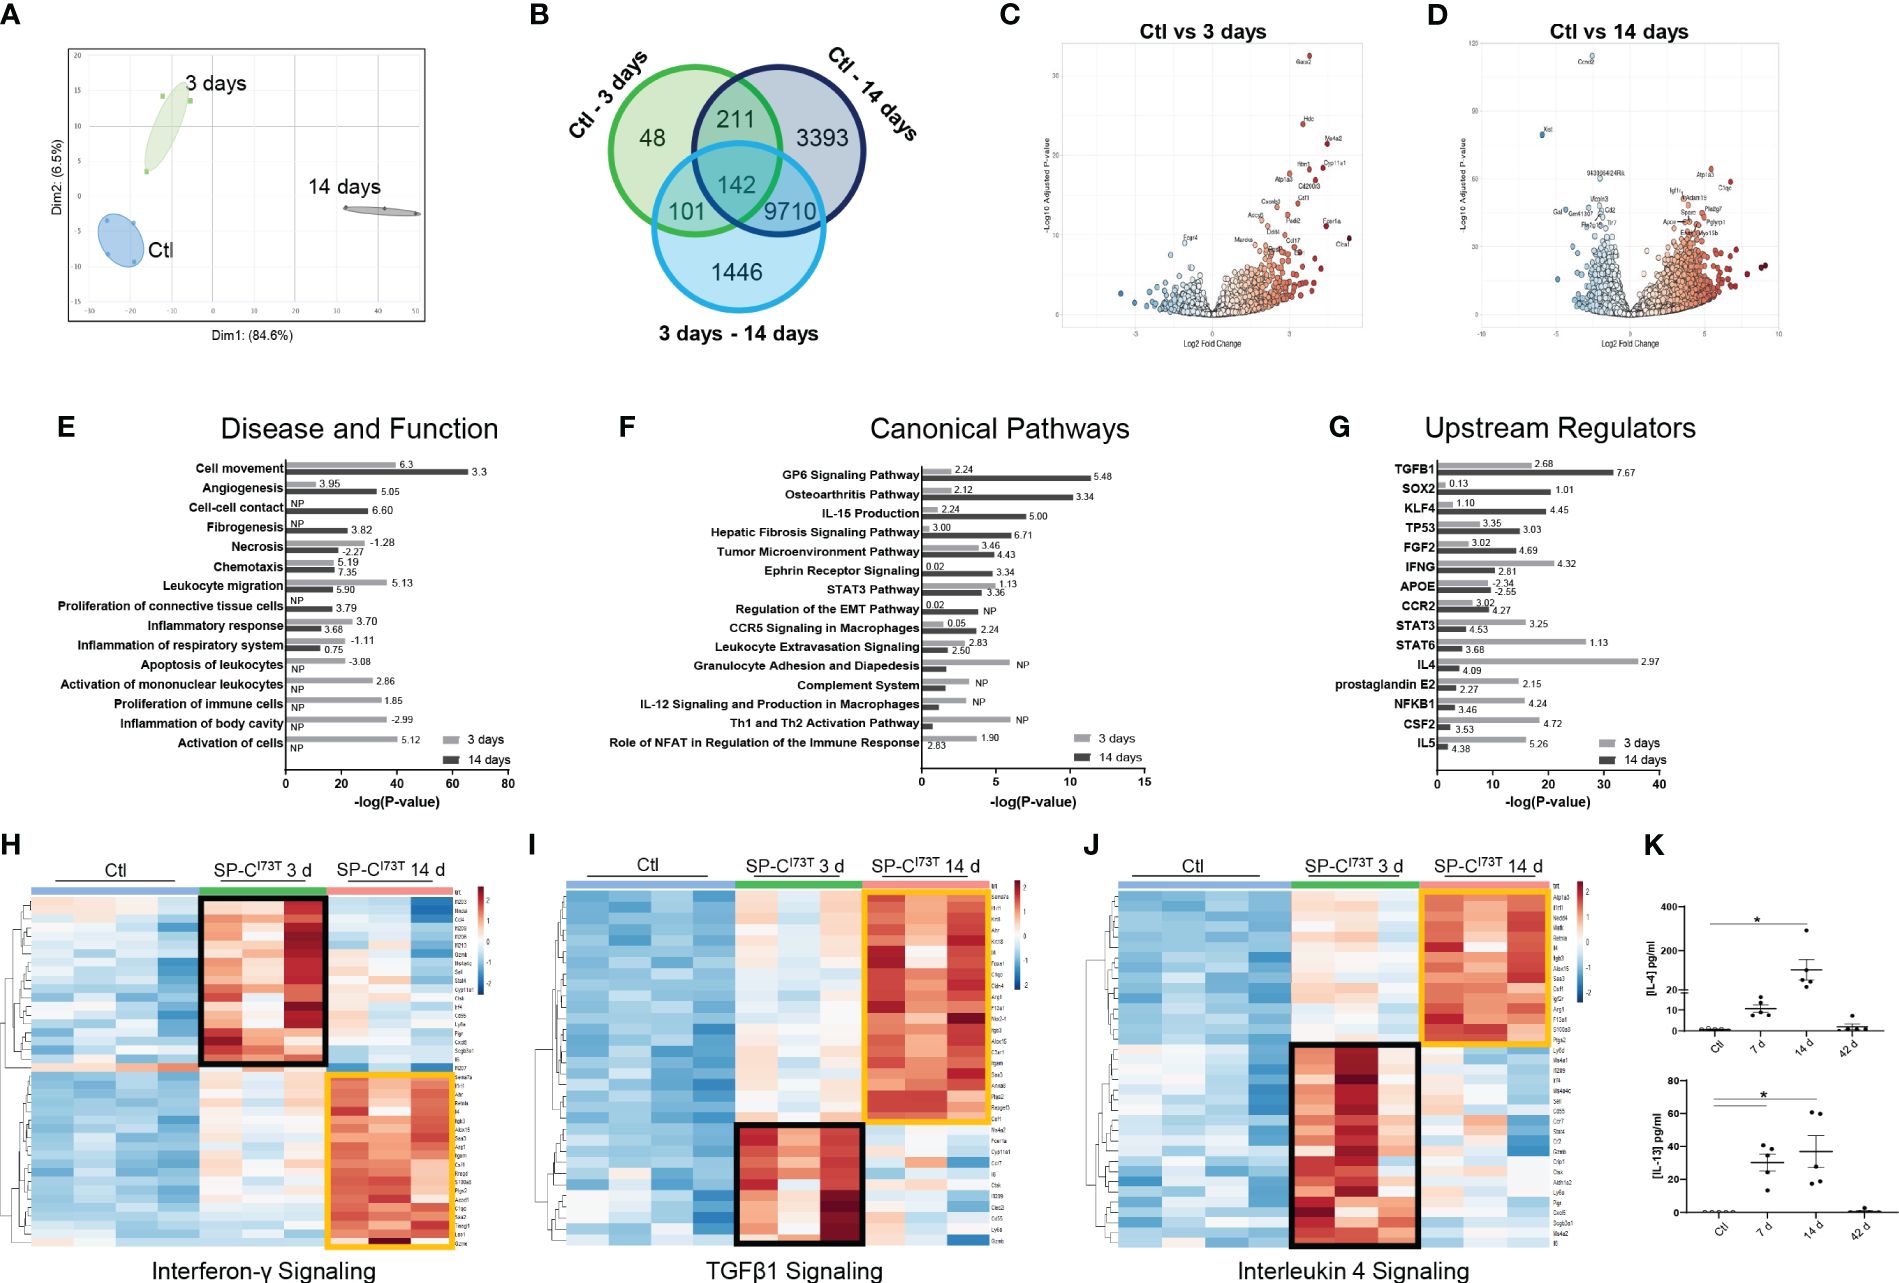
Figure 2 Transcriptional analysis of flow cytometry sorted alveolar macrophages following SP-CI73T induced injury. Bulk RNA sequencing of flow cytometry sorted CD11b-SigF+CD11c+CD64+ resident lung macrophages from control (N=4; Ctl, oil treated SP-CI73T mice) or tamoxifen-treated SP-CI73T mice at 3 d and 14 d (N=3 for each condition). (A) Principal Component Analysis (PCA) plot showing transcriptome variance in Ctl (blue), 3 days (black), and 14 days post SP-CI73T induced injury. (B) Venn diagram breaking down significantly expressed genes among groups. (C, D) Volcano plots comparing fold change expression between Ctl vs. 3 days and Ctl vs. 14 days. (E-G) Ingenuity Pathway Analysis (IPA) of enriched Diseases and Functions, Canonical Pathways, and Upstream Regulators in lung macrophages 3- and 14-days after injury relative to Ctl. Bars represent enrichment [−log(pvalue)] 3 days (gray) and 14 days (black) after injury. Z-scores indicate predicted activation and inhibition respectively (N.P. not predictable). (H-J) Heat maps depicting significantly altered genes associated with Interferon-γ, TGFβ1, and Interleukin-4 signaling 3- and 14-days after injury relative to Ctl; criteria for significance was a 5% false discovery rate. Note that orange and black boxes highlight signatures specific to a given time point. (K) ELISA for IL-4 and IL-13 from SP-CI73T BAL fluid collected from controls, 7 days, 14 days, or 42 days post injury. Dot plots with Mean + SE are shown. *p < 0.05 versus control group using One Way ANOVA followed by Tukey post-hoc test.
Single-cell RNA sequencing reveals activation of distinct monocyte/macrophage clusters responding to SP-CI73T induced injuryWe then employed single-cell RNA sequencing to overcome the constraints (and therefore bias) of antibody-based analysis of macrophages involved in SP-CI73T induced injury. A 59,440-cell dataset including healthy controls (29,213 cells), and two injury times representing peak inflammation (14 days - 14,266 cells) and established fibrosis (42 days - 15,961 cells) were studied. Population clustering using SCTransformation with the glmGamPoi method at a resolution of 0.4 yielded 33 clusters (Supplementary Figure 3A). Partition of the clusters based on origin/identity (Ctl, 14 days, 42 days) highlighted shifts in endothelial cells (cluster 25), eosinophils (cluster 8), and macrophages (cluster 9) composition after SP-CI73T injury (Figures 3A, B). A combination of SingleR, manual annotation, and the top three non-redundant genes from each populations was used for identification of epithelial (3), endothelial (6), mesenchymal/stromal (3), megakaryocytes, granulocytes (3), B cells (4), lymphocytes (4), and mononuclear myeloid populations (9) (Figure 3C; Supplementary Figures 3B–I). Macrophage Cluster 19 (identified in only one of the eleven specimens) and Cluster 32 (of low abundance and merged with Cluster 3 after pseudobulk analysis determined high degree of transcriptional overlap).
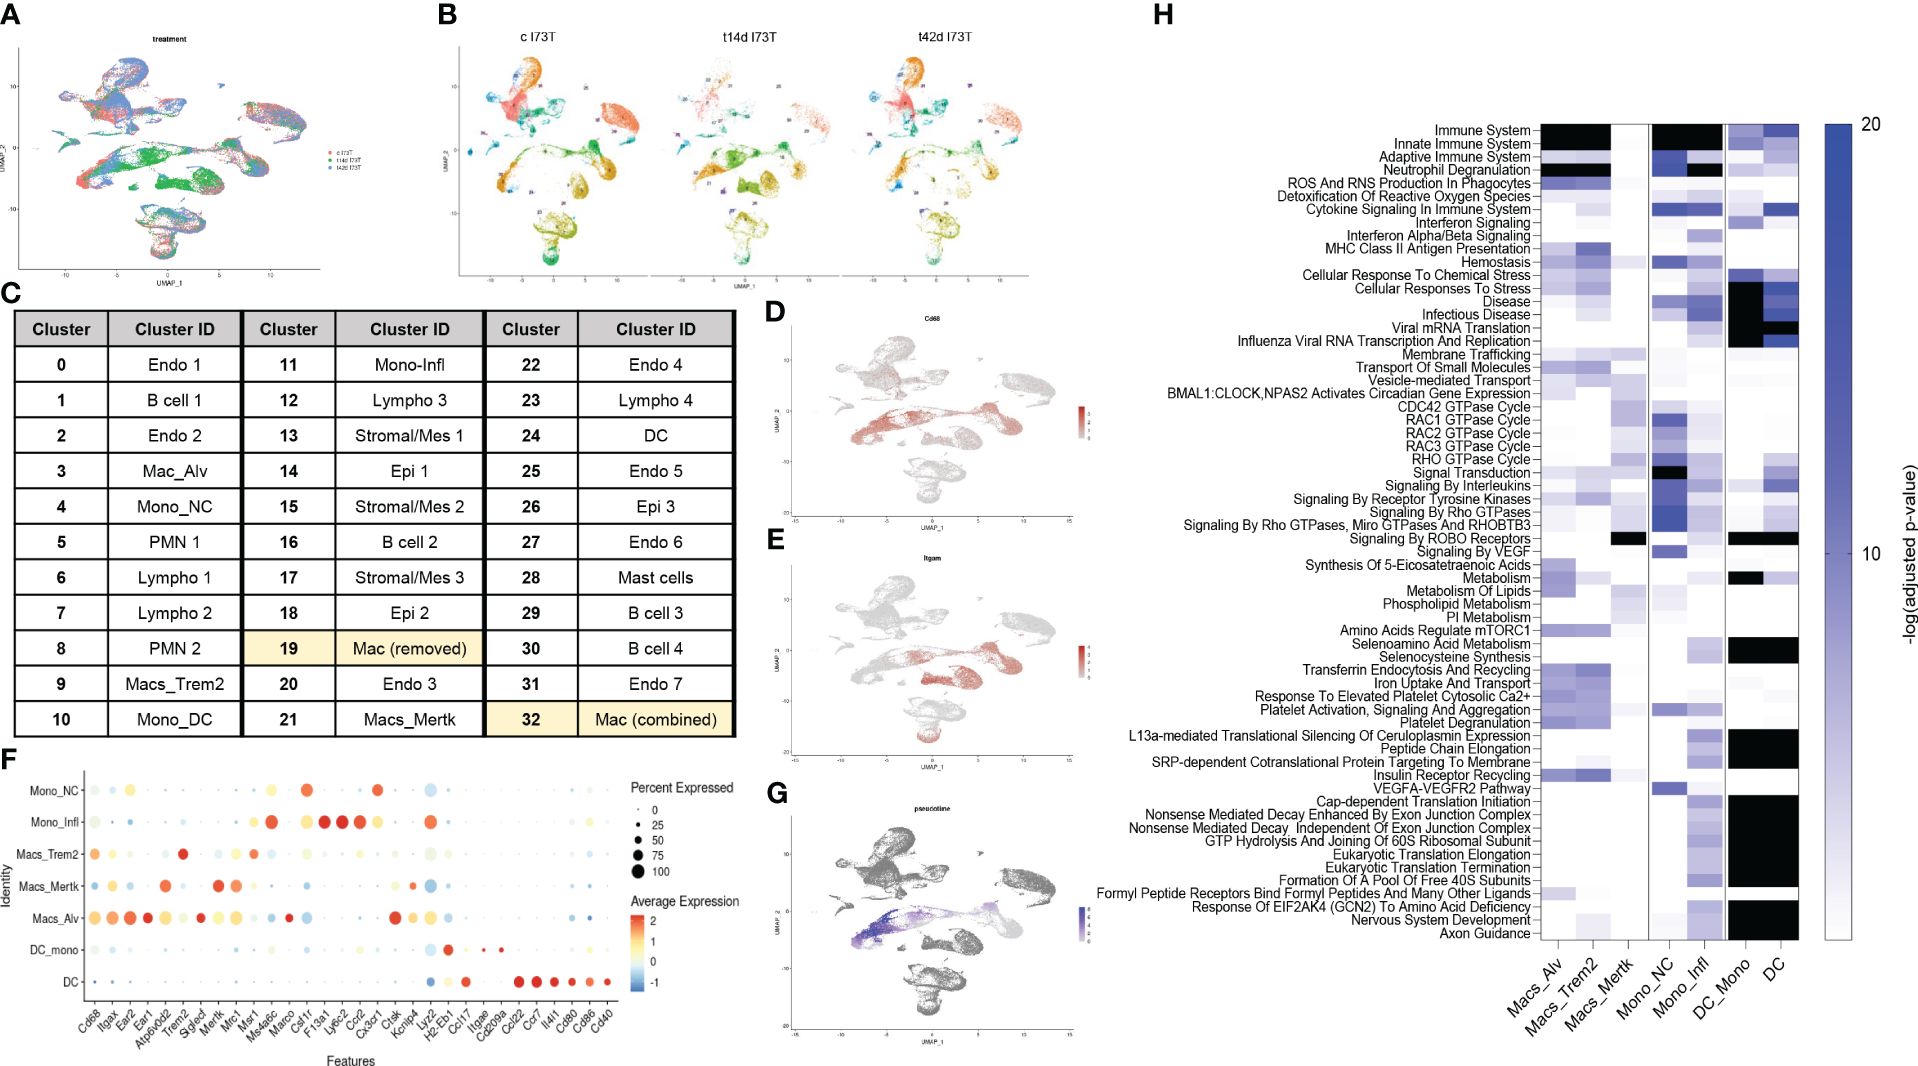
Figure 3 Single-cell RNA sequencing of SP-CI73T induced injury and fibrosis. Single-cell RNA sequencing analysis was performed on collagenase digested single cell suspensions from controls (Ctl, oil treated SP-CI73T mice), 14 days or 42 days post SP-CI73T induction. (A) UMAP analysis overlaying cells from controls (cI73T, pink), 14 days (t14d I73T, green), and 42 days (t42d I73T, blue). (B) Split identify UMAP depiction of all cellular clusters identified in controls (cI73T), 14 days (t14d I73T), and 42 days (t42d I73T) at 0.4 resolution. (C) Cluster breakdown identifying 7 endothelial, 3 mesenchymal, 3 epithelial, 2 polymorphonuclear, mast cells, 4 B cell, 4 lymphocytic, and 9 mononuclear myeloid clusters. Note that mononuclear myeloid clusters were renamed based on single R and manual annotation: cluster 3 = Mac_Alv; cluster 4 = Mono_non classical/NC; cluster 9 = Mac_Trem2; cluster 10 = Mono_DC; cluster 11 = Mono_inflammatory/infl; cluster 19 = was removed from further analysis as it was identified solely in one of the controls; cluster 21 = Mac_MerTK; cluster 24 = DC; cluster 32 = was combined with cluster 3/Mac_Alv since pseudobulk analysis revealed analogous gene expression and pathway activation. (D, E) UMAP analysis for Cd68 and Itgam/Cd11b defines distribution and cellular expression in the SP-CI73T lung. (F) Bubble plot of selected genes associated with macrophage maturation (Trem2, Itgax, Ear1, Ear2, Atp6v0d2, Siglecf, Mertk), recruitment and activation (F13a1, Ly6c2, Ccr2, Cx3cr1, Ctsk, Lyz2, H2-eb1, CcL22, Ccl17, Cd80, Cd86) in all annotated monocytes/macrophages/dendritic cell clusters (Mo/Mac/DCs). (G) Pseudotime UMAP analysis. Note color intensity defining cellular maturation among monocyte/macrophage clusters. (H) Enrichr-based Reactome pathway analysis for the top-15 predicted pathways in the 7 resulting monocyte/macrophage/DC clusters. Single gradient color heatmap shows logarithmic adjusted p-values. Values above the arbitrary threshold (-log of adjusted p-value) of 20 were color-coated in black.
Uniform Manifold Approximation and Projection (UMAP) analysis for the pan-macrophage gene Cd68 and the mobilization marker Itgam/Cd11b were utilized to locate resident and recruited macrophages, monocyte-derived, and by exclusion monocytes and dendritic cells (Figures 3D, E). A curated gene set (mobility, maturity, and activation markers) combined with pseudotime analysis was used to clearly differentiate mononuclear myeloid clusters (Supplementary Table 3). Cluster 3 was annotated as alveolar macrophages since it expressed a combination of Cd68, Itgax, Ear1, Ear2, Siglecf, and moderate levels of Mertk (Figure 3F). Reconstructed trajectory analysis also predicted terminal differentiation within the alveolar macrophage cluster (Figure 3G). Cluster 9, identified as interstitial macrophages (Cd68, Msr1, and C1qa), was labeled based on its specific expression of Trem2 (Figure 3F and not shown). Cluster 21 (macs_mertk) was identified as a mature subset based on pseudotime analysis and distinctive expression of Mertk alongside Itgax, Mrc1, Atp6v0d2, Kcnip4. This cluster was found solely in controls and 42 days post injury (Figures 3F, G). Two monocyte-like subsets were annotated as non-classical/NC (cluster 4 - Csf1r, Cx3cr1) and classical/inflammatory (cluster 11 - Ccr2, Ly6c2, Lyz2, Ms4a6c, F13a1) (Figure 3F; Supplementary Table 3). Cluster 10 was annotated as monocyte-derived DCs based on a mixed myeloid and lymphoid signature (Ccr2, Itgae/Cd103, Cd209/Dc-sign) and major histocompatibility complex genes. A cluster of lymphoid-derived DCs (cluster 24) lacking all classical myeloid features and expressing Cd80, Cd86, Cd40, Il4i, Ccr7, Ccl17, and Ccl22 was also annotated (Figure 3F). Split identity analysis of these curated gene sets also highlighted time related changes in the expression of established macrophage maturity and identity genes (e.g. Atp6v0d2, Itgax, and Cd68 expression increases, downregulation of Siglecf, Ear1, and Ear2) (Supplementary Figure 4A). Similar trends were observed for neutrophils (PMN 1 lost Ptgs2 and Tgm2 in favor of Retnlg and Lcn2), eosinophils (PMN 2 - Siglecf, Itgam, Cxcr2, Cd33, Csf3r, Tgfbr1), epithelial cells (Epi1 - Cldn18, Ager, Hopx, Krt8, Krt19, Sftpb), mesenchymal/stromal cells (Mes 2 - Tgfbr3, Ccn1, Pdgfra, Npnt, Loxl1, Ecm1, Fgf2), and lymphatic endothelial cells (Endo 6 - Nrgn, Itga2b, Gp1bb increased 14 days post injury). By comparison, B and T cells showed limited transcriptional fluctuation over the 42-day injury (Supplementary Figures 4B–G).
Pseudobulk differential expression analysis of Trem2+ macrophages surveyed gene expression and patterns during injury. Approximately 700 genes demonstrated a transient drop in abundance at 14 days (expression pattern group-1), while the abundance of 621 genes was significantly increased following SP-CI73T induction (expression pattern group-2) (Supplementary Figure 5). Smaller gene sets were shown to transiently increase at 14 days (122 genes, expression pattern group-3) or steadily decrease after SP-C induction (61 genes, expression pattern group-4) (Supplementary Figure 5). Notably, Reactome-based analysis predicted no significant pathway to be altered for genes annotated in expression pattern-1, while cytokine and interleukin signaling, immunity, antigen presentation, and lipid and carbohydrate metabolism were among significant pathways for expression pattern-2 genes. By comparison, transcript abundance in inflammatory monocytes followed two expression patterns: transient decrease (237 genes) or increase (158) at 14 days post injury. The latter predicted engagement of pathways related to complement cascade, extracellular matrix organization and immune responses (Supplementary Table 3).
Reactome-based analysis of the top-15 most significantly regulated pathways revealed shared inflammatory signature (‘immune system’, ‘neutrophil degranulation’, ‘ROS and RNA production in phagocytes’) between alveolar macrophages and Trem2+ interstitial macrophages, though at considerably different adjusted p-values (Alv macs p-value <10-25 vs. Trem2+ p-value <10-103) (Figure 3H; Supplementary Table 3). By comparison, Mertk+ cells were not predicted to engage in innate or adaptive immunity or cytokine mediated signaling, but generated a strong GTPase signature (CDC42, RAC, RHO, and ROBO/SLIT). Examination of monocyte-like clusters highlighted analogous ‘cytokine signaling in immune system’, ‘innate immunity’, and ‘neutrophil degranulation’ engagement. Cx3cr1+ non-classical cells excelled in ‘VEGF signaling’, ‘signaling by tyrosine kinases’, and ‘Rho GTPase signaling’, while Ccr2+Ly6c2+ classical/inflammatory monocytes produced a signature related to RNA synthesis and translation and pathways involved in ‘cellular response to stress’. Lastly, monocyte-derived and lymphoid DCs produced comparable activation profile (infectious disease response, translational elongation and termination, and ribosomal homeostasis) (Figure 3H).
Macrophages from human IPF display a comparable phenotype as murine SP-CI73T injury.A recent dataset published by Adams and colleagues provided in depth assessment of epithelial, endothelial, mesenchymal, and immune populations in healthy and IPF tissue explants (40). The mononuclear myeloid compartment from this set (44,226 cells; 12,514 from controls and 31,712 IPF, GSE136831) was re-examined to define similarities between clinical and experimental fibrosis. To avoid overfitting the data, the lowest resolution was utilized (0.1), ultimately generating 5 major subsets (Supplementary Figure 6A). UMAP analysis identified clusters 3 and 4 solely in the controls, with an expansion in clusters 0 and 1 was noted in IPF (Figure 4A). Cluster-based analysis of top-5 non-redundant genes revealed differential expression for SPP1, CTSK, MMP7 (cluster 1) and FABP4 (cluster 2) (Figure 4B; Supplementary Table 4). Disease-based analysis highlighted notable changes in cluster 0 (SPP1, C1QC, APOE) and cluster 1 (THBS1, FN1), consistent with our murine dataset, including, (Figures 4B, C, Supplementary Table 5). A curated set of 25 identity and lipid associated genes, used to annotate this clusters, identified cluster 0 as an interstitial macrophage population (widespread expression of ITGAX, TREM2, MRC1, ITGAM, APOE) and Cluster 1 as alveolar macrophages (ITGAX/CD11C, ITGAM, ABCA1). Notably, cluster 1 also displayed a signature characteristic of a potentially pro-fibrotic monocyte-derived population in IPF lungs (TREM2, MERTK, ATP6V0D2, CTSK, COL4A2, MMP7, MMP9) paired with a shift in metabolic function (FABP5, LPL and LIPA increases). Clusters 2, 3 and 4 did not exhibit distinguishing signatures besides overexpression of major histocompatibility complex genes (HLA-DRB6) (Figure 4C; Supplementary Figure 6B). UMAP analysis of the distribution of MERTK and fibronectin1/FN1 demonstrated widespread presence in cluster 0 and 1 of the IPF lung, while ostepontin1/SPP1 was restricted to cluster 1 (Figures 4D–F). Tumor growth factor β1/TGFβ1 was expressed in all cells regardless of disease state (Supplementary Figures 6C, D). Enrichr-based pathway analysis using the Reactome database highlighted IPF induced changes (annotated as “global”) in all facets of immune cell behavior, including “Immunity”, “Cellular Responses to Stress”, “Cytokine Signaling in Immune System”, complement activation, and GTPase signaling, and control of transcription and translation. Clusters 0, 1, 2 were responsible for the majority of these signals (Figure 4G; Supplementary Table 4). Direct comparison of Reactome pathways from the spatial analysis and both the murine and human single-cell sequencing datasets highlighted similarities between cluster 1 annotated in the human IPF dataset and inflammatory monocytes from the SP-CI73T mouse model. No distinctive similarities were noted with respect to CD68+ macrophages sampled from peri-injured and injured regions of the lung during our spatial analysis (Figure 4H).
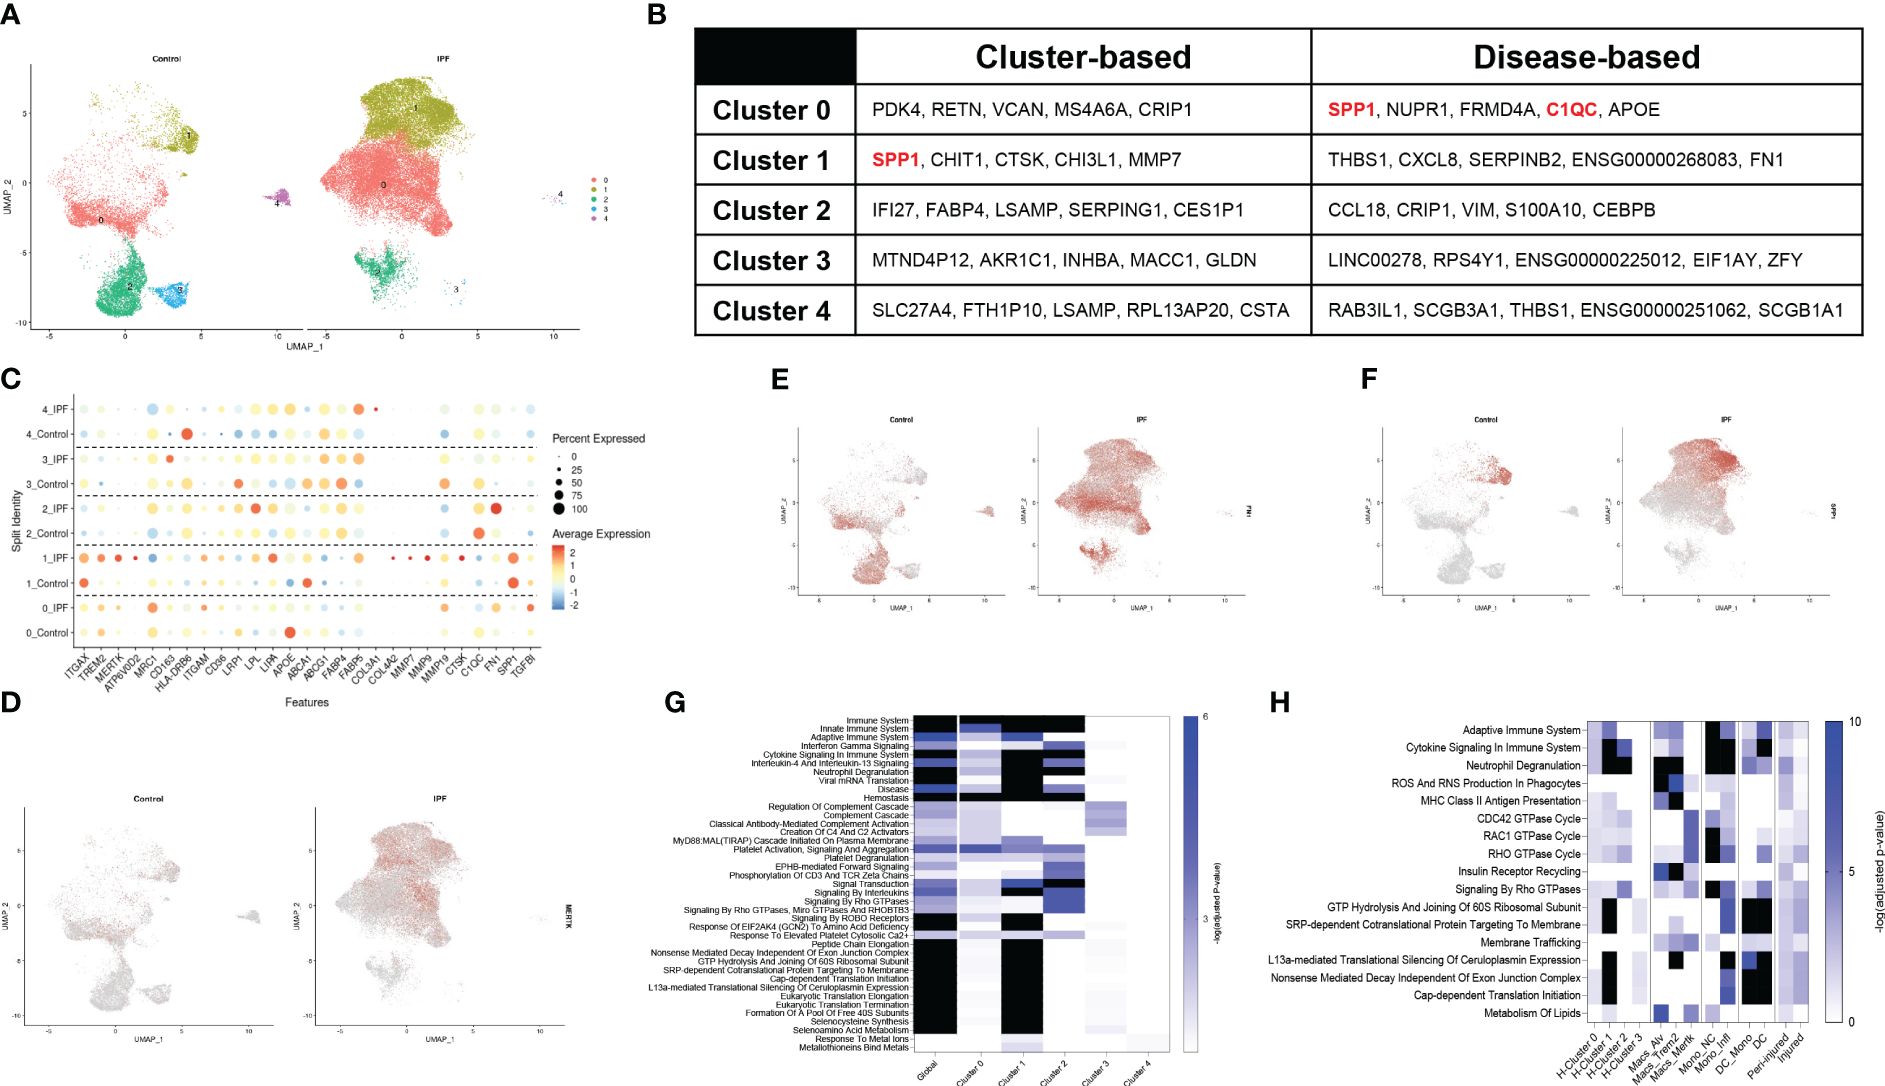
Figure 4 Single-cell RNA sequencing of annotated macrophages from human IPF. Macrophages from a published IPF dataset (GSE136831) were re-mined. (A) Split identity UMAP analysis of clusters annotated at 0.1 resolution using the Seurat analysis package. (B) Cluster-based and disease-based top-5 non-redundant genes from annotated clusters. (C) Split identity UMAP shows expression distribution for TREM2 in control and IPF lungs. (D) Split identity bubble plot of selected genes associated with macrophage maturation (TREM2, MERTK, ATP6V0D2, ITGAX), recruitment and activation (ITGAM, CD163, HLA-DRB6, CTSK, COL3A1, COL4A2, MMP7, MMP9, FN1, SPP1, TGFBI), and lipid homeostasis (APOE, CD36, LRP1, LPL, LIPA, ABCA1, ABCG1, FABP5, PPARG). (E) Split identity UMAP showing expression distribution for MERTK in control and IPF lungs. (F) Split identity UMAP showing expression distribution for FN1 in control and IPF lungs. (G) Split identity UMAP showing expression distribution for SPP1 in control and IPF lungs. (H) Enrichr-based Reactome pathway analysis for the top-15 predicted pathways between controls and IPF samples. Single gradient color heatmap shows logarithmic adjusted p-values. Values above the arbitrary threshold (-log of adjusted p-value) of 6 were color-coated in black. (I) Enrichr-based Reactome pathway analysis comparing significant pathways in mononuclear myeloid clusters from the human IPF dataset, SP-CI73T spatial transcriptomics, and SP-CI73T single-cell sequencing datasets. Single gradient color heatmap shows logarithmic adjusted p-values. Values above the arbitrary threshold (-log of adjusted p-value) of 10 were color-coated in black.
Osteopontin1 and fibronectin1 intercellular communication during SP-CI73T induced injuryCellChat software was utilized to predict communication among cellular clusters during SP-CI73T induced fibrotic injury. Initial analysis grouped all 33 clusters into 7 macro-groups (epithelial, endothelial, stromal, B cells, granulocytes, lymphocytes, and Mo/Mac/DCs) (Supplementary Figure 7A) (51, 53). CellChat based aggregation of ligand: receptor expression estimated increases in differential number and strength of interaction between mesenchymal-epithelial and mesenchymal-Mo/Mac/DCs and within epithelial clusters 14 day post-injury, relative to controls. Within the Mo/Mac/DC macro-groups the communication was estimated to increase in strength (Supplementary Figure 7B). Interrogation of the inter-cluster network 42 days post-induction showed increased interactions in stromal and Mo/Mac/DC macro clusters relative to controls and 14 days (Supplementary Figures 7C, D), with incoming and outcoming signals from the Mo/Mac/DC macro-cluster associated with SPP1 and FN1 pathway (Supplementary Figures 7E–G, Supplementary Tables 6–9).
To pinpoint the exact cellular origin of these signals, CellChat analysis was carried out after split of the Mo/Mac/DC macro-cluster. This analysis revealed alveolar macrophages as a dynamic cluster at baseline (both incoming/receptor-based and outgoing/ligand-based interactions), while Trem2+ macrophages produced high volume of incoming/outgoing signals 14 days post injury and Mertk+ cells became active at 42 days. Classical/inflammatory monocytes maintained comparable network profile throughout the 42-day time course, with non-classical monocytes effectively reducing outgoing signals after SP-CI73T injury (Figure 5A; Supplementary Figures 8A–C). Split identity pathway analysis across the 42-day time course demonstrated the origin of the osteopontin1/SPP1, fibronectin1/FN1, chemokine ligand/CCL, laminin, semaphorin3/SEMA3, galectin, complement, and collagen signaling to be driven by Trem2+ macrophages at 14 days (Figure 5B). By 42 days, the predicted interaction strength was comparable across the monocyte and macrophage clusters (Supplementary Figures 8D–F). Connectome ring plots were used to capture the changes and directionality of these interactions during injury and fibrosis. Analysis of CCL signaling predicted baseline crosstalk among all annotated mononuclear myeloid cells and granulocytes. While these responses were unaffected 14 days post SP-CI73T injury, by 42 days there was a global activation of this signaling network (Figure 5C). Differential expression of chemokines/cytokines/interleukins and their receptors highlighted distinct signatures in alveolar macrophages (Ccl6, Il18, Cxcl2, and Il1a), Trem2+ macrophages (Ccl12, Ccl2, Ccl24, Ccl9, Cxcl16, Ccr5, Il10rb, Il11ra1), while Mertk+ macrophages and monocyte-derived DCs were relatively quiescent. Classical and inflammatory monocytes presented a receptor dominant repertoire (Cx3cr1, Il10ra, Il17ra, Il6ra – inflammatory monocytes exclusively expressed Ccr2) (Figures 5D, E). CellChat-based network analysis for complement signaling predicted outgoing communication from classical monocytes to other myeloid clusters in all conditions, with a transient activation originating from stromal cells 14 days post injury (Figure 5F). Differential expression revealed distinct signatures in trem2+ macrophages (C1qa, C1qb, C1qc, C3ar1) and stromal cells (stromal 2 - C1qtnf7, C1ra, C2, C3, C4b, C7), with granulocytes also expressing C3ar1, C5ar1, and C5ar2 (Figure 5G).
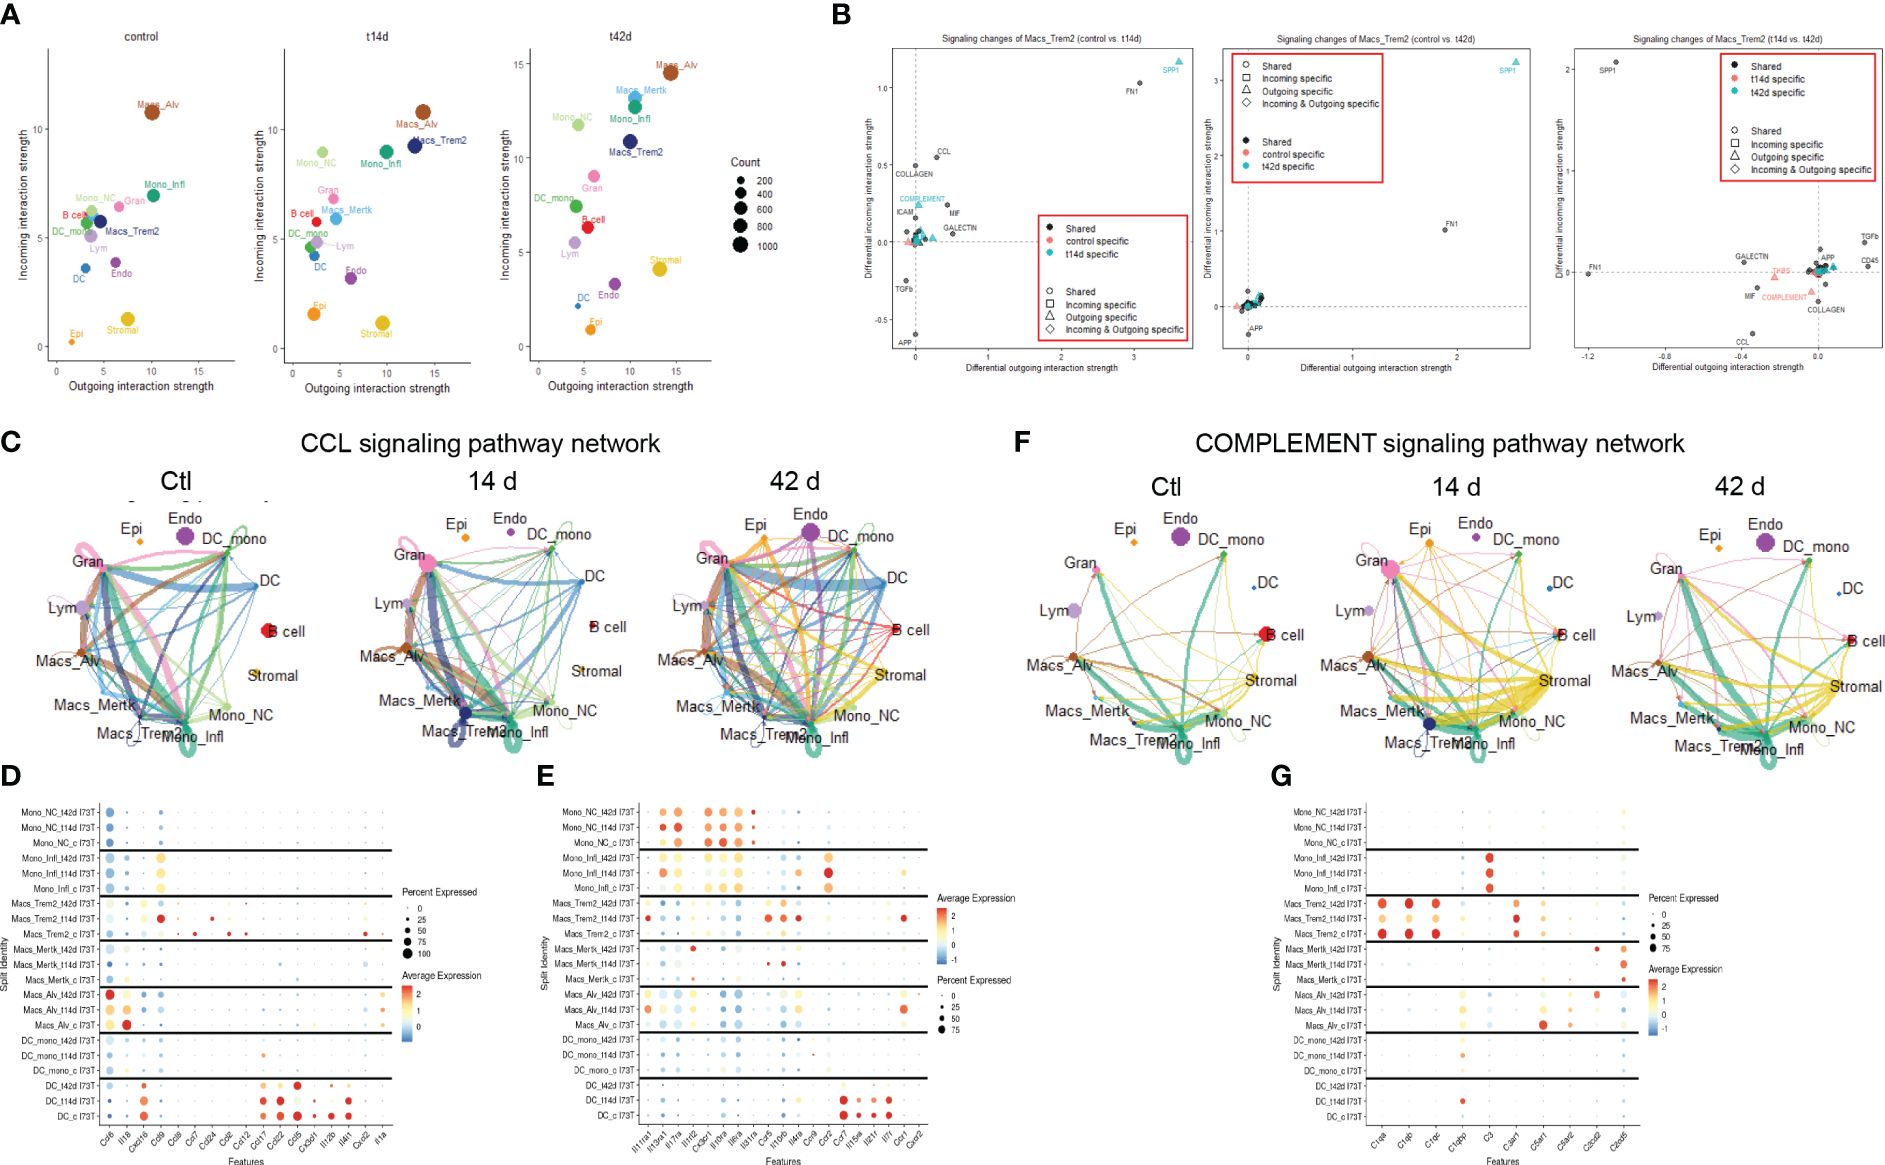
Figure 5 Cell-cell communication analysis in SP-CI73T induced injury and fibrosis. CellChat software was used to estimate cell-cell communication in controls (Ctl, oil treated SP-CI73T mice), 14 days or 42 days post SP-CI73T induction. (A) Ligand:receptor expression analysis examining incoming (y-axis) and outgoing (x-axis) signals in controls, 14 days or 42 days post injury. Note that individual endothelial, mesenchymal, epithelial, granulocyte, B cell, and lymphocyte clusters were combined into “macro-clusters”, while mononuclear myeloid cells remained split. The size of the circles is representative of population size. (B) Prediction of signaling changes in Trem2+ macrophages between control and 14-day, control and 42-day, and 14-d and 42 d. Plot legend describes directionality (circle - shared by both groups, square - incoming in a specific group, triangle - outgoing in a specific group, diamond - incoming and outgoing in a specific group) and signal specificity (black - shared by both groups, orange - control specific, cyan - injury/tamoxifen specific). (C) Connectome ring plots for chemokine ligand/CCL signaling pathway network predict directionality and communication strength among clusters. (D, E) Split identity bubble plot for chemokine/cytokine/interleukin ligands and receptors among mononuclear myeloid clusters. Note that the size of the bubble indicates the relative abundance of the population expressing target gene. Color coating indicates average expression. (F) Connectome ring plots for Complement signaling network predicting directionality and strength of communication among clusters. (G) Split identity bubble plot for complement associated genes among mononuclear myeloid clusters. Note that the size of the bubble indicates the relative abundance of the population expressing target gene. Color coating indicates average expression.
Trem2+ macrophages coordinate pro-fibrotic communication during SP-CI73T induced injury and fibrosisWe then query the dataset for distinctive extracellular matrix reorganization gene signatures. Unsurprisingly, mesenchymal cells produced signals from collagen genes, metalloproteinases, laminins, and platelet-derived growth factor receptor alpha and beta (Supplementary Figure 9). Expression of Timp1, Mmp12, and Mmp14 were restricted to Trem2+ cells, while Spp1, Fn1, and Mmp19 were shared with alveolar macrophages (Figure 6A). Tgfb1 transcripts were maximal in inflammatory monocytes, though UMAP analysis of distribution suggested widespread expression in the lung (Figures 6A, B). Notably, Spp1, and Fn1 expression was also found in the endothelial and mesenchymal compartment (Figures 6C, D). Signaling connectome ring for Tgfb1 highlighted baseline signals emanating primarily from alveolar macrophages, non-classical monocytes, monocyte-derived DCs, and B cells. Despite transient drop 14 days post SP-CI73T induced injury, the network returned to control levels by 42 days, with involvement of Mertk+ macrophages (Figure 6E; Supplementary Tables 6–9). Osteopontin1 signaling network revealed alveolar macrophages as the sole driver in control lungs. SP-CI73T induced injury produced increases in alveolar and Trem2+ macrophages (14 days), and ultimately global expression in all lung cells (42 days) (Figure 6F; Supplementary Tables 6–9). Inflammatory monocytes and alveolar macrophages were shown to engage in fibronectin 1 signaling in the control and injured lung. Notably, Trem2+ macrophages and stromal cells were predicted to partake in FN1 communication 14 days post-injury, while Mertk+ macrophages were shown at 42 days (
留言 (0)