
記住我
Lung cancer, being a prominent contributor to deaths due to cancer on a global scale (1), poses substantial challenges. Non-small cell lung cancer (NSCLC) comprises the majority, approximately 85%, of reported cases among the various histological types of lung cancer. Lung adenocarcinoma (LUAD), which is a specific subtype of non-small cell lung cancer (NSCLC), accounts for approximately 40% of all cases of lung cancer. The majority of LUAD cases arise from the glandular epithelium located in the peripheral regions of the lung (2). Despite significant advancements in contemporary technologies in the field of lung cancer treatment during the previous decade, there are still persistent challenges that hinder progress, as evidenced by the relatively low 5-year survival rate of approximately 10%-20% (2). In recent years, there have been notable developments in the field of medical treatments, specifically in targeted therapies like erlotinib, immunotherapy options such as pembrolizumab or nivolumab, and the utilization of combined surgical procedures (3, 4). However, the current limitations of conventional tumor markers, including their relatively lower specificity and sensitivity, contribute to the persistently low overall 5-year survival rate (OS) observed in late-stage LUAD patients (5, 6). Therefore, it is imperative to conduct comprehensive research on the tumorigenesis and progression mechanisms of LUAD in order to identify novel and more efficient diagnostic and therapeutic biomarkers that can improve the prognosis of patients with LUAD.
Circular RNAs (circRNAs) are a subclass of non-coding RNAs that are produced via back-splicing, an atypical splicing process (7). The 5’ and 3’ ends of linear mRNA are joined in this manner to create a circular structure. Circular RNAs are complex molecules that perform multiple functions, including post-transcriptional regulation and gene transcription regulation. Furthermore, they display a wide range of expression patterns that are specific to different tissues and developmental stages. They are associated with various normal and pathological conditions, particularly implicated in cancer pathogenesis. With the advancements in high-throughput RNA sequencing (RNA-seq) and bioinformatics, numerous functional circular RNAs have been discovered (8). Some functionally characterized circRNAs play critical roles in gene regulation through various mechanisms, such as acting as “sponges” for miRNAs, interacting with proteins, and regulating transcription and splicing. Circular RNAs (circRNAs) have been observed to engage in interactions with various RNA-binding proteins (RBPs), leading to the regulation of associated protein activity and the manifestation of a wide range of biological functions (9, 10).
In recent years, circRNAs have drawn substantial attention due to their prospective applications in cancer diagnosis, prevention, targeted therapy, and their role as dependable diagnostic and prognostic biomarkers. Numerous circRNAs manifest tumor-specific functionalities within cancers, playing a contributory role in modulating cancer progression and metastasis. Research suggests that the aberrant expression of circRNAs is intricately linked to various critical aspects, such as the activation of the PI3K/AKT signaling pathway, facilitation of cell cycle progression, promotion of metastasis, and modulation of anti-tumor immunity across diverse cancers, encompassing lung adenocarcinoma and others (11–14). These circular RNAs also actively contribute to the advancement and immune evasion strategies of various malignant tumors, including colorectal cancer, breast cancer, gastric cancer, hepatocellular carcinoma, among others (15–18). The dysregulated expression of circRNAs plays a pivotal role in the progression of cancer. The distinctive expression patterns of these circRNAs exhibit promising diagnostic potential and could emerge as viable targets for therapeutic interventions. Hence, a comprehensive comprehension of the biological functions and roles of circRNAs in distinct cancer types, along with their influence on signaling pathways, holds immense significance for early cancer detection and precision-based therapies.
Iron-dependent cell death, termed ferroptosis, represents a distinct form of programmed cell death that is iron-reliant and exhibits notable disparities from apoptosis and autophagy (19). It hinges on iron-mediated oxidative injury, heightened accumulation of iron, generation of free radicals, and the supply and buildup of lipid peroxides in fatty acids (20). Various studies have implicated connections between ferroptosis and diverse conditions, encompassing cancer, neurological disorders, and infections (19, 21, 22). Its defining features encompass the accrual of reactive oxygen species (ROS) and the depletion of glutathione. In contrast to apoptosis, necrosis, and autophagy, ferroptosis presents marked distinctions in cellular structure and function. Its mechanism relies on iron-facilitated lipid peroxidation and is intricately governed by numerous cellular metabolic and signaling pathways (23). The principal mechanisms underlying ferroptosis revolve around the catalytic action of ferrous iron or lipoxygenases, leading to the peroxidation of highly abundant unsaturated fatty acids situated on the cellular membrane, ultimately instigating cell demise. Distinctive features characterizing ferroptosis encompass escalated lipid ROS levels, intracellular accumulation of ferrous iron ions, buildup of lipid peroxides, and the decreased expression of factors that inhibit ferroptosis, such as glutathione peroxidase 4 (GPX4) and ferritin heavy chain 1 (FTH1) (23). Downregulation of GPX4 expression stands as a pivotal factor in impeding ferroptosis, functioning by scavenging lipid ROS and thwarting GPX4-mediated cell demise. This factor exhibits a close association with tumor progression (24, 25). FTH1, an integral constituent of ferritin crucial for preserving intracellular iron equilibrium, serves to prevent adverse consequences arising from iron overload (26, 27). Consequently, inhibiting FTH1 might potentially contribute to the induction of ferroptosis.
It’s noteworthy that the regulation of circRNAs is also linked to ferroptosis in the context of cancer progression, potentially opening new avenues for future cancer therapies (28). Although circRNAs play a critical regulatory role in tumor cell metabolism, their specific involvement in the atypical metabolism associated with tumor-induced ferroptosis remains incompletely understood. Advancing research in this domain holds the promise of unveiling the potential contribution of circRNAs to cancer therapy.
For a long time, chemotherapy, radiation therapy, and surgery have been the mainstays of cancer treatment, achieving significant progress. However, these traditional treatment methods exhibit notable limitations in patients with advanced or metastatic malignancies and often come with severe side effects. To confront these challenges, immunotherapy stands out as an immensely promising approach that is gradually gaining traction. It works by reinvigorating immune surveillance and promoting the immune system’s clearance of tumors (29). The tumor microenvironment (TME) is defined as a complex, diverse multicellular environment crucial for tumor development, typically composed of various immune cells, including T and B lymphocytes, tumor-associated macrophages (TAMs), dendritic cells (DCs), natural killer cells (NK cells), neutrophils, and myeloid-derived suppressor cells (MDSCs) (29). Tumor-infiltrating T cells play a crucial role in molding a favorable TME. Nevertheless, regulatory T cells (Tregs) exert immune-suppressive functions by releasing factors like IL-10 and transforming growth factor-beta (TGF-β). These actions assist cancer cells in evading immune defenses (30). Within lung cancer, tumor cells additionally express immune-inhibitory factors such as IL-10 and TGF-β, thereby fostering the recruitment of regulatory T cells (Tregs) and MDSCs (31, 32). The immune microenvironment significantly influences the initiation, infiltration, and metastasis of tumors, exerting a pivotal impact on cancer diagnosis, prevention, and prognosis (33, 34).
With the rapid development of nanomedicine, various functional dendritic macromolecules and dendritic macromolecule-based nanohybrids have been explored in the treatment and diagnosis of cancer. Recently, they have shown great promise in cancer immunotherapy, providing more opportunities for efficient cancer immunotherapy (35). Studies have investigated the intrinsic immune-modulating effects of tumor-targeted nano adjuvants and their ability to simultaneously trigger the release of tumor antigens, thereby reversing immune suppression and achieving potent antitumor immunity, with significant application potential in breast cancer treatment (36). The emergence of these novel approaches in cancer therapeutics, immunotherapy presents a beacon of hope for patients grappling with lung adenocarcinoma, potentially extending their survival rates. Despite these significant advancements, cancer still finds ways to counteract any treatment strategy through dynamic evolution and developing mechanisms of drug resistance. The intricacies inherent in lung adenocarcinoma have led to a constrained scope of research findings, resulting in a dearth of standardized tools capable of effectively guiding clinical decisions in this complex domain. It is essential to further study and develop prognostic biomarkers for lung adenocarcinoma. Therefore, gaining a deeper understanding of the interactions between tumor cells and host immune cells within the tumor microenvironment will help us better comprehend how tumors evade attacks from the immune system, thereby driving the development of precision medicine and individualized combined immunotherapy.
Bioinformatics methodologies have notably contributed to our research endeavors. Through the exploration of immune-related genes, we’ve achieved a more profound comprehension of the intricate relationship and interaction pathways linking LUAD with the immune microenvironment. This holds promise for inspiring early diagnosis, improving prognosis, and developing new therapeutic targets (37). We performed microarray analyses on expression profile datasets pertaining to lung adenocarcinoma and circular RNA expressions. Via meticulous experimental validation, we successfully identified differentially expressed circular RNAs and delineated their potential roles in the pathogenesis of LUAD. In this study, we amalgamated diverse lung adenocarcinoma sample datasets at multiple levels, incorporating clinical data and database analyses. Leveraging several well-established bioinformatics analysis tools, we investigated the correlation between the expressions of circ_BBS9 and IFIT3 and their implications on prognosis. We identified that overexpression of circ_BBS9 inhibits lung adenocarcinoma cell proliferation and promotes ferroptosis of lung adenocarcinoma cells. Additionally, the protein IFIT3, which directly interacts with circ_BBS9, is involved in immune infiltration and participates in the formation of the immune microenvironment. We also established a potential transcriptional network involving “circ_BBS9”-”hsa-miR-7150”-”IFIT3,” which might be involved in the pathogenesis of LUAD. Ultimately, our research uncovered the promising potential of circ_BBS9 as a groundbreaking biomarker for early diagnosis and treatment strategies. Furthermore, our identification of the direct interaction between circ_BBS9 and IFIT3 sheds light on their collective role in shaping the immune microenvironment within LUAD. These discoveries unveil novel molecular mechanisms and offer potential therapeutic targets, presenting extensive opportunities in advancing the diagnosis and treatment of LUAD.
Materials and methodsClinical tissue collectionAll validation samples were collected with the consent of the patients and obtained ethical approval from the Jinshan Branch of the Shanghai Sixth People’s Hospital, China. All patients were diagnosed with LUAD based on their histological and pathological characteristics. Clinical samples included tumor tissues and adjacent non-tumor lung tissues. None of the patients had received any preoperative chemotherapy or radiation therapy. Excised tissues were stored at -80°C for long-term preservation.
Expression analysisThe data were sourced from The Cancer Genome Atlas (TCGA: https://cancergenome.nih.gov) and the Gene Expression Omnibus (GEO: https://www.ncbi.nlm.nih.gov/geo/) datasets (GSE101684, GSE112214, GSE101586, GSE116959, and GSE72094). Protein expression analysis was conducted using the Human Protein Atlas (https://www.proteinatlas.org) to assess the expression of circ_BBS9 and IFIT3 proteins in lung adenocarcinoma patients.
A comprehensive analysis of circ_BBS9 and IFIT3 expression necessitated the utilization of various resources, including Tumor Immune Estimation Resource (TIMER: https://cistrome.shinyapps.io/timer/) (38), Gene Expression Profiling Interactive Analysis (GEPIA: http://gepia.cancer-pku.cn/) (39), and UALCAN (http://ualcan.path.uab.edu/home) (40). The gene expression profile interaction analysis of BBS9 and IFIT3 in lung adenocarcinoma was performed using GEPIA (http://gepia.cancer-pku.cn/).
Analysis of differentially expressed genesDifferent Expressed Genes (DEGs) data from 3 GEO databases (GSE101684, GSE112214, GSE101586) of LUAD was extracted and processed using Python package “pandas”,”scipy” and some other essential packages. Statistical analyses were also calculated with python (| log_2(FC)| > 1, adj.P<0.05). Finally, the results were visualized with the ChiPlot tools.
Survival and prognostic analysisThe survival package and survminer package were employed to assess the correlation between expression levels and the survival rate associated with circ_BBS9 across various clinical features within the GEO dataset (GSE72094). The ROC package was utilized to construct the Receiver Operating Characteristic (ROC) curve for diagnostic purposes.
Enrichment analysesTo uncover potential mechanisms, we conducted Gene Ontology (GO) and Kyoto Encyclopedia of Genes and Genomes (KEGG) analyses with OmicShare tools (https://www.omicshare.com/tools). Genes associated with IFIT3 were collected using STRING (https://cn.string-db.org/) and GeneMania (https://genemania.org/).
Gene set enrichment analysisWe conducted Gene Set Enrichment Analysis (GSEA) employing OmicShare tools (https://www.omicshare.com/tools). Enrichment map analysis was subsequently applied to interpret the GSEA results. Significance was determined by a nominal p-value < 0.05, and a false discovery rate (FDR) q-value<0.25.
RNA extraction and real-time PCRTotal RNA from the cells was extracted using TRIzol™ (ThermoFisher, USA), followed by reverse transcription using the first-strand cDNA synthesis kit (TaKaRa, Japan). Subsequently, real-time polymerase chain reaction (RT-PCR) was conducted.
The primers are as follows:
has_circ_0049271 forward: 5`-AACTTCGCTGAGCAGATTGG-3`,
reverse: 5`-TAAGCAACACCACCACCTCT-3`;
has_circ_0004789 forward: 5`-CCATCAACCGCCTCAAAGAC-3`,
reverse: 5`-TTGCCCAGATCCATCAACCA-3`;
has_circ_0003162 forward: 5`-CTGTCTCAGGAACCTTGGG-3`,
reverse: 5`-CCACCAATCACGGGCTTTAA-3`;
has_circ_0061817 forward: 5`-CCTGTCCTCCTAAACCTCCA-3`,
reverse: 5`-TCTCGCTGACCAAGAACTGA-3`;
has_circ_0015278 forward: 5`-TACAACCCCAGAACCAACCA-3`,
reverse: 5`-AGAACACTGACCCCAACTCC-3`.
GAPDH was used as an internal control.
Cell cultureLung normal epithelial cells (BEAS-2B) and lung cancer cell lines (A549, H1299) were obtained from ATCC (Manassas, USA). These cell lines were cultured in RPMI-1640 medium (Gibco, USA) supplemented with 10% fetal bovine serum (FBS, Biological Industries, Israel) and 1% penicillin-streptomycin solution (Solarbio, China). The cells were maintained in a humidified incubator at 37°C with 5% CO2.
Cell transfectionH1299In this experiment, we used Lipofectamine™ 2000 transfection reagent to transfect hsa-circ-0003162-1 and NC into H1299 cells, as shown in Table 1. One day prior to transfection, cells were seeded into a 6-well plate at a density of 5 x 10^5 cells per well. After 24 hours, the cell confluency was observed to reach 80% to 90%, at which point hsa-circ-0003162-1 was transfected.
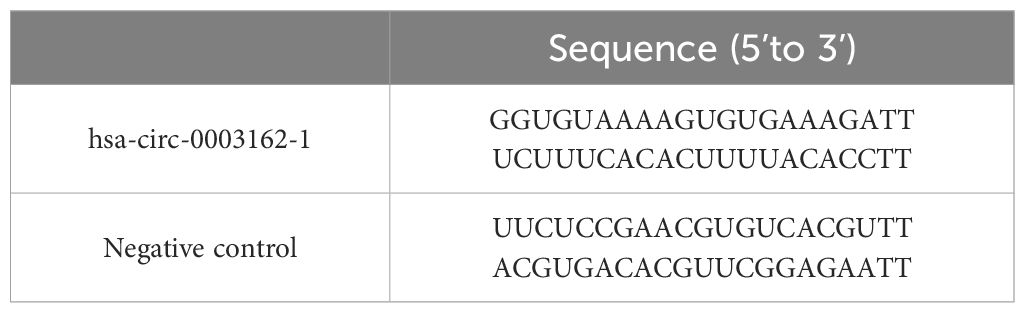
Table 1 The sequences of hsa-circ-0003162 and negative control.
Medium Replacement: The original medium in each well was discarded and replaced with fresh medium. Transfection reagent and RNA were diluted with OPTI-MEM and incubated at room temperature for 5 minutes. The amount of transfection reagent and OPTI-MEM added per well is shown in Table 2. The 50 μL diluted interference fragments and 50 μL diluted transfection reagent were mixed well and incubated at room temperature for 15 minutes. The 100 μL incubated mixture was then added to the cell samples. After 6 hours, the medium was replaced with fresh medium.
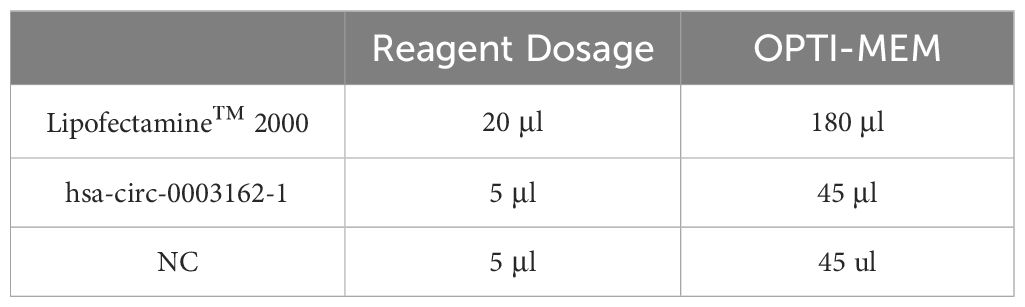
Table 2 Transfection reagent and OPTI-MEM added per well in H1299 cells.
A549Using Lipofectamine™ 2000 transfection reagent, the circ-0003162 overexpression plasmid and empty vector were transfected into A549 cells. One day prior to transfection, cells were seeded into a 6-well plate at a density of 3 x 10^5 cells per well. After 24 hours, the cell confluency was observed to reach 80% to 90%, at which point the circ-0003162 plasmid was transfected.
Medium Replacement: The original medium in each well was discarded and replaced with fresh medium. The transfection reagent and plasmid were diluted with OPTI-MEM and incubated at room temperature for 5 minutes. The amount of transfection reagent and OPTI-MEM added per well is shown in Table 3. The 50 μL diluted plasmid and 50 μL diluted transfection reagent were mixed well and incubated at room temperature for 20 minutes. The 100 μL incubated mixture was then added to the cell samples. After 6 hours, the medium was replaced with fresh medium.
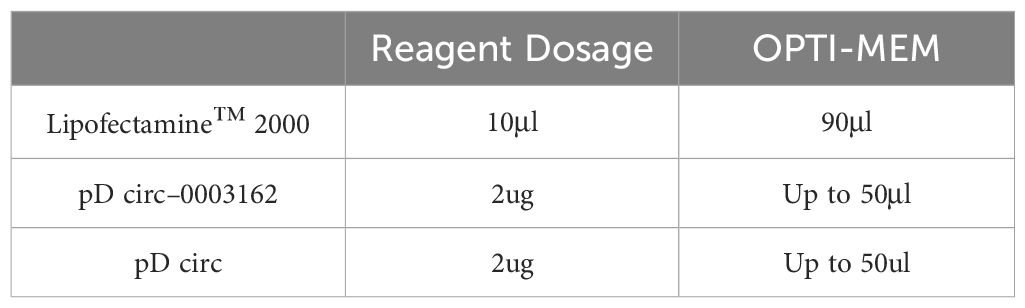
Table 3 Transfection reagent and OPTI-MEM added per well in A549 cells.
Cell counting kit 8 assayTo assess cell viability, a Cell Counting Kit-8 (CCK-8) assay kit was employed following the manufacturer’s instructions. Briefly, cells were seeded in 96-well plates at a density of 1000 cells per well, in culture medium containing 10% fetal bovine serum and penicillin-streptomycin (5000 U/mL), and were maintained at 37°C in a humidified atmosphere with 5% CO2. After 24 hours of incubation, 10 μL of CCK-8 reagent was added to each well of the 96-well plates and incubated for 2 hours at 37°C in a humidified atmosphere with 5% CO2. The absorbance of each well was measured at 450 nm using a microplate reader.
Immunofluorescence assaysCells were seeded onto 24-well plates. After fixation (4% paraformaldehyde, 15 minutes at room temperature) and blocking (3% BSA, 30 minutes at room temperature), the primary antibody (1:250, Abcam, derived from rabbit) was incubated at 4°C overnight. Subsequently, the corresponding fluorescent secondary antibody (1:500, Abcam, derived from goat) was incubated for 1 hour at room temperature. Anti-fade 4`,6-diamidino-2-phenylindole (DAPI) was employed for cell nuclei labeling. Images were captured using a fluorescence microscope.
Measurement of ROSDihydroethidium (Beyotime, #S0063) was employed as a molecular probe for detecting ROS in red fluorescence. FerroOrange (DOJINDO, #F374) was quantified using a flow cytometer or visualized under a fluorescence microscope.
Measurement of MDA levelsTo measure MDA levels, a lipid peroxidation assay kit was employed according to the manufacturer’s instructions. Briefly, 1 × 10^6 cells were collected in 300 μL of MDA lysis buffer containing 3 μL of butylated hydroxytoluene (BHT, 100×, to reduce interfering lipid oxidation), and the samples were homogenized on ice. After centrifugation at 13,000 g for 10 minutes, the insoluble material was removed. Subsequently, 600 μ L of thiobarbituric acid (TBA) solution, which reacts with other compounds in the samples to produce colored products, was added to each experimental sample or vial containing a standard sample. The MDA-TBA adducts were allowed to form by incubating for 60 minutes at 95°C. After cooling to 25°C in an ice bath, 200 μ L of each reaction mixture was pipetted into a 96-well plate for colorimetric assays, and the absorbance was measured at 532 nm.
Fe2+ content measurementFollowing cell treatment based on the grouping, the cells were washed twice with FBS-free DMEM. Subsequently, a working solution of Ferro Orange (1 μmol/L; excitation wavelength: 540 nm, emission wavelength: 580 nm; Dojindo, Kumamoto, Japan) was prepared using FBS-free DMEM as per the manufacturer’s instructions. The solution was then incubated at 37°C in a 5% CO2 incubator for 30 minutes and finally photographed using a multifunctional microplate detection system (CYTATION5, BIOTEK, USA).
Protein extraction and western blotCells were collected, washed with ice-cold phosphate-buffered saline (PBS), and lysed for 30 minutes in RIPA buffer containing 50mM Tris/HCl (pH 7.5), 150mM NaCl, 1% NP40, 1% Triton X-100, 2.5mM sodium pyrophosphate, 1mM β-glycerophosphate, 1mM EDTA, 1mM Na3VO4, and 1μg/mL leupeptin. Cell lysates were then centrifuged at 14,000g for 10 minutes at 4°C, and the protein concentration was measured using the BCA Protein Assay kit (Pierce, Rockford, IL). Aliquots of lysates (twenty micrograms of protein) were boiled with sample loading buffer (Beyotime; P0015) for 5 minutes and resolved by sodium dodecyl sulfate-polyacrylamide gel electrophoresis (SDS-PAGE). After electrophoresis, proteins were electrophoretically transferred onto a polyvinylidene difluoride (PVDF; Roche) membrane using a Semi-Dry Electroblotter (Bio-Rad). Following transfer, the membrane was blocked for 2 hours at room temperature in phosphate-buffered saline (PBS) containing 5% (w/v) nonfat milk and 0.1% (v/v) Tween-20. The membranes were then incubated with primary antibodies against human GPX4 (1:5000, Abcam, USA), GAPDH (1:500, Proteintech, China), FTH1 (1:1000, Abcam, USA)and IFIT3 (1:2000, CST, USA)at 4°C overnight, followed by a 1-hour incubation at room temperature with horseradish peroxidase (HRP)-linked anti-rabbit secondary antibody (Proteintech, SA00001–2; 1:50000) or anti-mouse secondary antibody (Proteintech, SA00001–1; 1:100000). After four washes with PBS containing 0.1% (v/v) Tween-20, immunoreactive bands were visualized using Chemistar™ High-sig ECL Western Blotting Substrate (Tanon; 180–501).
Pull-down assayA biotin-labeled oligonucleotide probe specific to circ_BBS9 was synthesized commercially (RiboBio, China). In brief, the biotin-labeled oligonucleotide probes were incubated with BeyoMag™ streptavidin magnetic beads (Beyotime; P2151) for 60 minutes at room temperature. Once bound to the streptavidin magnetic beads, the probe-beads were incubated with whole cell lysates overnight at 4°C. Following three washes with ice-cold PBS, miRNAs or proteins that were pulled down by the probe-coated beads were collected.
RNA immunoprecipitation assayTo perform the RNA immunoprecipitation (RIP) assay, cells were harvested and resuspended in 1 mL of lysis buffer containing a protease inhibitor cocktail and RNase inhibitor. After centrifugation at 13,000 rpm for 10 minutes at 4°C, the supernatant was incubated with 30-40 μL of Protein A-Sepharose beads (Genescript) and 2 μg of primary antibodies (Proteintech, derived from rabbit) for 4 hours at 4°C. Subsequently, the beads were washed with ice-cold 1×PBS. Following this, the beads were incubated with Proteinase K (Sigma) using Trizol reagent (Invitrogen Life Technologies), and the purified RNA was subjected to qRT-PCR analysis.
TF-miRNA-mRNA regulatory networkTranscription factors (TFs) targeting IFIT3 were predicted based on CHEA (https://maayanlab.cloud/Harmonizome/) and GRNdb (http://www.grndb.com/). miRNAs targeting IFIT3 were predicted based on three different databases: miRWalk (http://mirwalk.umm.uni-heidelberg.de/), TargetScan (https://www.targetscan.org/vert_80/), and mirDIP (http://ophid.utoronto.ca/mirDIP/). StarBase V2.0 (https://starbase.sysu.edu.cn/index.php) was used to predict miRNA expression levels, prognostic value, and interaction sites. The final results were visualized by initially employing the venn3 function in in matplotlib_venn in python for creating a Venn diagram. Subsequently, based on the diagram results, graphical adjustments were made using the ‘pyplot’ module from Matplotlib to generate a comprehensive visualization.”
Immune infiltration analysisThe relationship between immune infiltration and IFIT3 was assessed using TIMER 2.0 (38) and TISIDB (41). In brief, TIMER 2.0 was employed to elucidate the association between GPER and tumor-infiltrating immune cells (TIICs). TISIDB elucidated the relationship between tumor-infiltrating lymphocyte (TIL) abundance and IFIT3 expression.
Statistical analysis of dataIn this study, different statistical tests were employed for data analysis, depending on the data characteristics and comparison requirements:
(1). For the comparison of expression levels between two groups, an unpaired t-test was employed.
(2). When dealing with more than two groups, an initial Analysis of Variance (ANOVA) test was conducted to assess whether significant differences existed among all groups. Subsequently, based on the inter-group variations obtained through Tukey’s multiple comparisons test, a secondary unpaired t-test was performed to ascertain significant differences between two groups, yielding the final statistical conclusions depicted in the figures.
(3). For survival curve statistical analysis, the Log-Rank (Mantel-Cox) method was used to compare two curves and evaluate statistical differences.
In this paper, significance levels (*, **, ***) are used to indicate p-values of less than 0.05, 0.01, and 0.001, respectively. Smaller p-values signify greater statistical significance in the differences between the compared data.
ResultsCharacteristics of differentially expressed CircRNAs in LUADTo investigate the role of circRNAs in the progression of lung adenocarcinoma, we conducted a merged analysis using lung adenocarcinoma expression microarray datasets from the GEO database (GSE101684, GSE11221, GSE101586) (Figure 1A). We employed a heatmap (Figure 1B) and a volcano plot (Figure 1C) to screen for differentially expressed circRNAs. In this process, a total of 31 differentially expressed circRNAs were identified, with the noteworthy observation that these circRNAs primarily exhibited a downregulation trend. Subsequently, we excluded two upregulated circRNAs and focused on the remaining 29 differentially expressed downregulated circRNAs for further investigation.
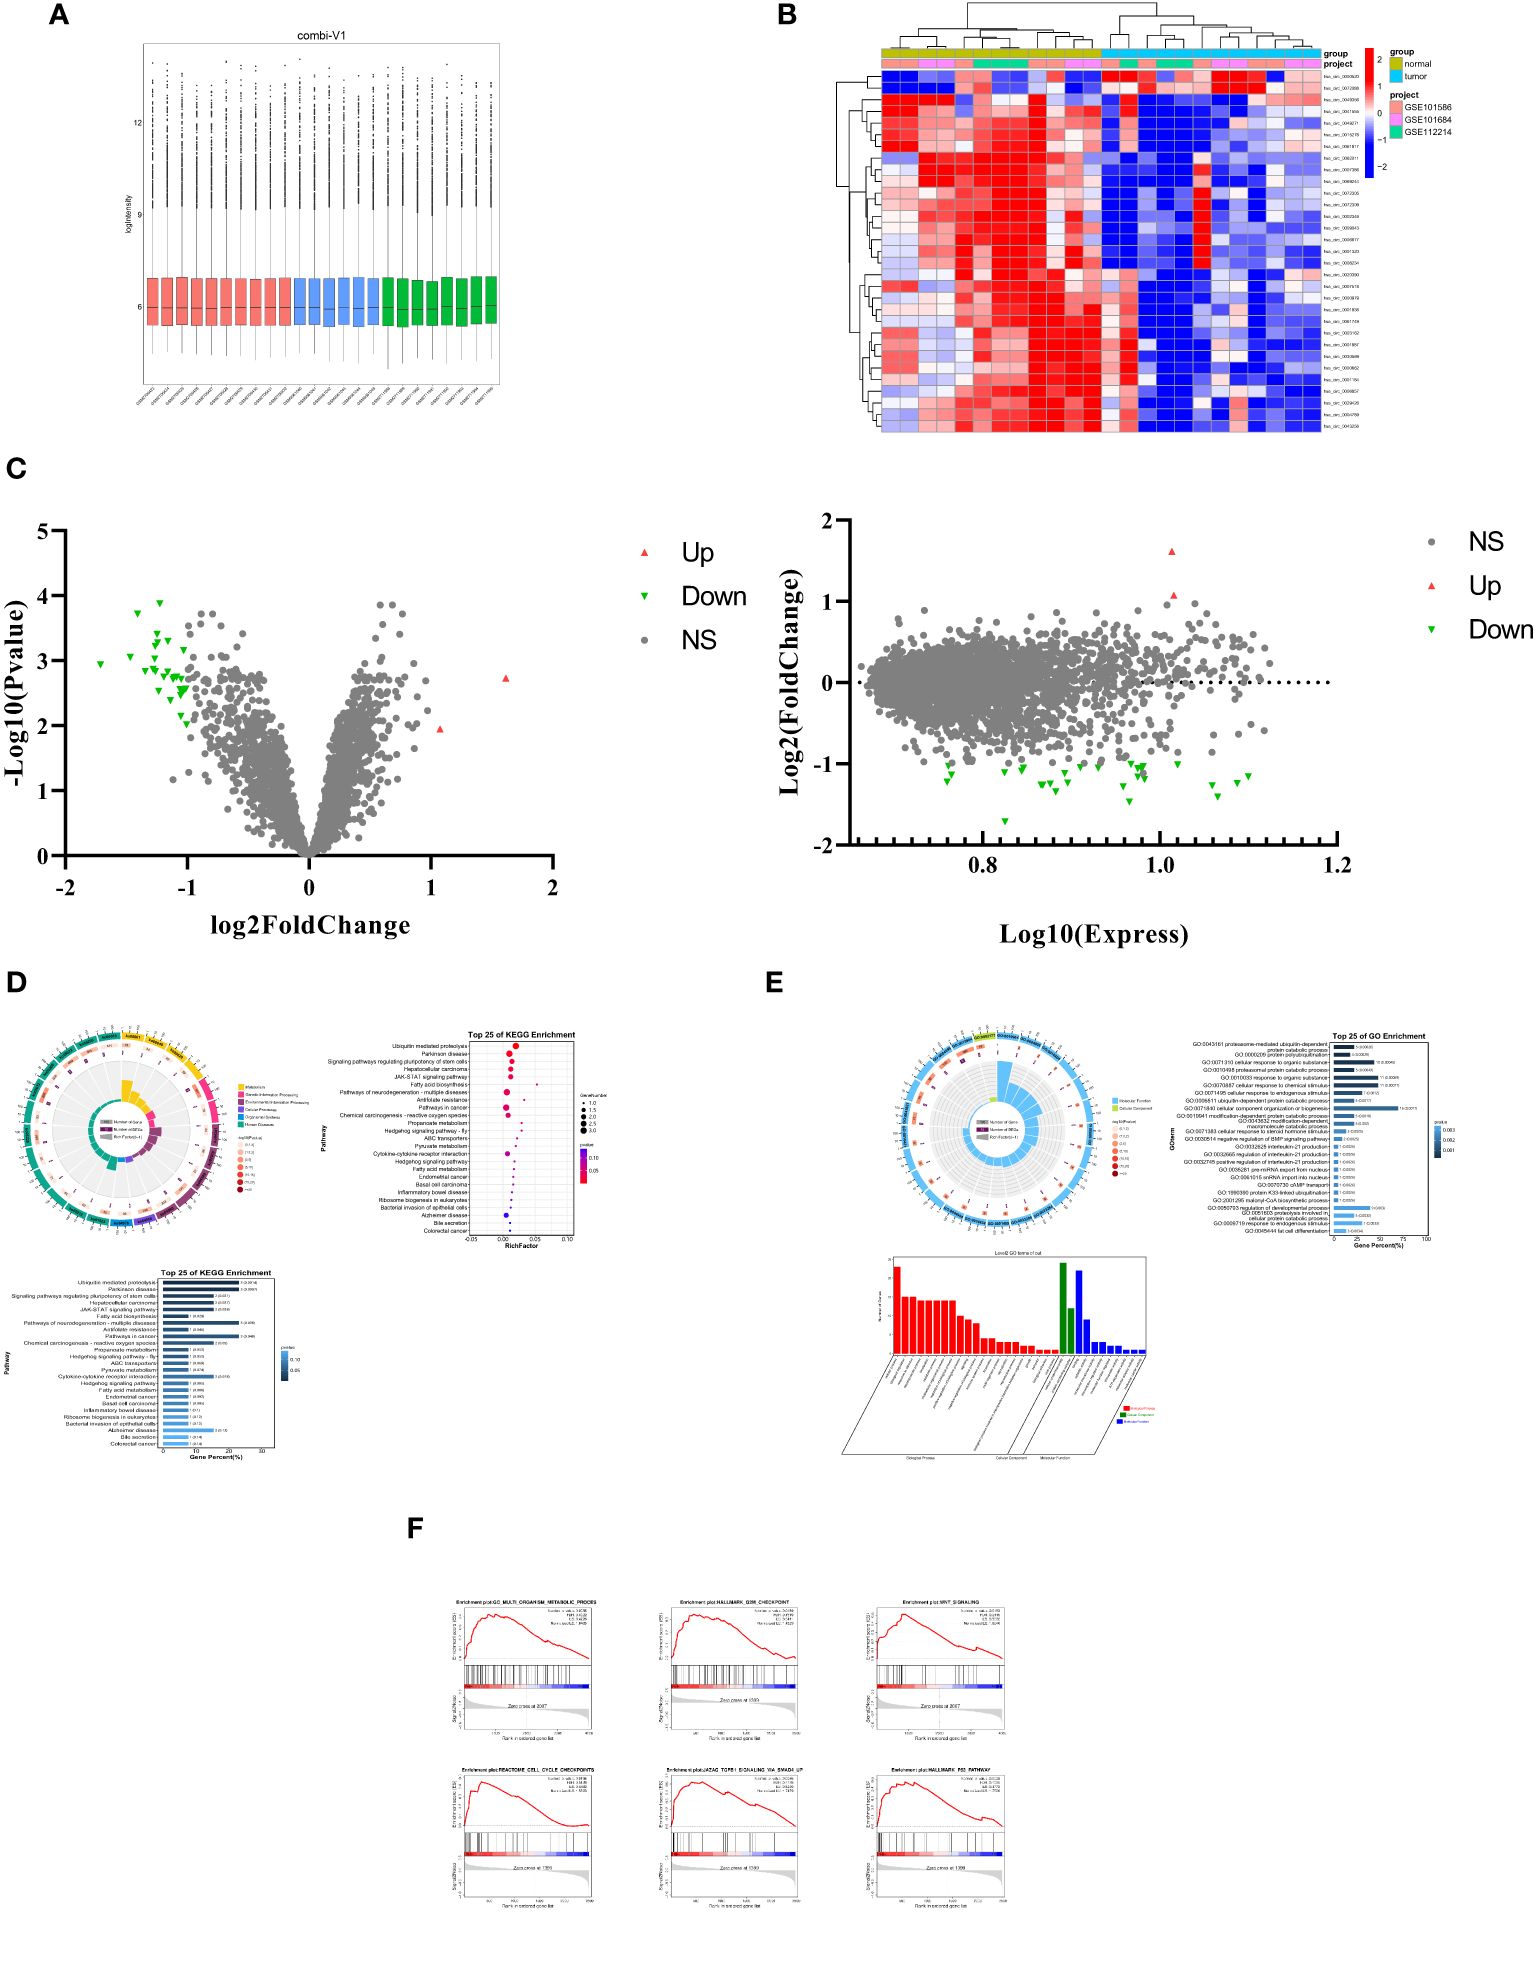
Figure 1 Characteristics of differentially expressed CircRNAs in LUAD. (A) The lung cancer expression microarray dataset from the GEO Database. (B) A cluster heap map presented the significantly dys regulated circRNAs in human LUAD tissues relative to adjacent normal tissues. The red and blue strips represent high and low expression, respectively. (C) Scatter plot and Volcano plot of differentially expressed circRNAs in LUAD and adjacent normal tissues. (D) Differential expression of circRNAs in KEGG pathway analysis results. (E) Differential expression of circRNAs in GO analysis results Results. (F) GSEA (Gene Set Enrichment Analysis) of differentially expressed circRNAs.
Through the study of these differentially expressed circRNAs, we conducted Kyoto Encyclopedia of Genes and Genomes (KEGG) analysis (Figure 1D). The results revealed that the downregulated circRNAs play important roles in ubiquitin-mediated proteolysis, cytokine-cytokine receptor interaction, metabolism, and the regulation of various signaling pathways. Furthermore, Gene Ontology (GO) term analysis (Figure 1E) also disclosed that these circRNAs are associated with biological processes (BP) related to cell metabolism, bioregulation, and stimulus response, cellular components (CC) involving cellular anatomical entities and protein-containing complexes, and molecular functions encompassing binding and catalytic activity.
Further research included Gene Set Enrichment Analysis (GSEA). This analysis (Figure 1F) demonstrated significant enrichment of these circRNAs in cellular metabolism, cell cycle, proliferation, invasion, antigen response, inflammation, and various signaling pathways. These findings underscore the crucial role of these downregulated circRNAs in the progression of lung adenocarcinoma, potentially affecting cell functions and disease mechanisms through multiple pathways.
Expression and survival of circ_BBS9 in LUAD tissuesFor an in-depth investigation, we selected five circRNAs (has_circ_0049271, has_circ_0004789, has_circ_0003162, has_circ_0061817, has_circ_0015278) with the greatest downregulation and that had not been previously reported in the field of lung adenocarcinoma for further study. We employed qRT-PCR to assess the expression levels of these five downregulated circRNAs in two human lung adenocarcinoma cell lines (A549 and H1299) and one human normal lung epithelial cell line (BEAS-2B) (Figure 2A). The results indicated that three circRNAs (has_circ_0004789, has_circ_0061817, has_circ_0003162) exhibited low expression in lung adenocarcinoma cell lines.
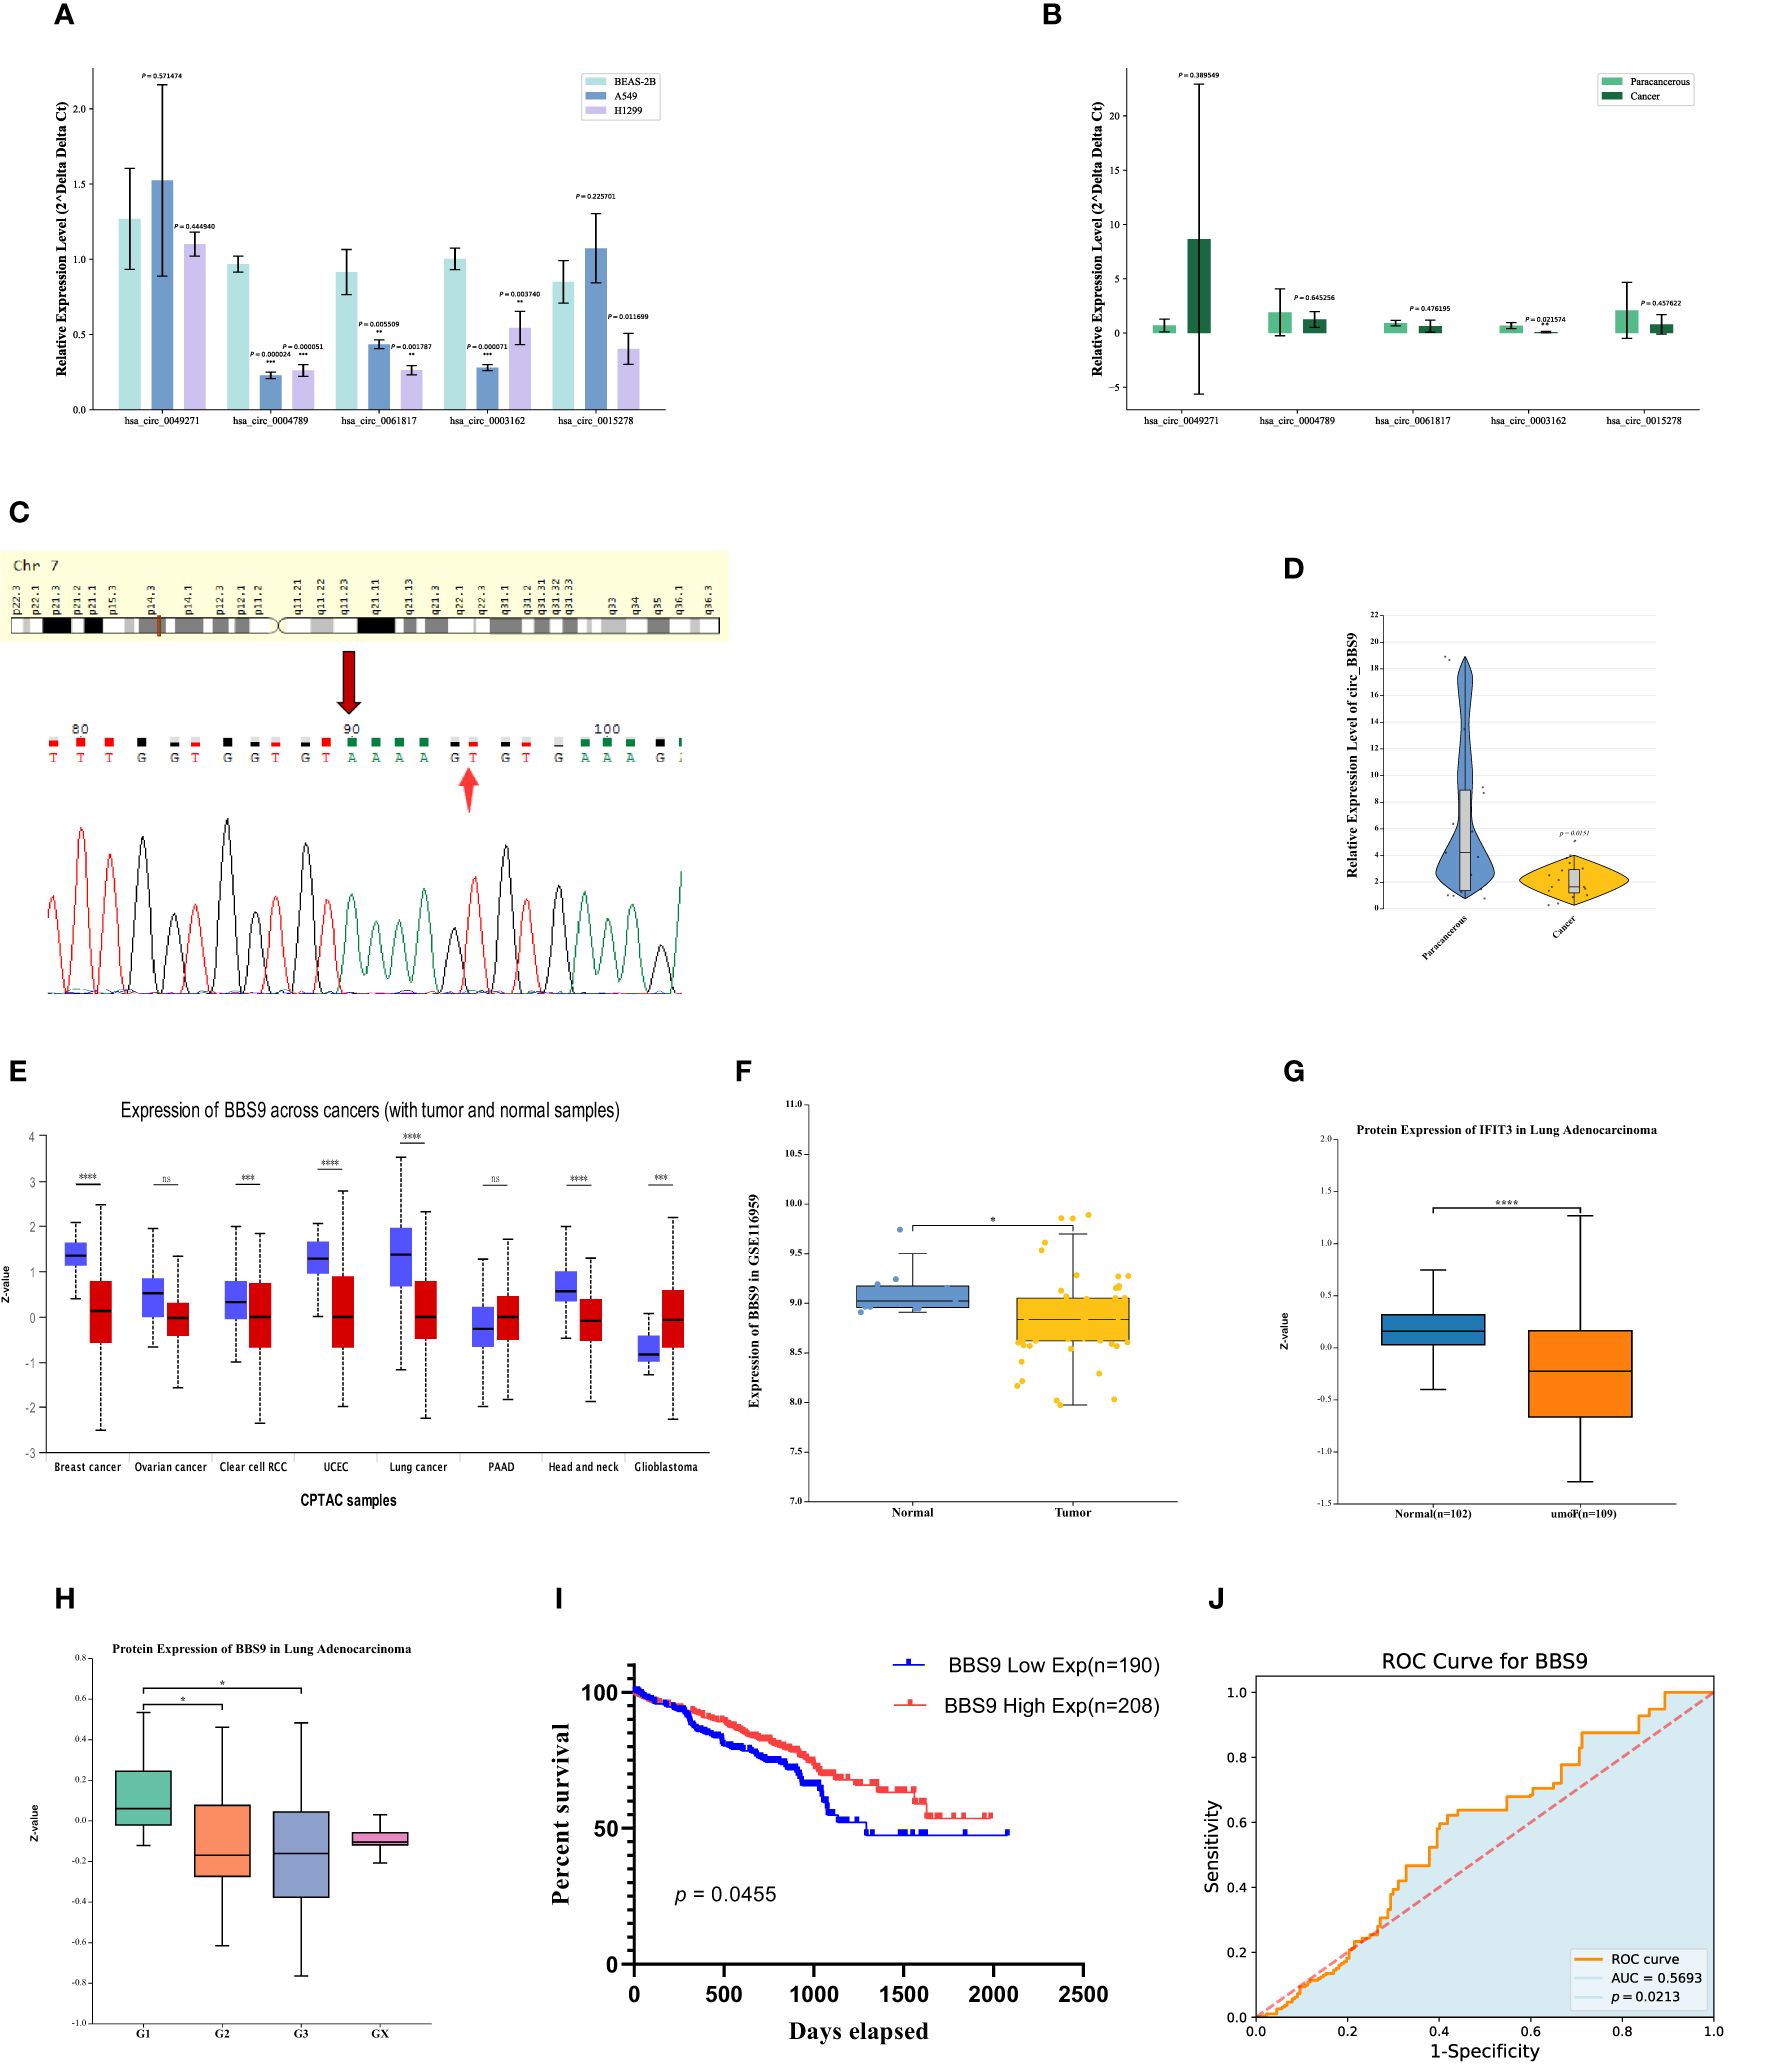
Figure 2 Expression and survival of Circ BBS9 in LUAD Tissues. (A) Expression of differentially downregulated circRNAs in A549, H1299, and (BEAS-2B) determined by qRT-PCR assays. (B) Expression of differentially downregulated circRNAs in clinical samples determined by qRT-PCR assays. (C) sequencing of PCR products revealing the circularization site of circRNA as indicated (Arrows) in the figure above. (D) Expression of circ BBS9 in 15 clinical samples as obtained by qRT PCR assays. (E) BBS9 expression in different cancer types analyzed by UALCAN. (F) In the GEO database, BBS9 exhibits lower mRNA expression levels in LUAD compared to normal tissues (p <0.05). (G) In the HAP database, the protein expression level of BBS9 is lower in LUAD compared to normal tissues (p < 0.001). (H) The expression of BBS9 in LUAD is correlated with Tumor Grade (p < 0.05). (I) Survival curves of overall survival in GSE72094 LUAD patients. (J) The predictive ability of variable BBS9 in LUAD.
To further validate these results, we collected clinical samples from 15 patients diagnosed with lung adenocarcinoma, comprising both cancer tissues and adjacent normal tissues. We used qRT-PCR to measure the mRNA levels of these three circRNAs (has_circ_0004789, has_circ_0061817, has_circ_0003162) in the cancer tissues and adjacent normal tissues of three patients (Figure 2B). The results indicated that has_circ_0003162 had significantly lower expression in cancer tissues compared to adjacent normal tissues. Therefore, we selected has_circ_0003162 as the subject for further investigation. These series of experimental findings underscore the potential importance of has_circ_0003162 in lung adenocarcinoma and provide a foundation for further mechanistic research.
Has_circ_0003162, derived from the BBS9 gene on chromosome 7, was unambiguously identified as our screened circ_BBS9 through divergent primer amplification and Sanger sequencing (Figure 2C). To validate our findings, we verified the expression of circ_BBS9 in cancer tissues and adjacent tissues of 12 additional lung adenocarcinoma patients (Figure 2D). The results showed a significant reduction in the expression level of circ_BBS9 in lung adenocarcinoma tissues.
To further explore the relationship between circ_BBS9 and LUAD, we used UALCAN to analyze the expression of BBS9 in various tumors (Figure 2E). We compared the expression levels of BBS9 in tumor tissues and adjacent normal tissues, revealing differential expression of circ_BBS9 in various tumor tissues. Using data from the GEO database (GSE116959), we assessed the mRNA expression of BBS9 in LUAD tissues and non-tumor tissues (Figure 2F) and validated the protein-level expression of BBS9 in LUAD through the Human Protein Atlas (HPA) (Figure 2G). We found a consistent trend of downregulated BBS9 expression in LUAD, regardless of the different databases or methods used for analysis. Furthermore, in different tumor grades, the expression of BBS9 was significantly lower in G2 and G3 compared to G1 (Figure 2H), suggesting a correlation between BBS9 and tumor grading.
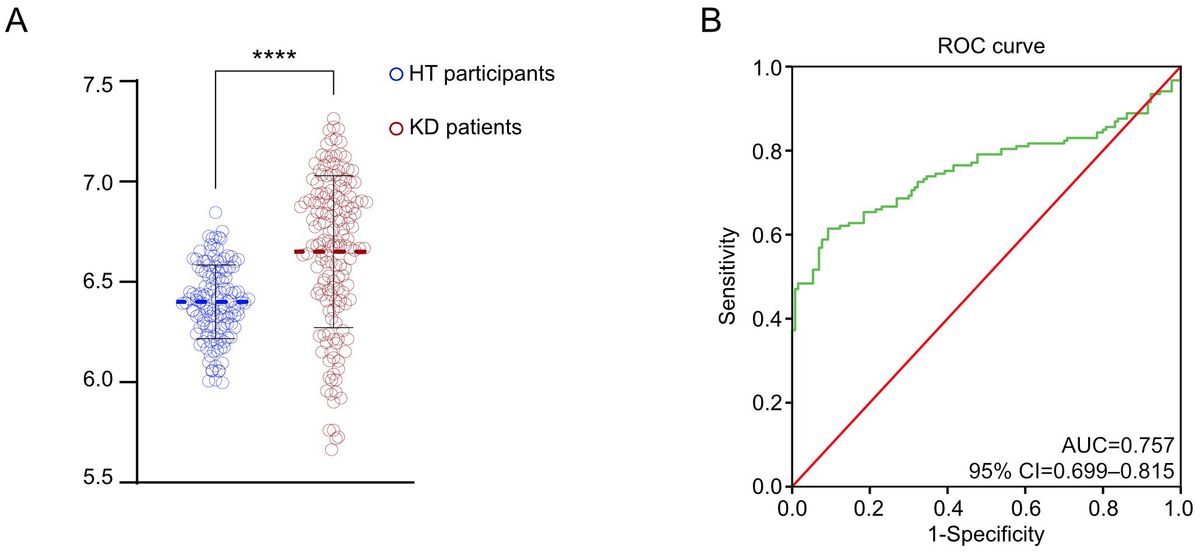
Subsequently, we analyzed the prognosis of 398 lung adenocarcinoma patients from the GEO database who expressed the BBS9 gene (Figure 2I). The results indicated that patients with high circ_BBS9 expression had a better survival prognosis. Through receiver operating characteristic (ROC) curve analysis (Figure 2J), we confirmed the diagnostic value of circ_BBS9 in LUAD, with an area under the curve (AUC) of 0.5693, suggesting a strong correlation between circ_BBS9 and the diagnosis of LUAD. In summary, circ_BBS9 may serve as a potential biomarker with significant clinical implications for the diagnosis and prognosis of LUAD.
Impact of circ_BBS9 on the proliferation of A549 and H1299 LUAD cellsIn order to assess the functional significance of circ_BBS9, we conducted in vitro experiments using A549 and H1299 LUAD cells. Employing siRNA interference techniques, we successfully reduced the expression levels of circ_BBS9 in H1299 cells (Figure 3A). Cellular viability was examined through CCK-8 assays (Figure 3B), revealing a significant increase in cell proliferation in the si_circ_BBS9 group. Furthermore, immunofluorescence analysis of H1299 cells was performed to detect Ki67-positive cell nuclei (displayed as green fluorescence) (Figure 3C), and the results indicated a noteworthy elevation in the percentage of Ki67-positive cell nuclei in the si_circ_BBS9 group. This suggests that circ_BBS9 promotes the proliferation of LUAD cells.
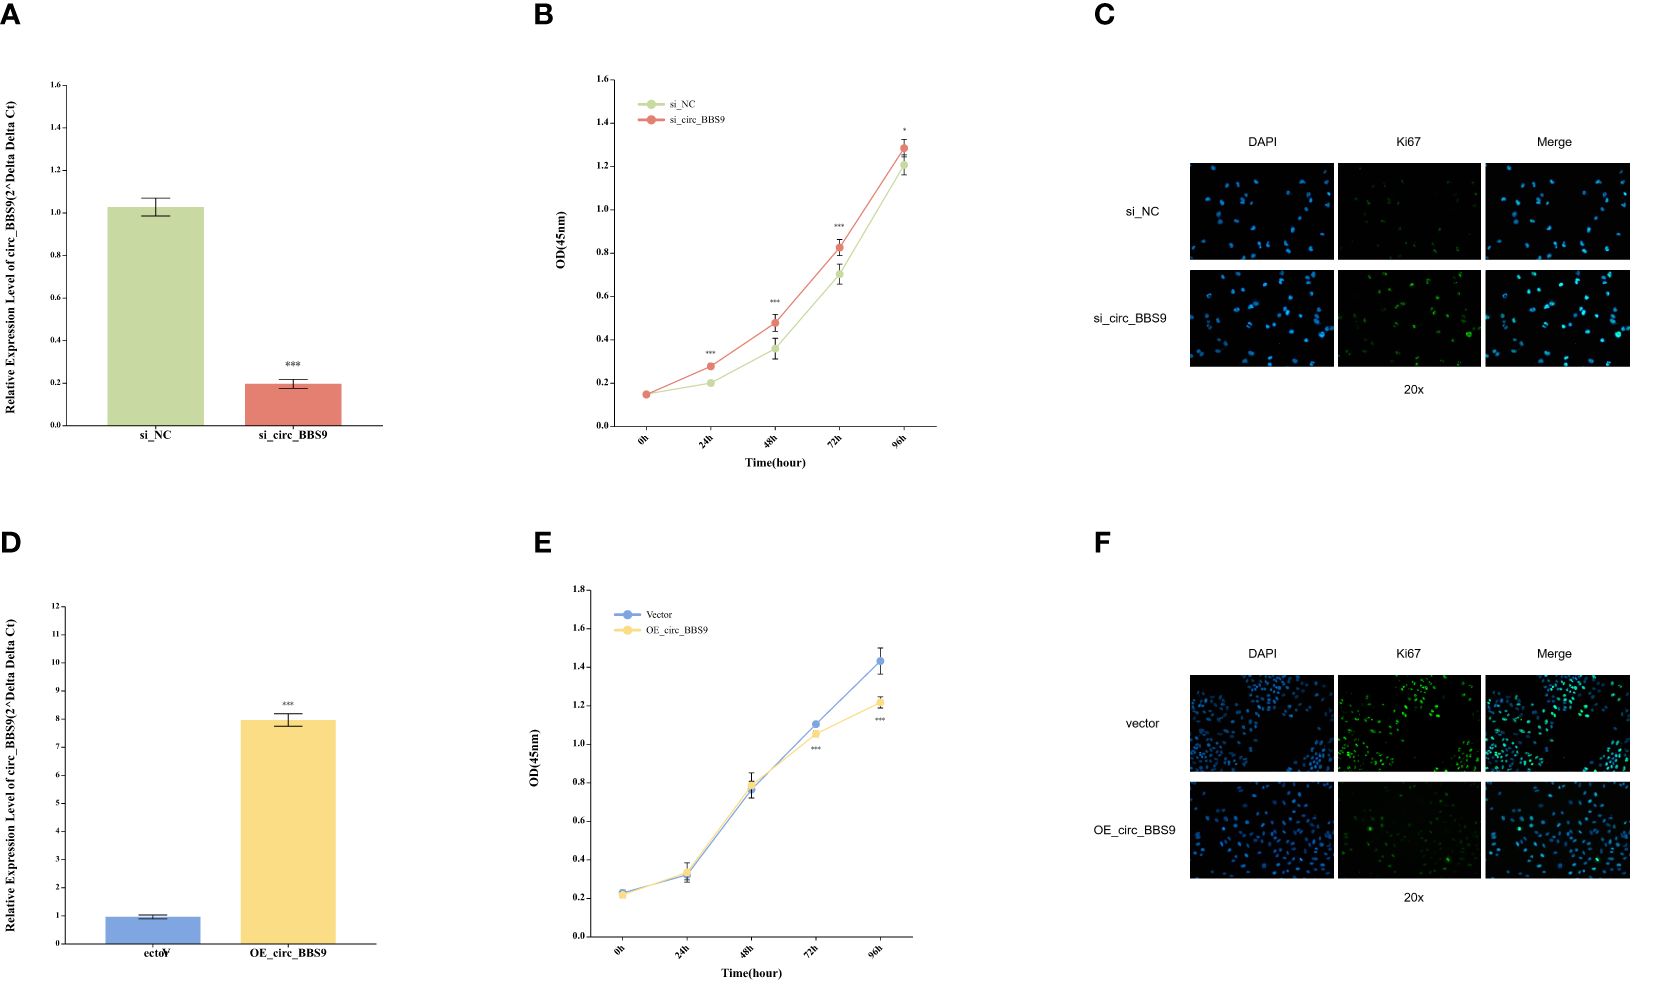
Figure 3 Impact of Circ_BBS9 on the Proliferation of A549 and H1299 LUAD Cells. (A) Comparison of circ_BBS9 expression levels between the negative control (NC) group and the si_circ_BBS9 group in H1299 cells using qRT-PCR. (B) Comparison of cell viability between the negative control (NC) group and si_circ_BBS9 group in H1299 cells using a CCK-8 assay. (C) Immunofluorescence detection of Ki67 cell proliferation in the negative control (NC) group and si_circ_BBS9 group in H1299 cells. (D) Comparison of circ_BBS9 expression levels between the Vector group and OE_circ _BBS9 group in A549 cells using qRT-PCR. (E) Comparison of cell viability between the Vector group and OE_circ_BBS9 group in A549 cells using CCK-8 assay. (F) Assessment of Ki67 cell proliferation in A549 cells for the Vector group and OE_circ_BBS9 group using immunofluorescence.
Simultaneously, we employed the overexpression technique (OE-RNA) to overexpress circ_BBS9 in A549 cells, successfully elevating the expression levels of circ_BBS9 (Figure 3D). In the CCK-8 assay, the OE_circ_BBS9 group exhibited a noticeable decrease in cell proliferation (Figure 3E). Immunofluorescence analysis revealed a significant reduction in the percentage of Ki67-positive cell nuclei in the OE_circ_BBS9 group compared to the control group (Figure 3F). These findings indicate that OE_circ_BBS9 inhibits the proliferation of LUAD cells.
These results underscore the crucial regulatory role of circ_BBS9 in LUAD cells. Its downregulation enhances cell proliferation, while its overexpression suppresses cell proliferation, emphasizing the potential involvement of circ_BBS9 in the pathophysiological processes of LUAD.
The effect of circ_BBS9 on ferroptosis in A549 and H1299 LUAD cellsTo further assess the impact of circ_BBS9 on LUAD progression, a series of experiments were conducted. Initially, we investigated whether known cell death inhibitors would affect the mode of cell death in OE_circ_BBS9 LUAD cells. Various cell death inhibitors, including the Ferroptosis inhibitor ferrostatin-1, apoptosis inhibitor Z-VAD-fmk, necroptosis inhibitor necrostatin-1 (Nec-1), and autophagy inhibitor 3-MA, were employed to determine the mode of cell death in OE_circ_BBS9 LUAD cells through CCK-8 assays (Figure 4A). We transfected the circ_BBS9 overexpression plasmid into A549 cells and observed that DMSO, VAD, Nec, and 3-MA significantly inhibited cell proliferation. However, the Ferrostatin-1 group did not impact the proliferation of LUAD cells. Thus, we ruled out other known modes of cell death and proceeded with investigating ferroptosis.
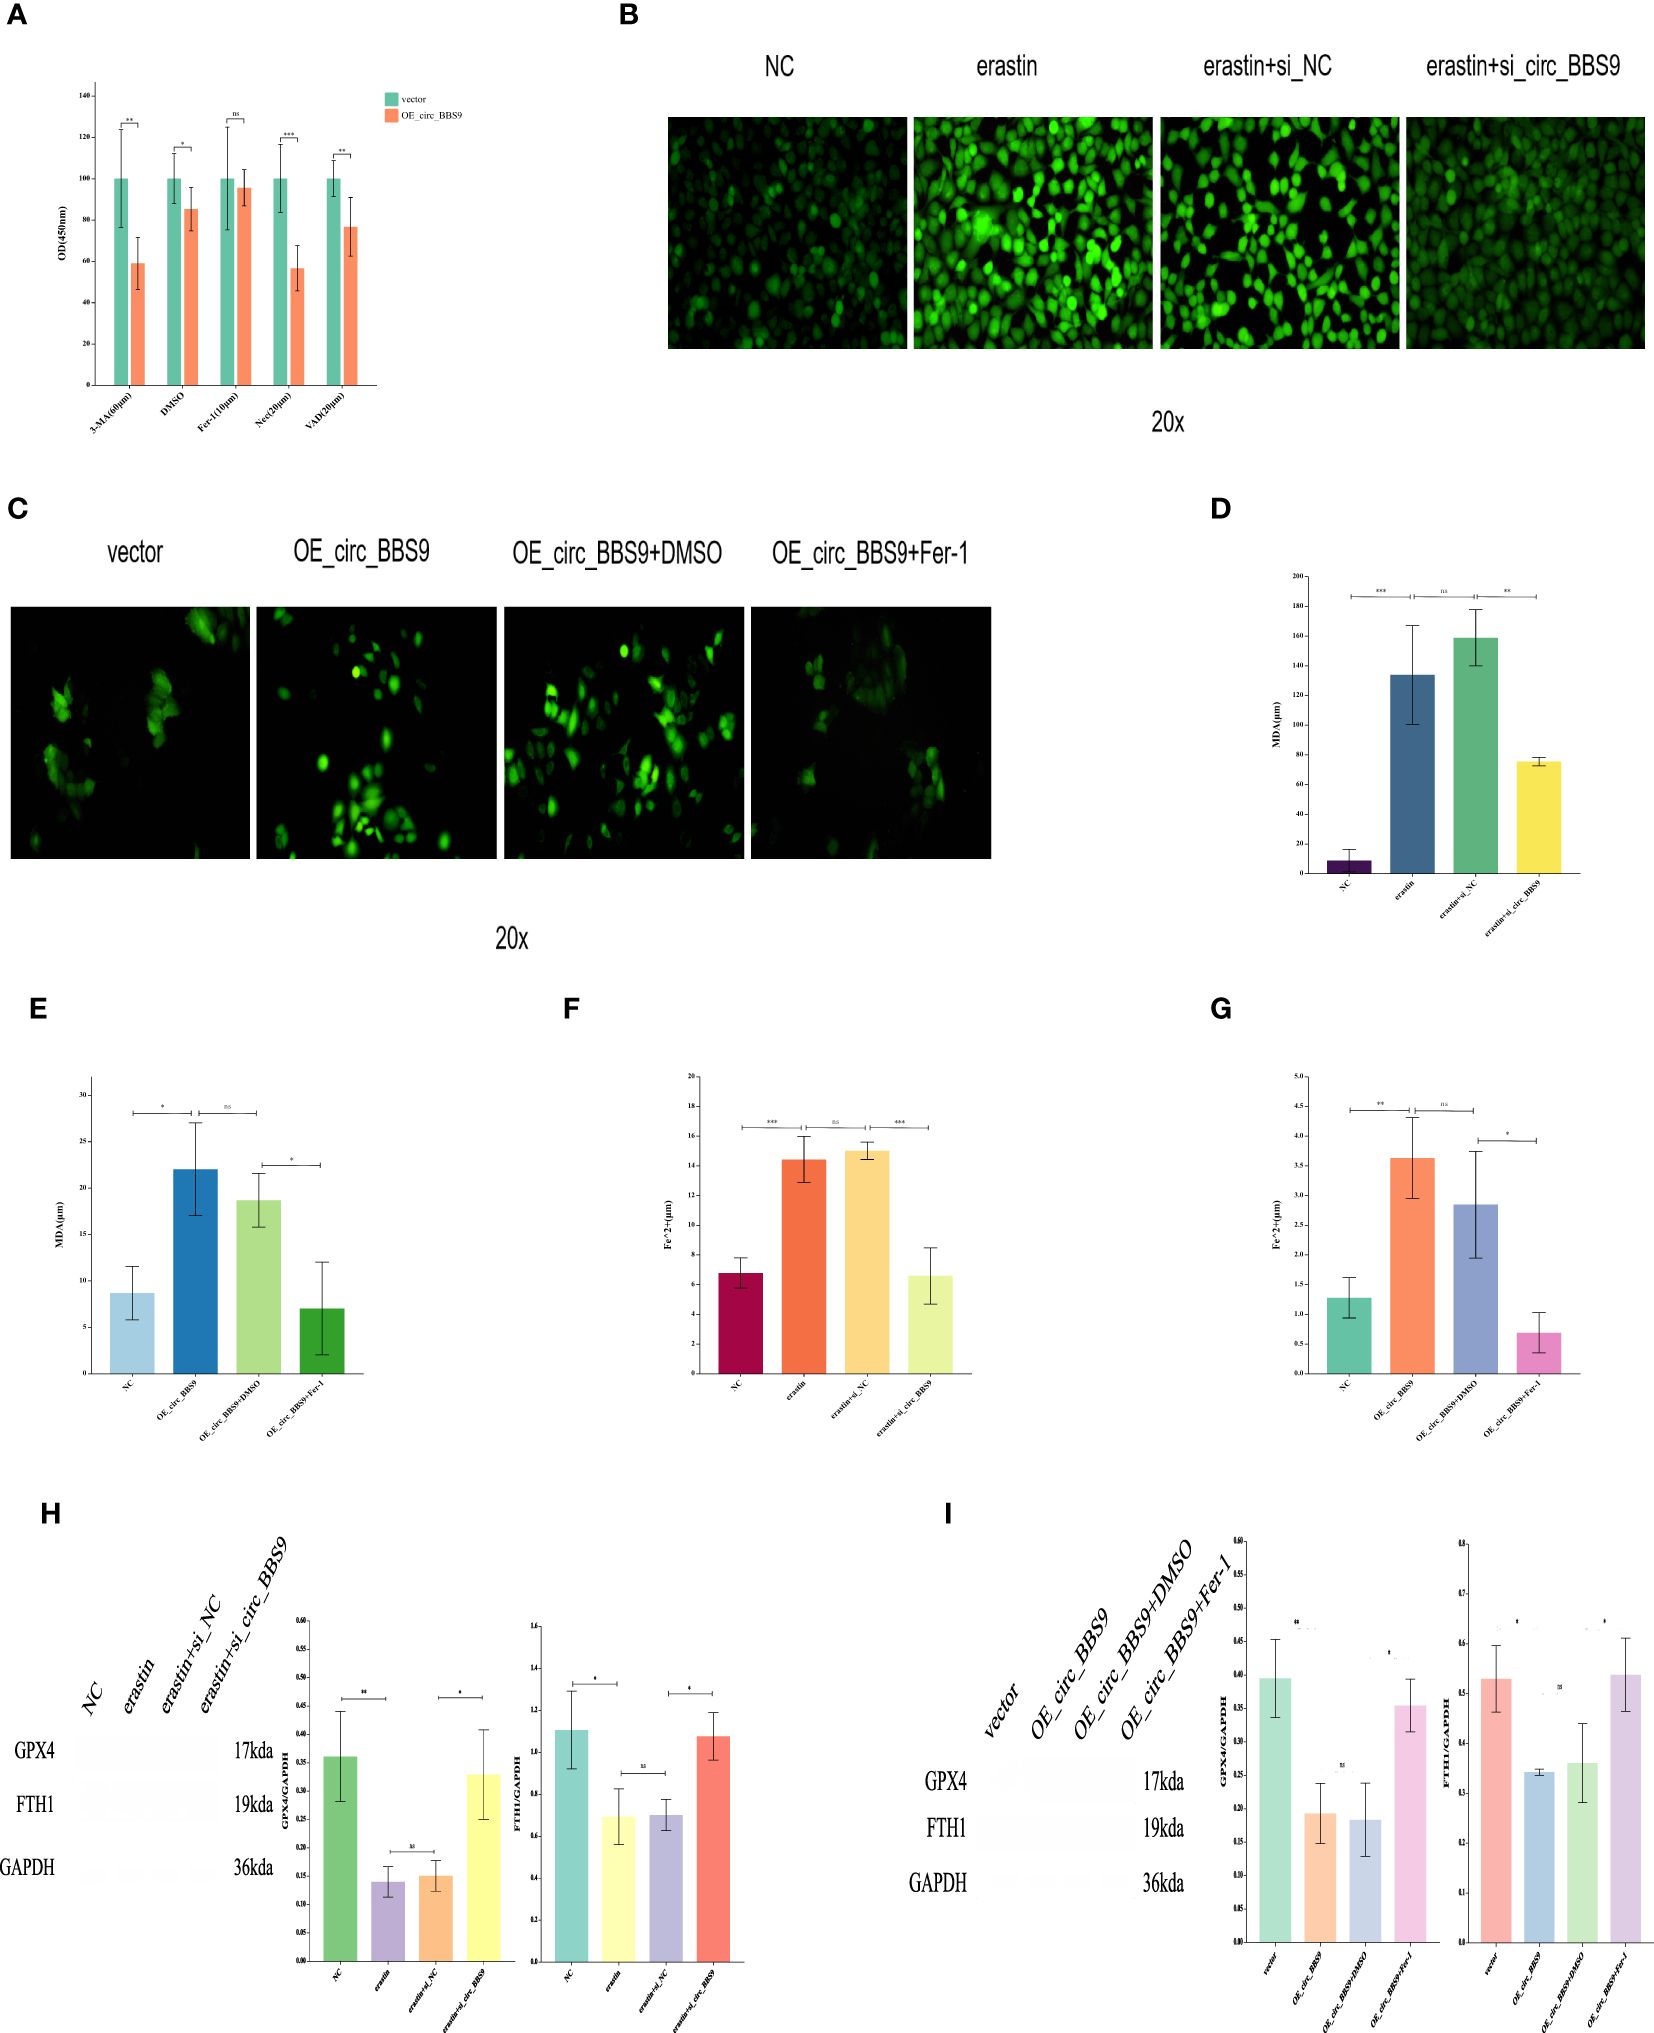
Figure 4 The Effect of Circ_BBS9 on Ferroptosis in A549 and H1299 LUAD Cells. (A) CCK-8 assay to determine the cell death mechanism in lung adenocarcinoma cells. (B) Detection of ROS in H1299 cells using a fluorescence probe. (C) Detection of ROS in A549 cells using a fluorescence probe. (D) Measurement of MDA content in H1299 cells using a colorimetric assay. (E) Measurement of MDA content in A549 cells using a colorimetric assay. (F) Measurement of iron ion concentration in H1299 cells using a colorimetric assay. (G) Measurement of iron ion concentration in A549 cells using a colorimetric assay. (H) Detection of ferroptosis inhibitor GPX4 and FTH1 expression in H1299 cells using Western Blot method. (I) Detection of ferroptosis inhibitor GPX4 and FTH1 expression in A549 cells using Western Blot method.
The process of ferroptosis is often accompanied by an increase in ROS. Therefore, we employed fluorescence probe-based detection to assess ROS expression and observe the occurrence of ferroptosis. The addition of the ferroptosis inducer erastin in H1299 cells led to an elevation in ROS. However, the introduction of erastin in the si_circ_BBS9 group resulted in reduced ROS expression (Figure 4B), indicating that si_circ_BBS9 inhibits ferroptosis in LUAD cells. In A549 cells, OE_circ_BBS9 caused an increase in ROS levels. When we added the ferroptosis inhibitor Fer-1 to the OE_circ_BBS9 group, it lowered the ROS expression induced by overexpression, thereby suppressing ferroptosis (Figure 4C). These results demonstrate that OE_circ_BBS9 promotes ferroptosis in LUAD cells.
Malondialdehyde (MDA) is a natural product of lipid oxidation in biological organisms. The measurement of MDA is widely used as an indicator of the extent of lipid oxidation, and it can be employed to assess the degree of lipid peroxidation. We observed an increase in MDA concentration after introducing the erastin in H1299 cells, while adding the erastin inducer to the si_circ_BBS9 group led to a decrease in MDA concentration (Figure 4D). This indicates that si_circ_BBS9 inhibits ferroptosis in LUAD cells. In A549 cells overexpressing OE_circ_BBS9, MDA concentration increased, but when we added the Fer-1 to the OE_circ_BBS9 group, MDA concentration decreased (Figure 4E). These results demonstrate that OE_circ_BBS9 promotes ferroptosis in LUAD cells.
Iron ions form complexes with proteins, and in acidic environments, iron dissociates from the complexes and is then reduced to ferrous iron. It eventually forms a purple-red compound with ferrozine, which can be quantified through colorimetry in the wavelength range of 540-580 nm. This method is used to measure iron ion concentration. In H1299 cells, the introduction of the erastin resulted in an increase in ferrous iron ion concentration, whereas adding the erastin inducer to the si_circ_BBS9 group led to a decrease in ferrous iron ion concentration (Figure 4F). This indicates that si_circ_BBS9 inhibits ferroptosis in LUAD cells. In A549 cells overexpressing OE_circ_BBS9, ferrous iron ion concentration increased, but when we added the Fer-1 to the OE_circ_BBS9 group, ferrous iron ion concentration decreased (Figure 4G). These results demonstrate that OE_circ_BBS9 promotes ferroptosis in LUAD cells.
Glutathione peroxidase 4 (GPX4) mitigates the toxicity of lipid peroxides through its catalytic activity, maintaining the stability of the lipid bilayer membrane, thereby inhibiting the occurrence of ferroptosis. Ferritin heavy chain 1 (FTH1) can disrupt autophagosomes, thus inhibiting ferroptosis. The expression of GPX4 and FTH1 was assessed through Western blot analysis. In H1299 cells, the introduction of the erastin led to decreased expression of GPX4 and FTH1, while adding the erastin inducer to the si_circ_BBS9 group resulted in increased expression of GPX4 and FTH1 (Figure 4H). These findings indicate that si_circ_BBS9 inhibits ferroptosis in LUAD cells. In A549 cells overexpressing OE_circ_BBS9, the expression of GPX4 and FTH1 decreased, but when we added the Fer-1 to the OE_circ_BBS9 group, the expression of GPX4 and FTH1 increased (Figure 4I). These results demonstrate that OE_circ_BBS9 promotes ferroptosis in LUAD cells.
These experimental results underscore the role of circ_BBS9 in regulating the process of ferroptosis and its impact on lipid oxidation and iron ion homeostasis. This contributes to a deeper understanding of the biological mechanisms of circ_BBS9 in LUAD.
Circ_BBS9 interacts with IFIT3, mediating protein ubiquitination and subsequently affecting protein stabilityTo identify potential proteins that interact with circ_BBS9 in LUAD, we employed biotinylated circ_BBS9 probes for circ_RNA pull-down analysis, followed by silver staining SDS-PAGE analysis (Figure 5A). Bands of proteins that differed between the Control and circ_BBS9 groups were excised and sent to the mass spectrometry platform for protein identification (Figure 5B).
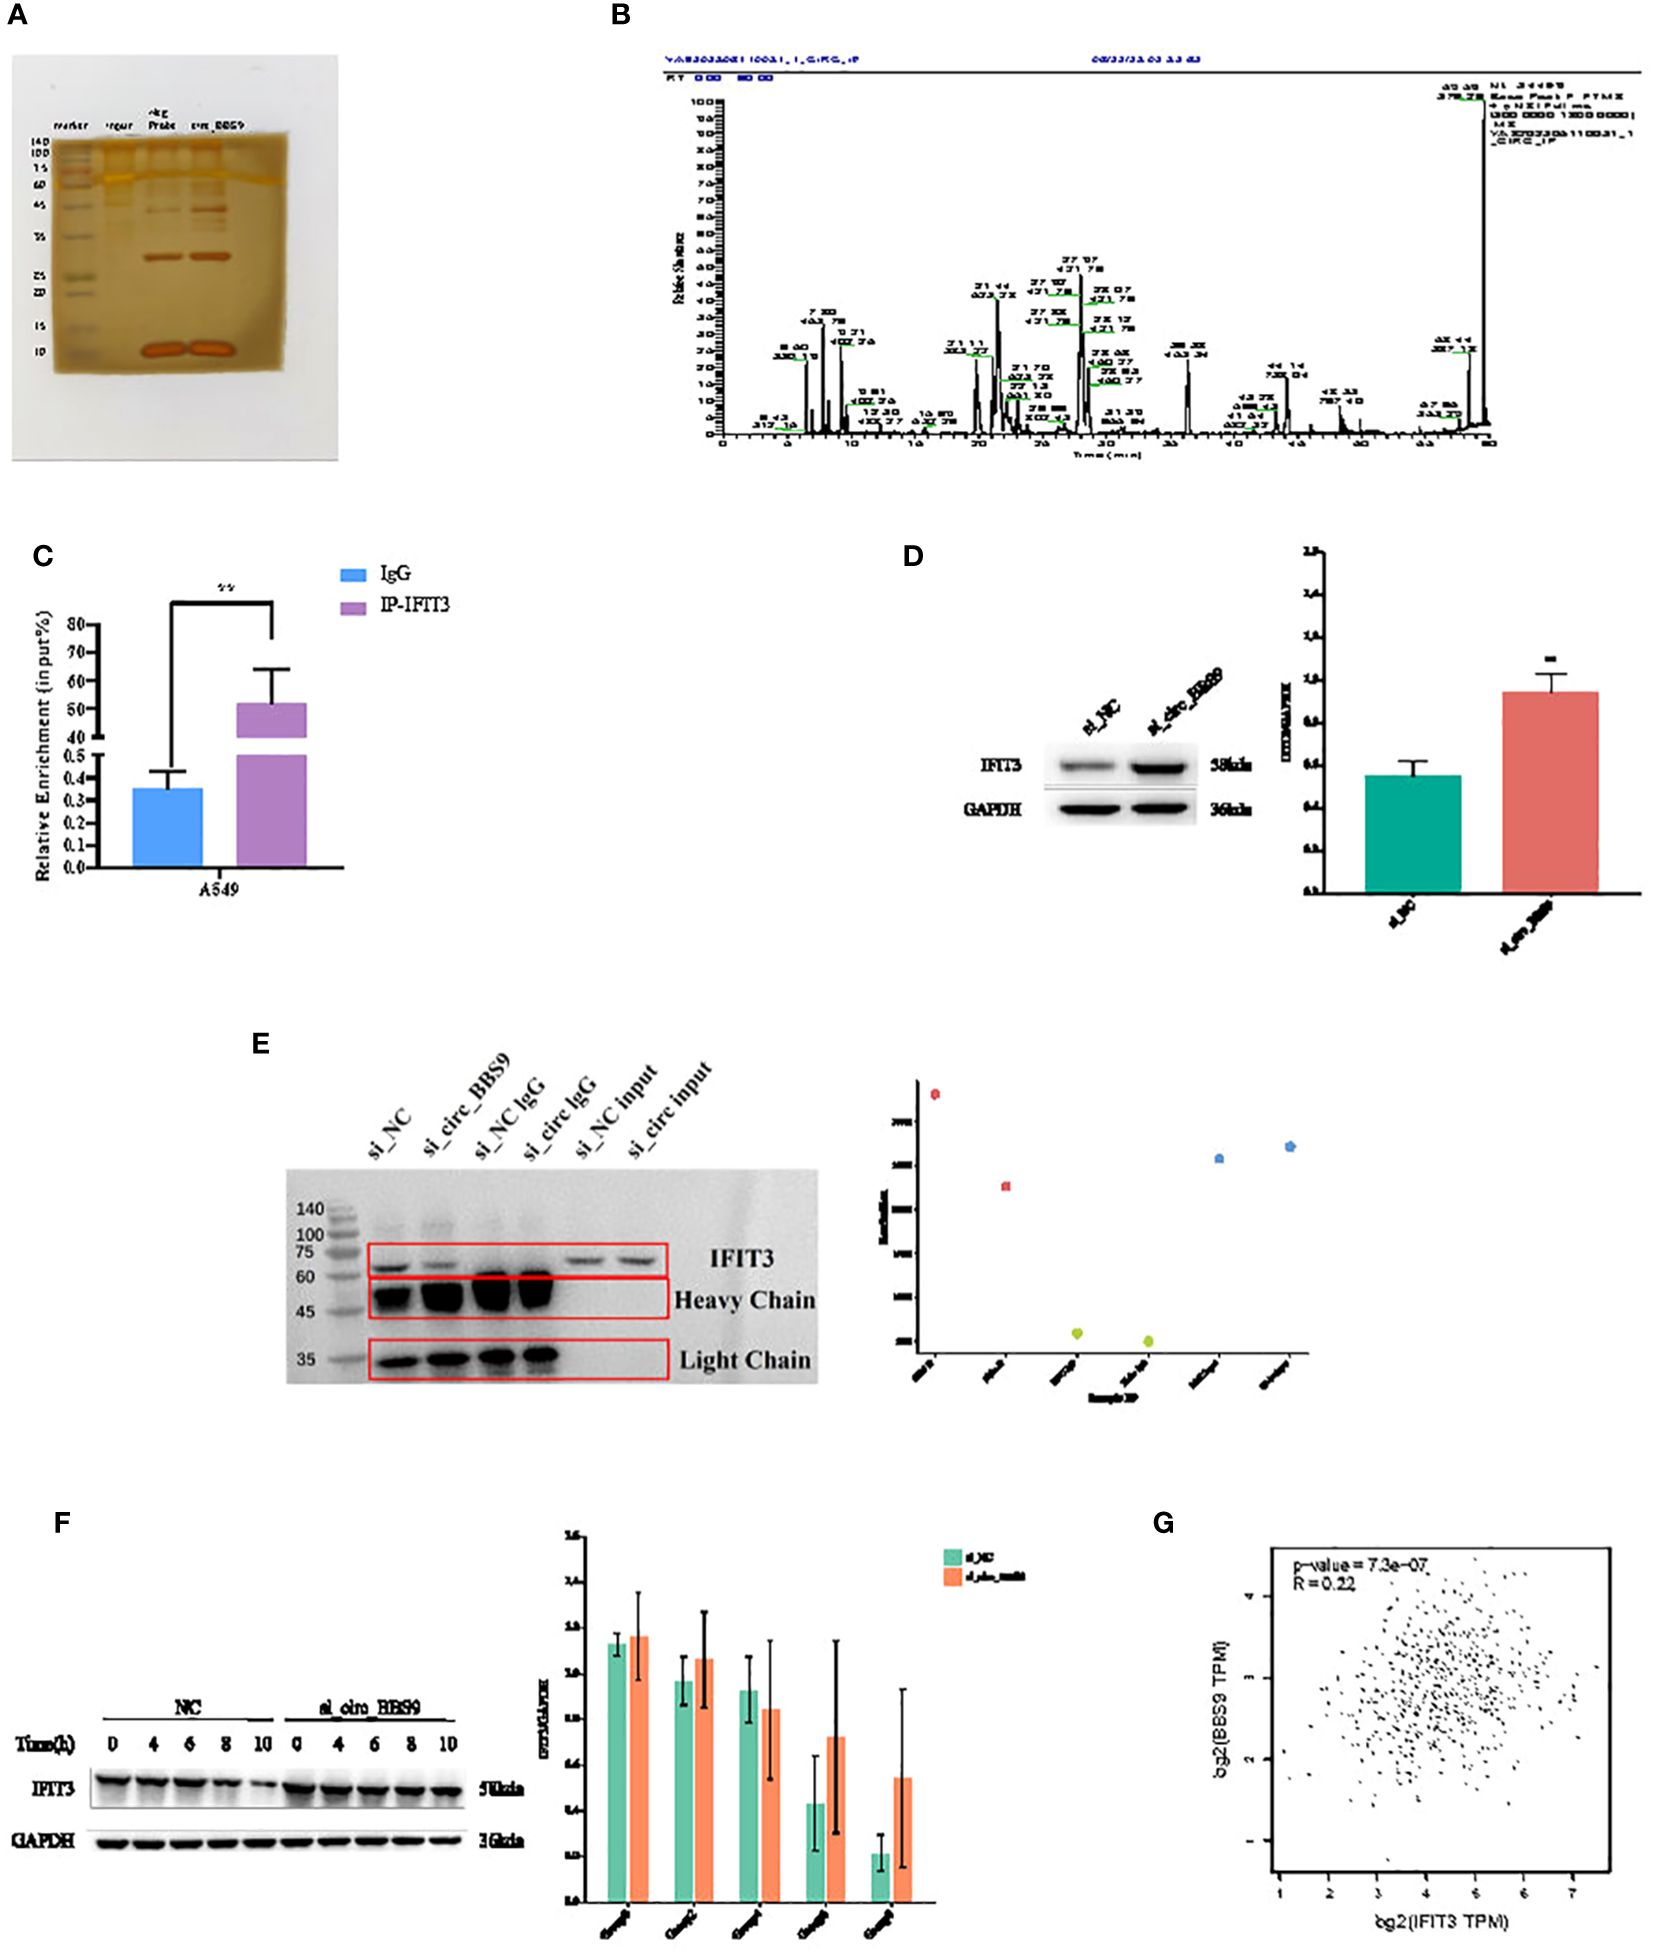
Figure 5 Circ_BBS9 interacts with IFIT3, mediating protein ubiquitination and subsequently affecting protein stability. (A) RNA pulldown was performed using biotin-labeled circ_BBS9 probe, followed by mass spectrometry analysis. (B) RNA pulldown assay was performed to verify the interaction between circ_BBS9 and IFIT3 in A549 cell. (C) RBP immunoprecipitation (RIP) assay was performed using IG-IFIT3 or IgG antibodies, followed by qRT-PCR assay for circ_BBS9 expression in A549 cell. (D) Western blot was performed to detect the expression of IFIT3 in GAPDH and si_circ_BBS9. (E) Co-immunoprecipitation (Co-IP) experiments were conducted on A549 cells using ubiquitination antibodies. (F) Experiments on the stability of IFIT3 protein. (G) Gene expression profiling interactive analysis (GEPIA: http://gepia.cancerpku.cn/).
Among the potential proteins interacting with circ_BBS9, circ_RNA pull-down and immunoprecipitation (IP) cell lysate silver staining experiments revealed a successful pull-down of circ_BBS9. Furthermore, these experiments demonstrated a robust binding between circ_BBS9 and IFIT3 protein within A549 cells (Figure 5A). Additionally, RNA immunoprecipitation (RIP-PCR) experiments showed the enrichment of circ_BBS9 within the IP-IFIT3 group, providing further support for the molecular interaction between circ_BBS9 and IFIT3 (Figure 5C). Moreover, Western blot (WB) analysis of the pulled-down proteins revealed a significant increase in IFIT3 protein levels in A549 cells with circ_BBS9 knockdown (Figure 5D).
In addition, we performed co-immunoprecipitation experiments with A549 cells using a ubiquitination antibody (Figure 5E) and assessed IFIT3 protein stability (Figure 5F). Consequently, we postulate that circ_BBS9 may stabilize the IFIT3 protein through direct interaction.
To further validate our findings, we utilized Gene Expression Profiling Interactive Analysis (GEPIA) to confirm this association. Our analysis revealed a positive correlation between BBS9 and IFIT3 in LUAD (Figure 5G). These results provide experimental evidence for the interaction between circ_BBS9 and IFIT3, emphasizing its potential significance in LUAD.
Construction of the upstream regulatory network of IFIT3We utilized miRNA databases, mirDIP, and TargetScan resources to explore the upstream miRNA regulatory factors controlling IFIT3 (Figure 6A). Initially, through these databases, we obtained a set of predicted miRNAs, totaling 18. Subsequently, we conducted expression and survival analysis for these predicted miRNAs (Figures 6B, C) to further refine our selection. During the analysis, it became evident that only 9 of the miRNAs had available expression data. Therefore, we performed statistical analysis on the expression of these 9 miRNAs, with particular focus on hsa-miR-7150 and hsa-miR-487b-5p. We also conducted statistical analysis of their overall survival. The results indicated that hsa-miR-7150 was the most likely miRNA involved in the regulation of IFIT3.Furthermore, we provided the complementary sequences between IFIT3 and hsa-miR-7150 (Figure 6D), implying the potential existence of a miRNA-mRNA interaction between them.
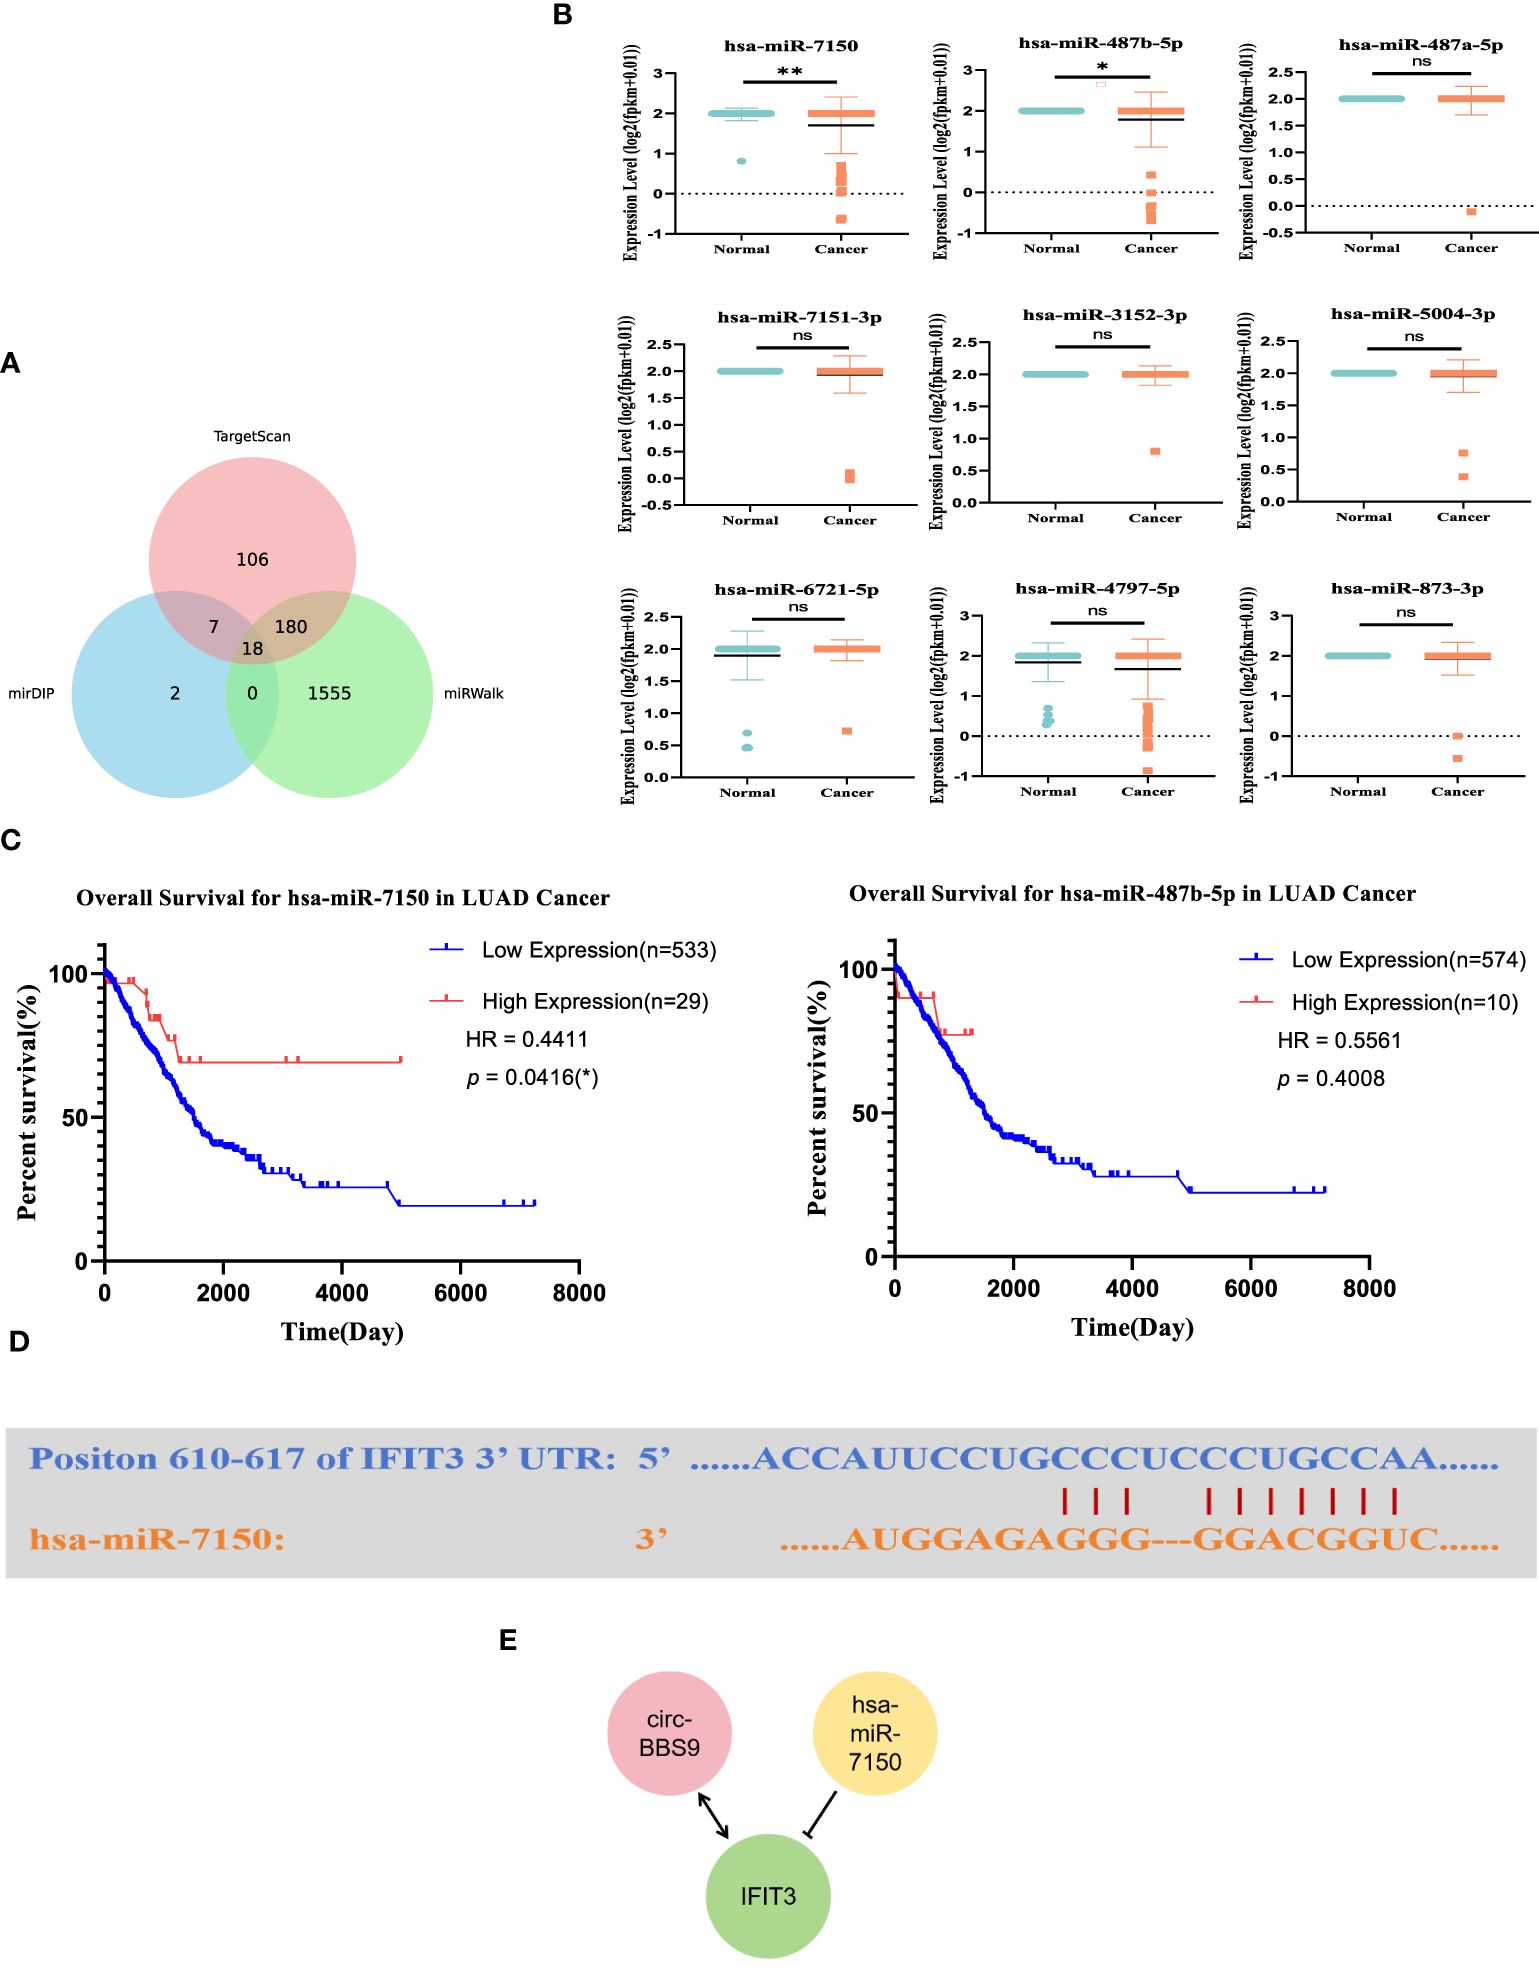
Figure 6 Construction of the Upstream Regulatory Network of IFIT3. (A) Venn diagram found that potential miRNAs of IFIT3. (B) Predicted miRNA expression levels. (C) Predicted miRNA survival levels. (D) Predicted interaction of IFIT3 and has-miR-7150. (E) Potential upstream TF-miRNA-mRNA regulatory network of IFIT3.
Based on these findings, we constructed a molecular regulatory network in LUAD (Figure 6E), which includes circ_BBS9, hsa-miR-7150, and IFIT3. This network aids in gaining a better understanding of the regulatory mechanisms of IFIT3 and its role in LUAD.
The relationship between IFIT3 expression and the prognosis of LUADTo establish the relationship between IFIT3 and LUAD, we conducted a series of data analyses. First, we used UALCAN to analyze the expression of IFIT3 in different tumors (Figure 7A). The results showed differential expression of IFIT3 in various tumor tissues. We analyzed data from the TCGA database (Figure 7B) and the GSE116959 GEO database (Figure 7C), assessing the mRNA expression levels of IFIT3 in LUAD tissue and non-tumor tissue, and validated the protein-level expression of IFIT3 in LUAD using the Human Protein Atlas (HPA) database (Figure 7D).
留言 (0)