
記住我
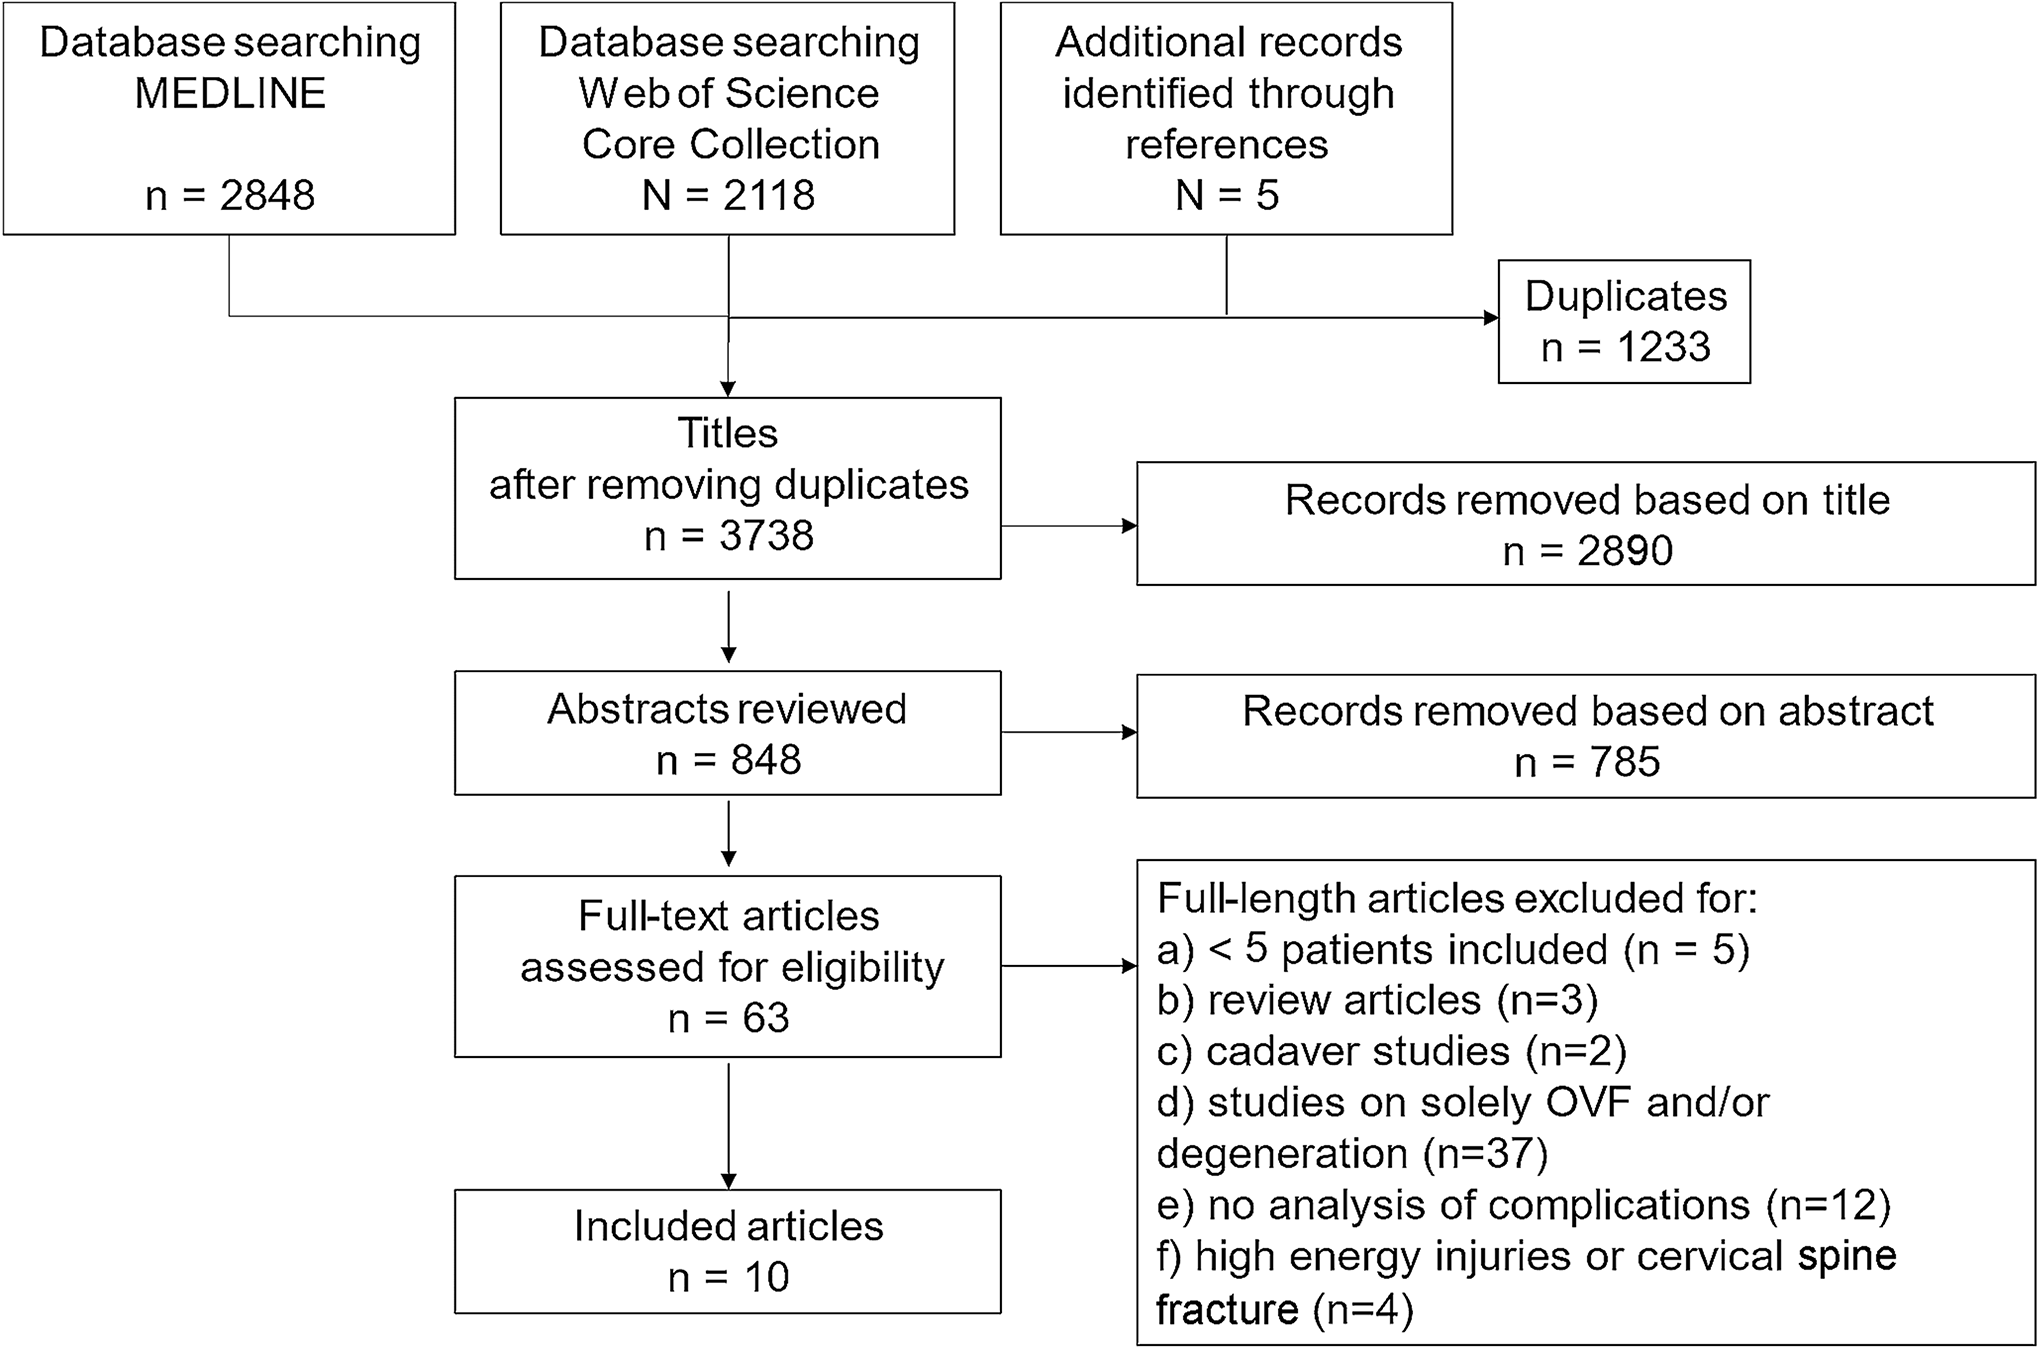


The current study is a register-based cohort study originated from data from the Norwegian neck and back registry (NNRR) from 2021. NNRR is a national quality register established in 2012. Outpatient clinics in all Departments of Physical Medicine and Rehabilitation (PMR) in Norway receiving neck and back pain patients are obliged to deliver data to NNRR. All patients attending the outpatient clinics are invited, hence an unselected population reflecting normal clinical settings. The register collects data (digitally) prior the PMR baseline consultations, and after 6- and 12-months. For the current study we included back pain patients who fulfilled both follow-up forms and the patient global impression of change (PGIC) (Figs. 1 and 2).
Fig. 1
Flowchart of participants responding to the Norwegian neck and back register
Patient reported outcome measuresRecently, the first study based on NNRR was published, with detailed description of PROMs and set-up of the register [11]. The current study includes pain intensity during activity during the past week (NRSa) reported on an 11-point numeric rating scale, ranging from 0 (lowest pain) to 10 (highest pain). Oswestry Disability Index (ODI) [12] which consists of 10 items, ranging from 0 to 5. The summed score is presented as a percentage where 0% indicates no pain related disability and 100% maximum pain related disability [12]. Health related life quality for the last 30 days measured through EQ-5D including five domains with 5 levels from no problem (1) to extreme problem (5). EQ-5D is reported on a scale from − 0.59 to 1, were 1 is the best health state, with a cut-off value of ≥ 0.75 considered as normal health-related life-quality. The Norwegian Medicine Agency recommends the utilizing the EQ-5D 3L algorithm for the UK [14].
Anchor for minimal important changePatient Global Impression of Change (PGIC) scales are often as used an anchor to categorize patients’ improvement, deterioration or no important change [15]. At 6- and 12-month follow-up the patients were asked to rate the effect of the treatment received on a 7-point Likert scale were (1) was “I am all fine”, (2) “much improved”, (3) “minimally improved”, (4) “unchanged”, (5) “minimally worse”, (6) “much worse” and (7) “worse than ever.“ For the statistical analysis of the PGIC were trichotomized into three ordinal categories 1 to 3 as “improved”, 4 as “unchanged” and 4 to 7 as worsened. We also trichotomized 1 and 2 to “much improved”, 3 to 5 as “unchanged” and 6 and 7 to “much worsened”.
StatisticsThe statistical analysis was performed with IBM SPSS Statistics version 28. We present descriptive data as means (standard deviations).
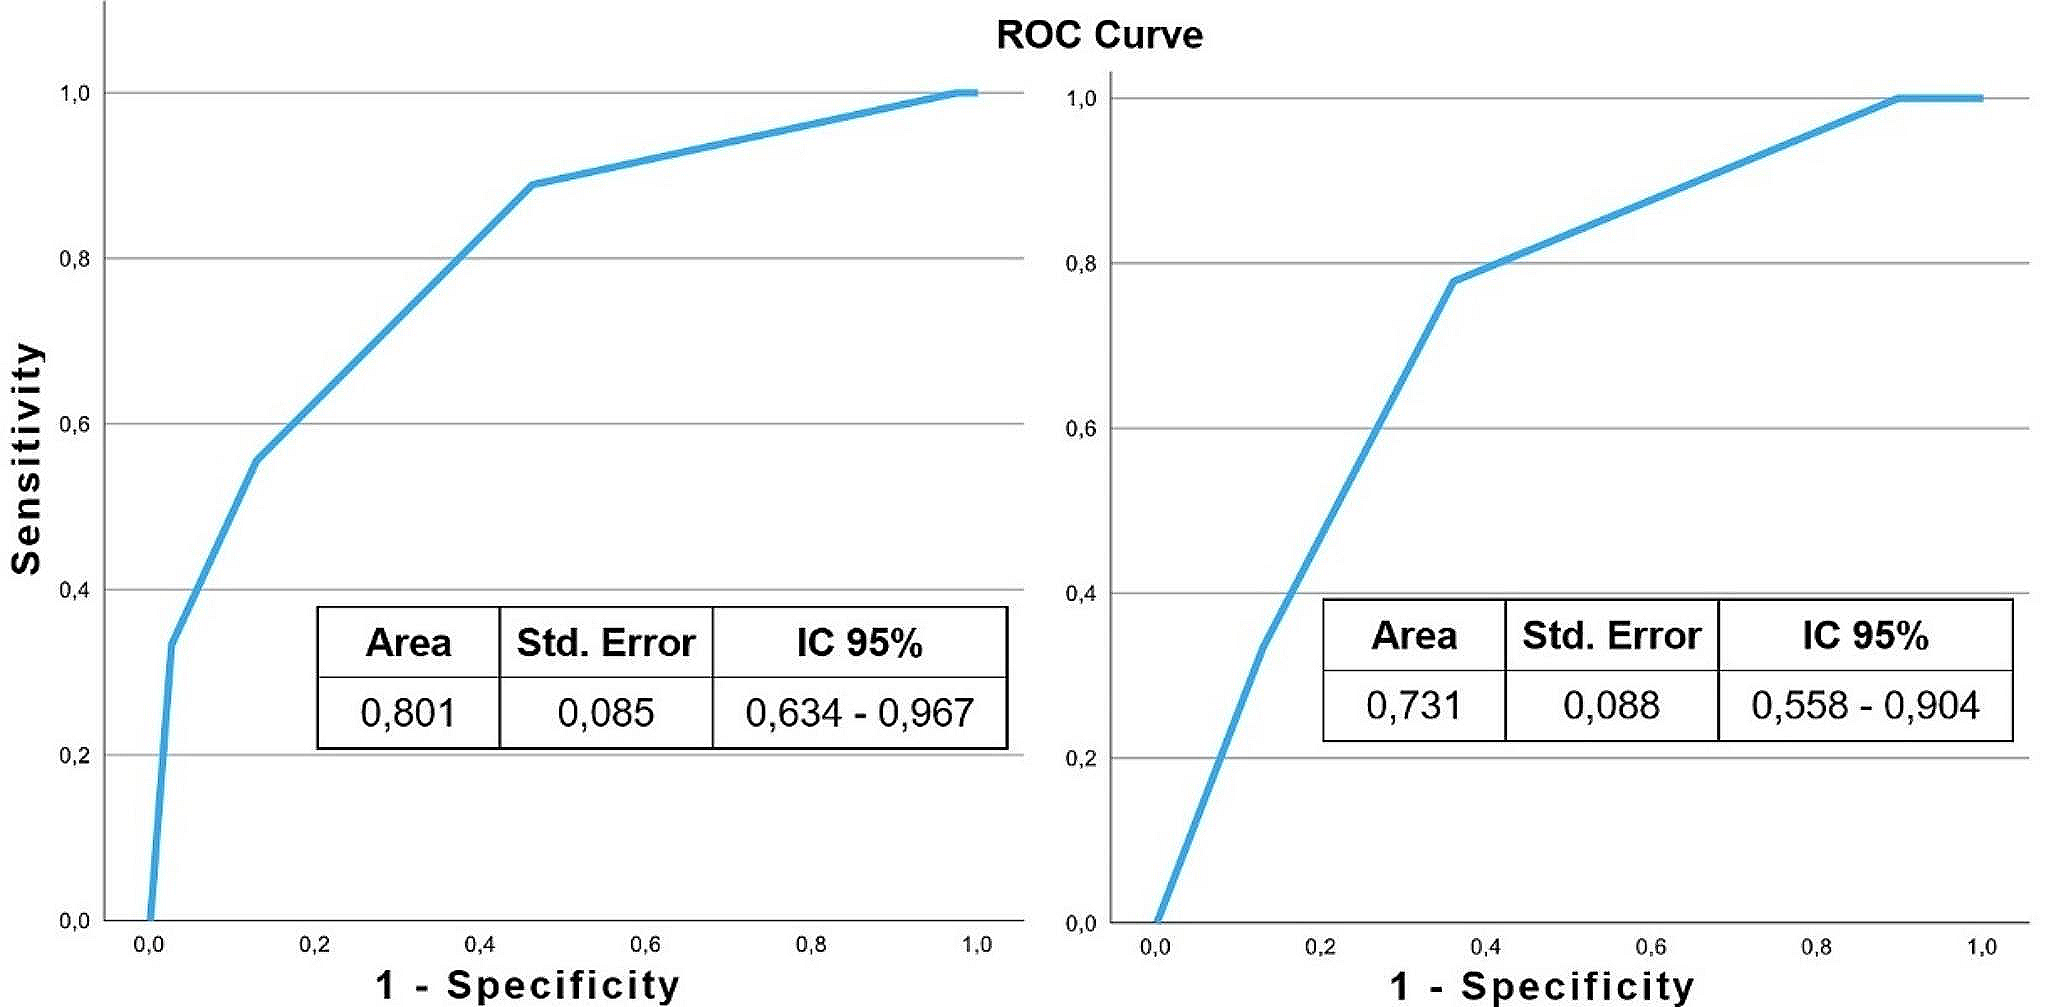
ResponsivenessWe calculated responsiveness for both improvement and worsening with the “unchanged” group as reference group. Responsiveness was calculated using standardized response mean (SRM) and measuring area under the curve (AUC) for the receiver operating characteristic (ROC) curve. SRM was estimated by dividing the mean change score by the standard deviation (SD) of the change scores, in the improved, unchanged, and worsened group of patients. We used the cut-off SRM > 0.8 indicating large responsiveness, 0.5-0.0.8 moderate, and 0.2-<0.5 low. The AUC for the ROC curve (ROCAUC) represents the ability of the PROM to separate between patients who have improved and patients who have not improved. Spearman correlation coefficient > 0,30 was required between the anchor and the change score of the measurements [16]. Responsiveness can be considered adequate when the AUC is at least 0.7 [4]. The AUC was estimated with 95% confidence intervals.
Anchor-based minimal important changeWe used the anchor based ROC-method to estimate the MIC values for each PROM [4]. ROC-curves were plotted as the combination of sensitivity and 1 – specificity for each change score. The sensitivity is the proportion of importantly improved patients, correctly identified by the PROM, and specificity is the proportion of patients with no important change correctly identified by the PROM. The three groups of patients according to the PGIC “improved”, “unchanged” and ”worsened”, will overlap in their change scores, and the optimal cut-off point is where the sum of proportions of misclassifications is smallest ((1- sensitivity) + (1-specificity)) or equivalently the point closest to the upper- left corner [5].
Distribution-based minimal important changeWe also calculated the MIC according to the distribution-based approach using two methods.
1.0,5 SD: half the SD of the measured change in PROM scores [17].
2.The effect size: multiplying the SD of the baseline score by 0.2 (small effect size) [18].
EthicsThe Norwegian Directorate of Health has granted national status to the medical quality registry (NNRR) in 2011. The registry adheres to the Personal Protection Regulation article 6 no. 1 letter e (public interest) and follows the regulation on medical quality registry. An updated Data Protection Impact Assessment (DPIA) was in 2022 to ensure data security and privacy (2020/5880). Participation is based on written consent. A national expert group reviews all applications for data delivery to research purposes and approval from the Data Protection Office is required for the specific research project. Hence, this study was approved by the Data Protection Officer (22/07399) at Oslo University Hospital “and the data was delivered and stored in accordance with the regulations of both Oslo University Hospital and NNRR”.
留言 (0)