
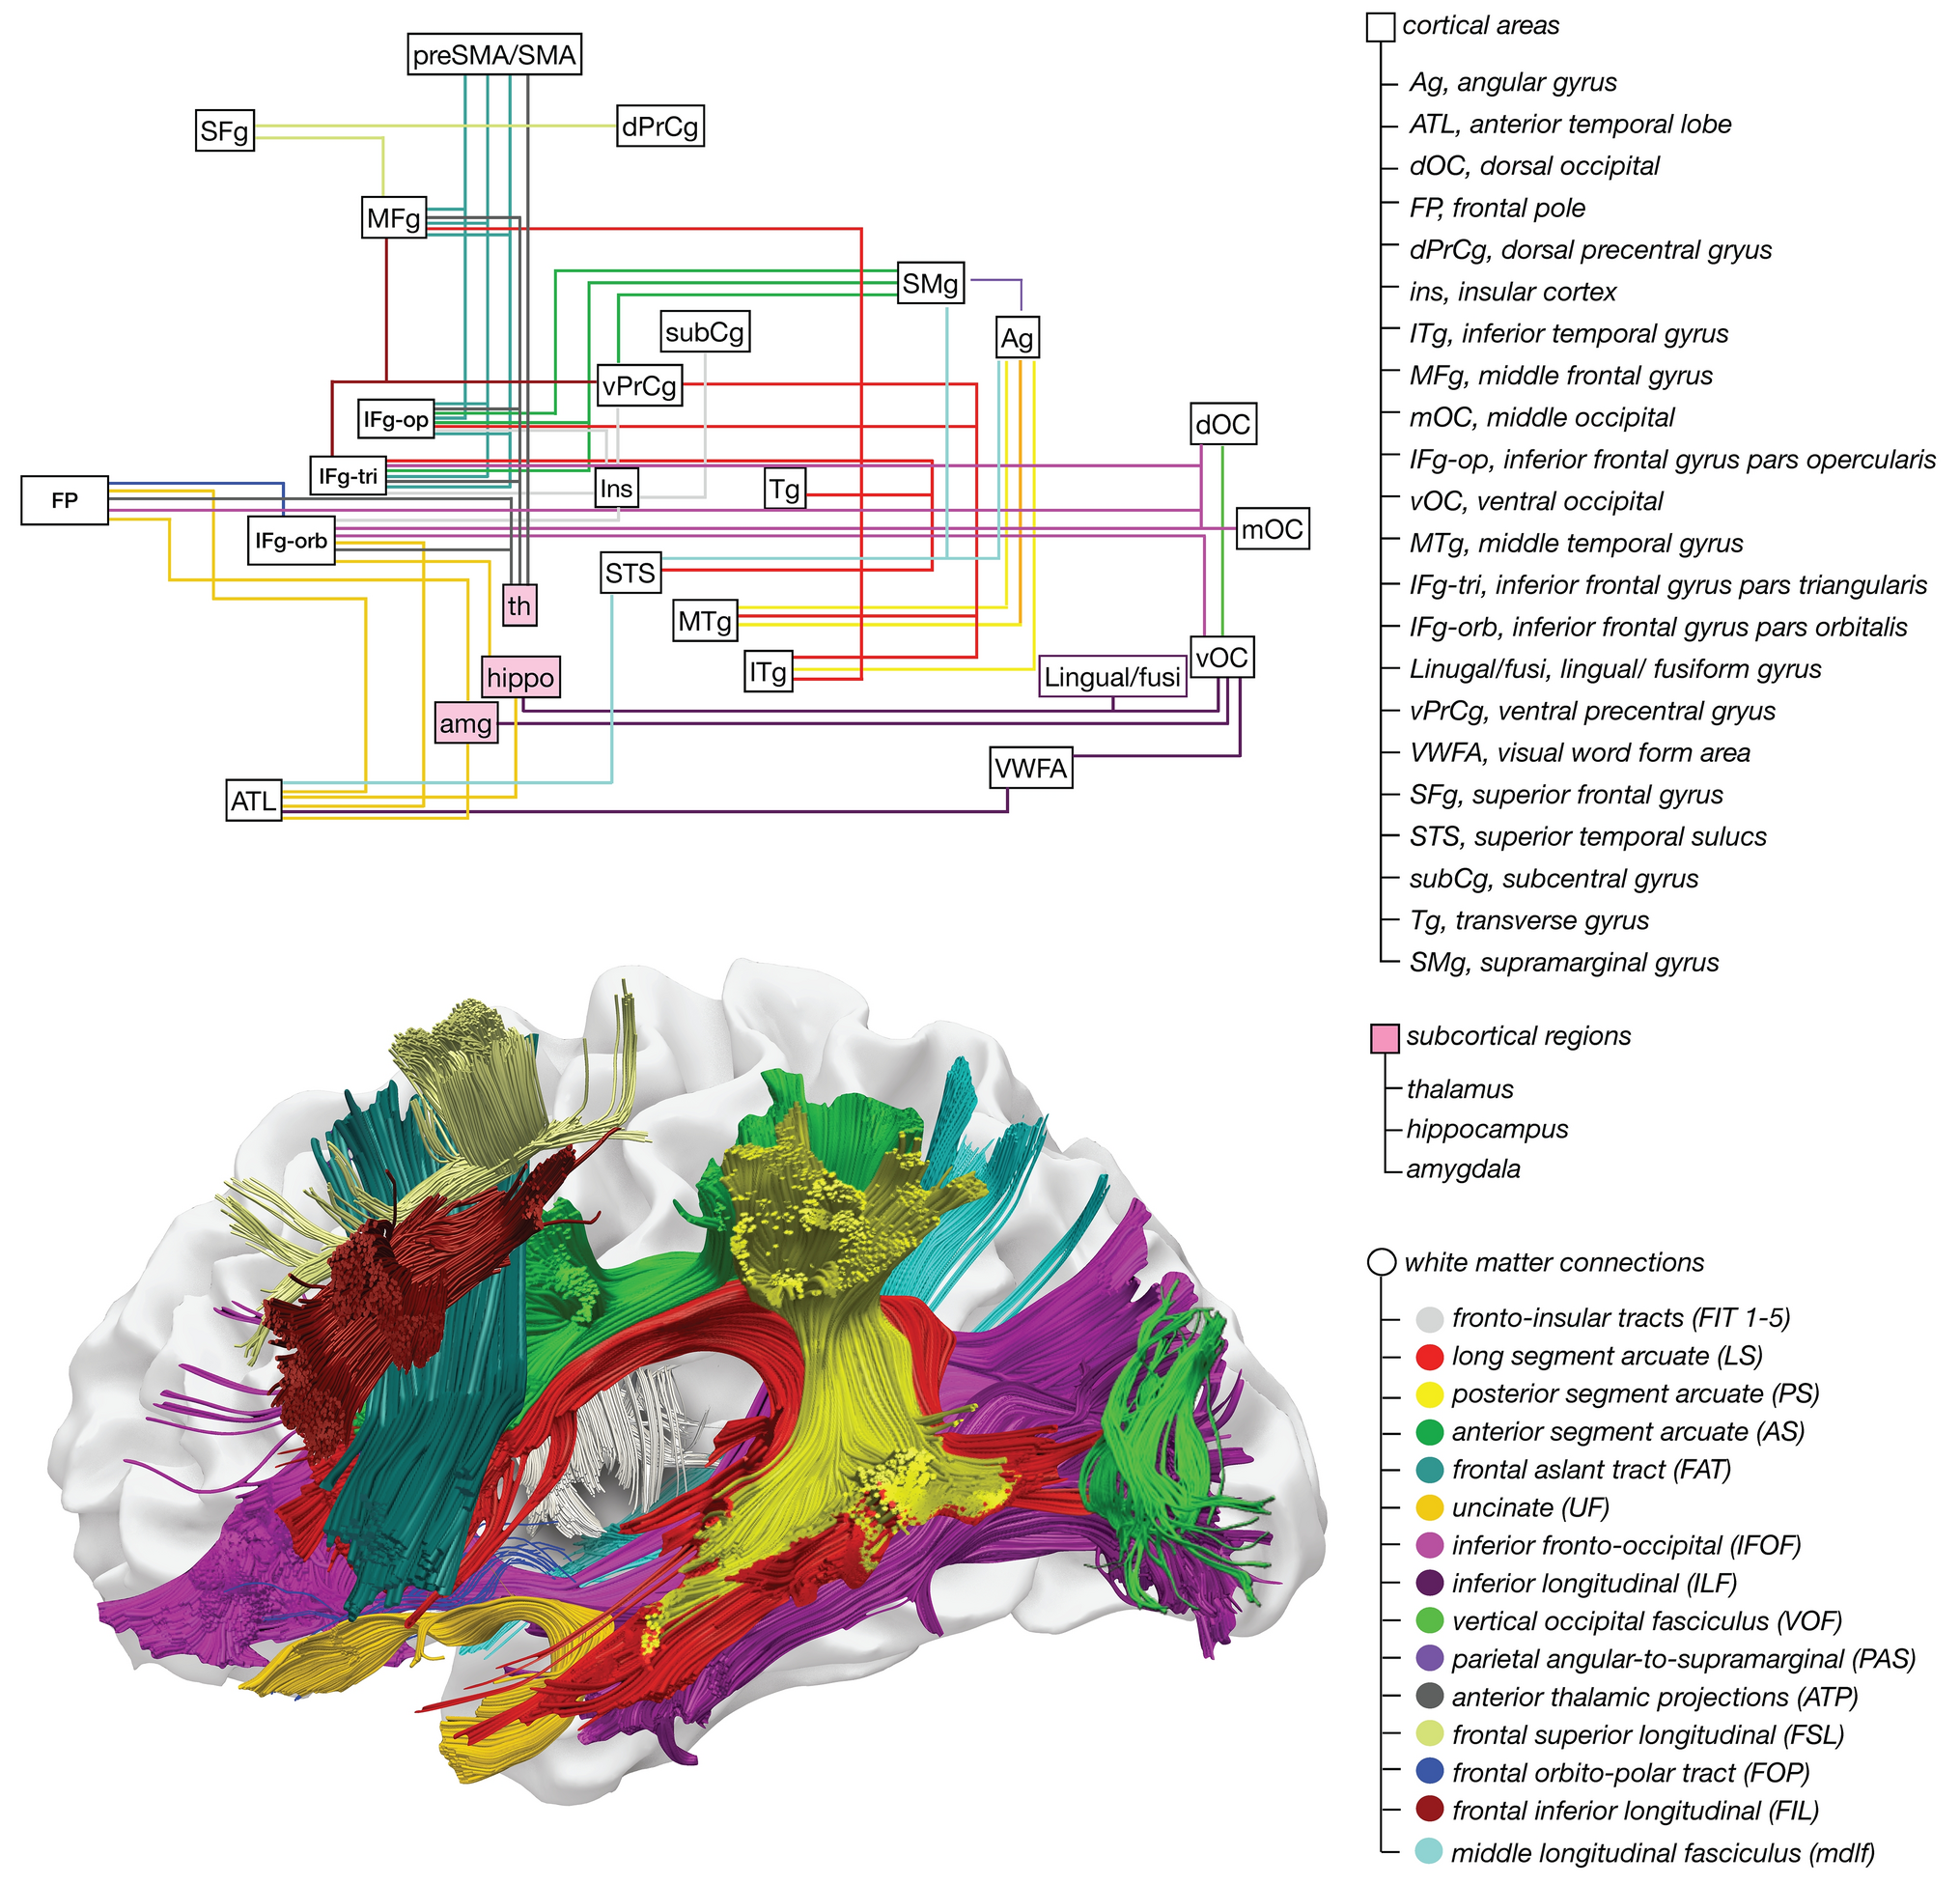
記住我


Three previously collected and published datasets were employed in this study for the alerting task (18 participants, Chica et al. 2016), the orienting task (18 participants, Chica et al. 2013) and the executive attention task (20 participants, Martín-Signes et al. 2019) (Fig. 1.I). Data was originally collected with the informed consent of the participants, following the principles of the Declaration of Helsinki, and with the approval of the Ethics Committee of the INSERM (France) and the University of Granada (Spain). Datasets were provided by the authors of the original studies and analyzed with their consent.
Fig. 1
Pipeline of the fMRI procedure including key steps. CCS, cluster detection threshold; CDT, cluster-defining threshold; GLM, general linear model; MNI, Montreal Neurological Institute
Experimental tasksFull description of the stimuli and procedure can be found in the original publications (Chica et al. 2013, 2016; Martín-Signes et al. 2019). All three studies employed a visual perceptual task with three complementary attentional manipulations (i.e., phasic alerting, spatial orienting, and executive attention; see Fig. 2). The target was a near-threshold stimulus that could appear inside one of two lateral boxes (located on the right and left visual field). In some trials (catch trials) the target was not presented (these trials ranged between 13 and 25% depending on the experiment). Target contrast was manipulated for each participant before the experimental task in order to adjust the percentage of consciously perceived targets to ≈ 50%. Participants’ responses were given manually by pressing buttons on an MRI compatible fiber optic box.
Fig. 2
Sequence and timing of events in a given trial of each of the three attentional tasks: (A) alerting task, (B) orienting task, and (C) executive attention task. Adapted with permission from Chica et al. 2013, 2016; Martín-Signes et al. 2019
For the alerting task, the alerting cue (white noise) was presented on 50% of the trials. The task also included a central endogenous cue but this manipulation is not analyzed in the present study. Participants were required to give two consecutive responses: first, they had to discriminate the orientation of the lines composing the target (objective response); and second, they had to report if they consciously detected its appearance (subjective response) by indicating its location (right or left box) or indicating that the target was not seen (see Fig. 2A). The experiment consisted of two sessions with 5 functional scans of 12 min duration each (920 trials in total).
For the orienting task, a peripheral cue was presented for 300 ms and consisted of a square surrounding one of the lateral boxes. The cue was predictive about the spatial location of the target on 67% of the target-present trials (valid trials), while the remaining 33% of the target-present trials were invalid (where the target was presented at the opposite location to the cue). Similar to the alerting task, participants were required to give an objective and a subjective response. The latter was made by responding to the question ‘‘Did you see the stimulus?’’ with a “yes” or “no” answer (see Fig. 2B). The experiment consisted of one session with 5 functional scans of 7 min duration each (280 trials in total).
For the executive attention task, a Stroop task was centrally presented, concurrently to the appearance of the target. Spanish words for blue, green, and yellow colors were displayed either in blue, green, or yellow color. On congruent trials the word meaning and the color matched, and on incongruent trials the word meaning and the color were different (20% of trials). Participants performed two consecutive tasks: first, they had to discriminate the word’s color, and second, they had to report if they consciously detected the appearance of the target (right or left box, or unseen target) (see Fig. 2C). The experiment consisted of 2 sessions with 5 functional scans of 8 min duration each (600 trials in total).
Images of the three attentional tasks were presented on a screen located at the back of the scanner and viewed with a mirror mounted on the head coil. The jitter fixation and the order of trial types within each scan in all three tasks were determined with an optimal sequencing program (i.e., Optseq2), designed to maximize the efficiency of recovery of the blood-oxygen-level dependent (BOLD) response ((Dale 1999); http://surfer.nmr.mgh.harvard.edu/optseq/).
Acquisition parametersFull descriptions of the acquisition parameters can be found in the original publications (Chica et al. 2013, 2016; Martín-Signes et al. 2019). Whole-brain fMRI was conducted on two different Tesla Siemens TRIO MRI scanners using a whole-head coil. Functional images were acquired using a gradient-echo echo-planar pulse sequence with the following parameters for the alerting task (time-to-repetition [TR] = 2000 ms, time-to-echo [TE] = 25 ms, 39 axial 3-mm cubic slices, no inter-slice gap, flip angle = 75°, field of view [FoV] = 220 mm, 372 volumes acquired per run), the orienting task (TR = 2000 ms, TE = 25 ms, 34 axial 2.5 × 2.5 × 3-mm slices, no inter-slice gap, flip angle = 75°, FoV = 220 mm, 220 volumes acquired per run), and the executive attention task (TR = 2000 ms, TE = 25 ms, 35 axial 3.4-mm cubic slices, no inter-slice gap, flip angle = 75°, FOV = 220 mm, 245 volumes per run). High-resolution T1-weighted anatomical images were also collected (TR = 2300 ms, TE = 4.2 ms, flip angle = 9º, FoV = 256 mm, voxel size = 1 × 1 × 1 mm, 176 slices, for the alerting and orienting tasks; TR = 2530 ms, TE = 3.5 ms, flip angle = 7º, FoV = 256 mm, voxel size = 1 × 1 × 1 mm, 176 slices, for the executive attention task). DWI data was only collected for one of the datasets (Martín-Signes et al. 2019). Note that DWI data from the participants’ sample was not used in the present study since the functionnectome employs a normative high-resolution tractography (Nozais et al. 2021). The full fMRI pipeline is illustrated in Fig. 1.
fMRI preprocessingPreprocessing routines and analyses were performed using FEAT (FSL, FMRIB’s Software Library, Woolrich et al. 2001) (Fig. 1.II). Brain extraction was performed using BET (Smith 2002). Images were corrected for differences in timing of slice acquisition and were realigned to the middle volume by means of rigid-body transformation for motion correction using MCFLIRT (Jenkinson et al. 2002). Motion plots were visually inspected to discard those runs with excessive motion (i.e., relative motion > than half of voxel size, or absolute motion > than voxel size). Only in the alerting experiment some runs were eliminated for exceeding these parameters. Concretely, for three participants we excluded 1 to 3 runs. Structural and functional volumes of each participant were coregistered using the Boundary-Based Registration function. Next, the structural volume was registered to a standard image and a similar transformation was applied to the functional volume using a non-linear registration with 12 degrees of freedom. During normalization, volumes were sampled to 2 mm isotropic voxels and standard images were based on the MNI152 stereotaxic space. A 128s high-pass filter was used to eliminate contamination from slow drift of signals. Outlier scans corrupted by large motion were detected using the tool fsl_motion_outliers. This tool detects outliers if the root-mean-squared (RMS) intensity difference to reference volume exceeds the 75th percentile + 1.5 times the InterQuartile Range. The identified outliers were regressed out from the data with a GLM where each outlier was entered as a nuisance regressor. The mean percentage of detected outlier volumes per run was 5.5% (SD = 3.12%) for the whole dataset (alerting task, M = 6.6%, SD = 3.3%; orienting task, M = 4.3%, SD = 2.8%; executive attention task, M = 5.3%, SD = 2.8%). For each task, and even for the participant with the highest proportion of data removed (which was always lower than 20%), the BOLD signal of the minimum condition of interest was 11.5, 7.1, and 6.6 min for the alerting, orienting, and executive attention tasks, respectively. No spatial smoothing was applied as the functionnectome method has an analogous effect of improving the signal-to-noise ratio by combining the signal from distant yet structurally linked voxels (Nozais et al. 2021).
FunctionnectomeWe applied the functionnectome over the preprocessed data (Fig. 1.III; for a detailed description of the method see Nozais et al. 2021). This method projects the signal from each voxel of the fMRI 4D volume to the white matter according to their structural relationships. These structural relationships were based on a probability map that is composed by the structural connectivity between a given voxel and the rest of the brain. This map is derived from a normative high-resolution tractography acquired at 7T in 100 subjects from the preprocessed version of the human connectome project (raw data openly available at www.humanconnectome.org and preprocessed tractographies at https://osf.io/5zqwg/). This process generates a new 4D volume projecting the fMRI signal from grey matter voxels to the white matter, weighted by the probability of connection. This new 4D volume can be statistically analyzed similarly to a classical fMRI volume. The functionnectome is open-source software available at http://www.bcblab.com.
fMRI analysisfMRI analysis and results inspection steps are briefly illustrated in Fig. 1.IV and V. Statistical analyses were performed for each individual run using the general linear model (GLM). Task regressors were convolved with the FSL double-gamma function. For the three attentional tasks, fMRI trials were sorted as “seen” or “unseen” according to participants’ subjective responses. For the alerting task, we used a model including the three phases of the fMRI trial: cue presentation, target presentation (including the objective response), and subjective response. The cue presentation period was modeled as 6 regressors of interest including tone seen, tone unseen, no tone seen, no tone unseen, target-absent tone, and target-absent no tone trials. Missed responses and errors were modeled but not included in the analysisFootnote 1. The contrast of interest for this task was defined as Tone > No tone trials.
For the orienting task, we used a GLM including the three phases of the fMRI trial: cue presentation, target presentation (including the objective response), and subjective response. The cue presentation period was modeled as 4 regressors of interest including valid seen, valid unseen, invalid seen, and invalid unseen trials. Missed responses, errors, and target absent trials were modeled but not included in the analysis. The contrast of interest for this task was defined as Cue trials > Null. Null consisted of the unmodeled periods (i.e., Jitter fixation). Cue trials included all cue periods (independently of their validity in relation to target location). Note that during the cue period the target had not yet appeared and therefore it was not possible to distinguish between valid and invalid cues.
For the executive attention task, we used a GLM including the three phases of the fMRI trial: stimuli presentation (color word and target), Stroop response, and subjective response. The stimuli presentation period was modeled as 4 variables of interest including congruent seen, congruent unseen, incongruent seen, and incongruent unseen trials. Missed responses, errors, and target absent trials were modeled but not included in the analysis. The contrast of interest for this task was defined as Incongruent > Congruent trials.
For the three tasks, to prevent motion artifacts, six head motion parameters and outlier scans were entered as regressors of no interest in all first-level analyses. Intra-subject brain activations of the contrast of interest were calculated using fixed effects. Higher-level mixed-effects were carried out using FLAME 1 (Woolrich et al. 2004), and Z-statistic BOLD images were rendered using a cluster-defining Z-threshold of > 2.3 and a corrected cluster significance threshold of p = 0.05.
For all contrasts of interest, we reported the Montreal Neurological Institute (MNI) coordinates of the local maxima of the grey matter regions showing significant activations inside a larger cluster. To identify and report white matter tracts involved in each attentional task, we created a mask per each of the 42 tracts included in the XTRACT probabilistic tract atlas (Warrington et al. 2020), plus the corpus callosum (genu, body, and splenium) from the JHU ICBM-DTI-81 atlas (Mori et al. 2005). These masks were applied to the contrast images to calculate the number and percentage (total number of significant voxels divided by the number of voxels of the tract mask) of voxels and the local maxima of the brain activations overlaid by the tract mask. We considered those tracts with a total number of voxels of overlap greater than the 1% of the total number of voxels of the contrast images of each experiment (i.e., alerting: 195 voxels; orienting: 57 voxels; executive attention: 645 voxels). In addition, we considered tracts where a tract mask overlapped less than 1% of the total significant voxels of the contrast but the percentage of overlap with the tract mask was greater than 25% of the tract.
In order to examine the association between brain activations and the use of attentional signals, we correlated the whole-brain contrast of interest for each task with a relevant behavioral index using a voxel-wise approach. Results were obtained using FLAME 1 and a Z-threshold of > 2.3 with a corrected cluster significance threshold of p = 0.05. For the alerting task, we calculated this index by subtracting the reaction time (RT) of the no tone minus the tone condition; for the orienting task, we subtracted the RT of the invalid minus the valid condition; for the executive attention task, we subtracted the RT of the incongruent minus the congruent condition. Note that the RT for the alerting and orienting tasks was calculated by the objective response to the target, while for the executive attention task the RT was calculated by the response to the Stroop word. These behavioral indices were expected to be positive on average (as slower RTs are expected in the no tone, invalid, and incongruent conditions) and higher values would indicate better use of the attentional signals (for alerting and orienting tasks) or higher impairment due to overload of the executive attention system (for the executive attention task). To calculate the effect size of the correlations between the brain signal and each behavioral index, we extracted the mean value from each significant cluster and performed a Pearson correlation analysis.
留言 (0)