
記住我

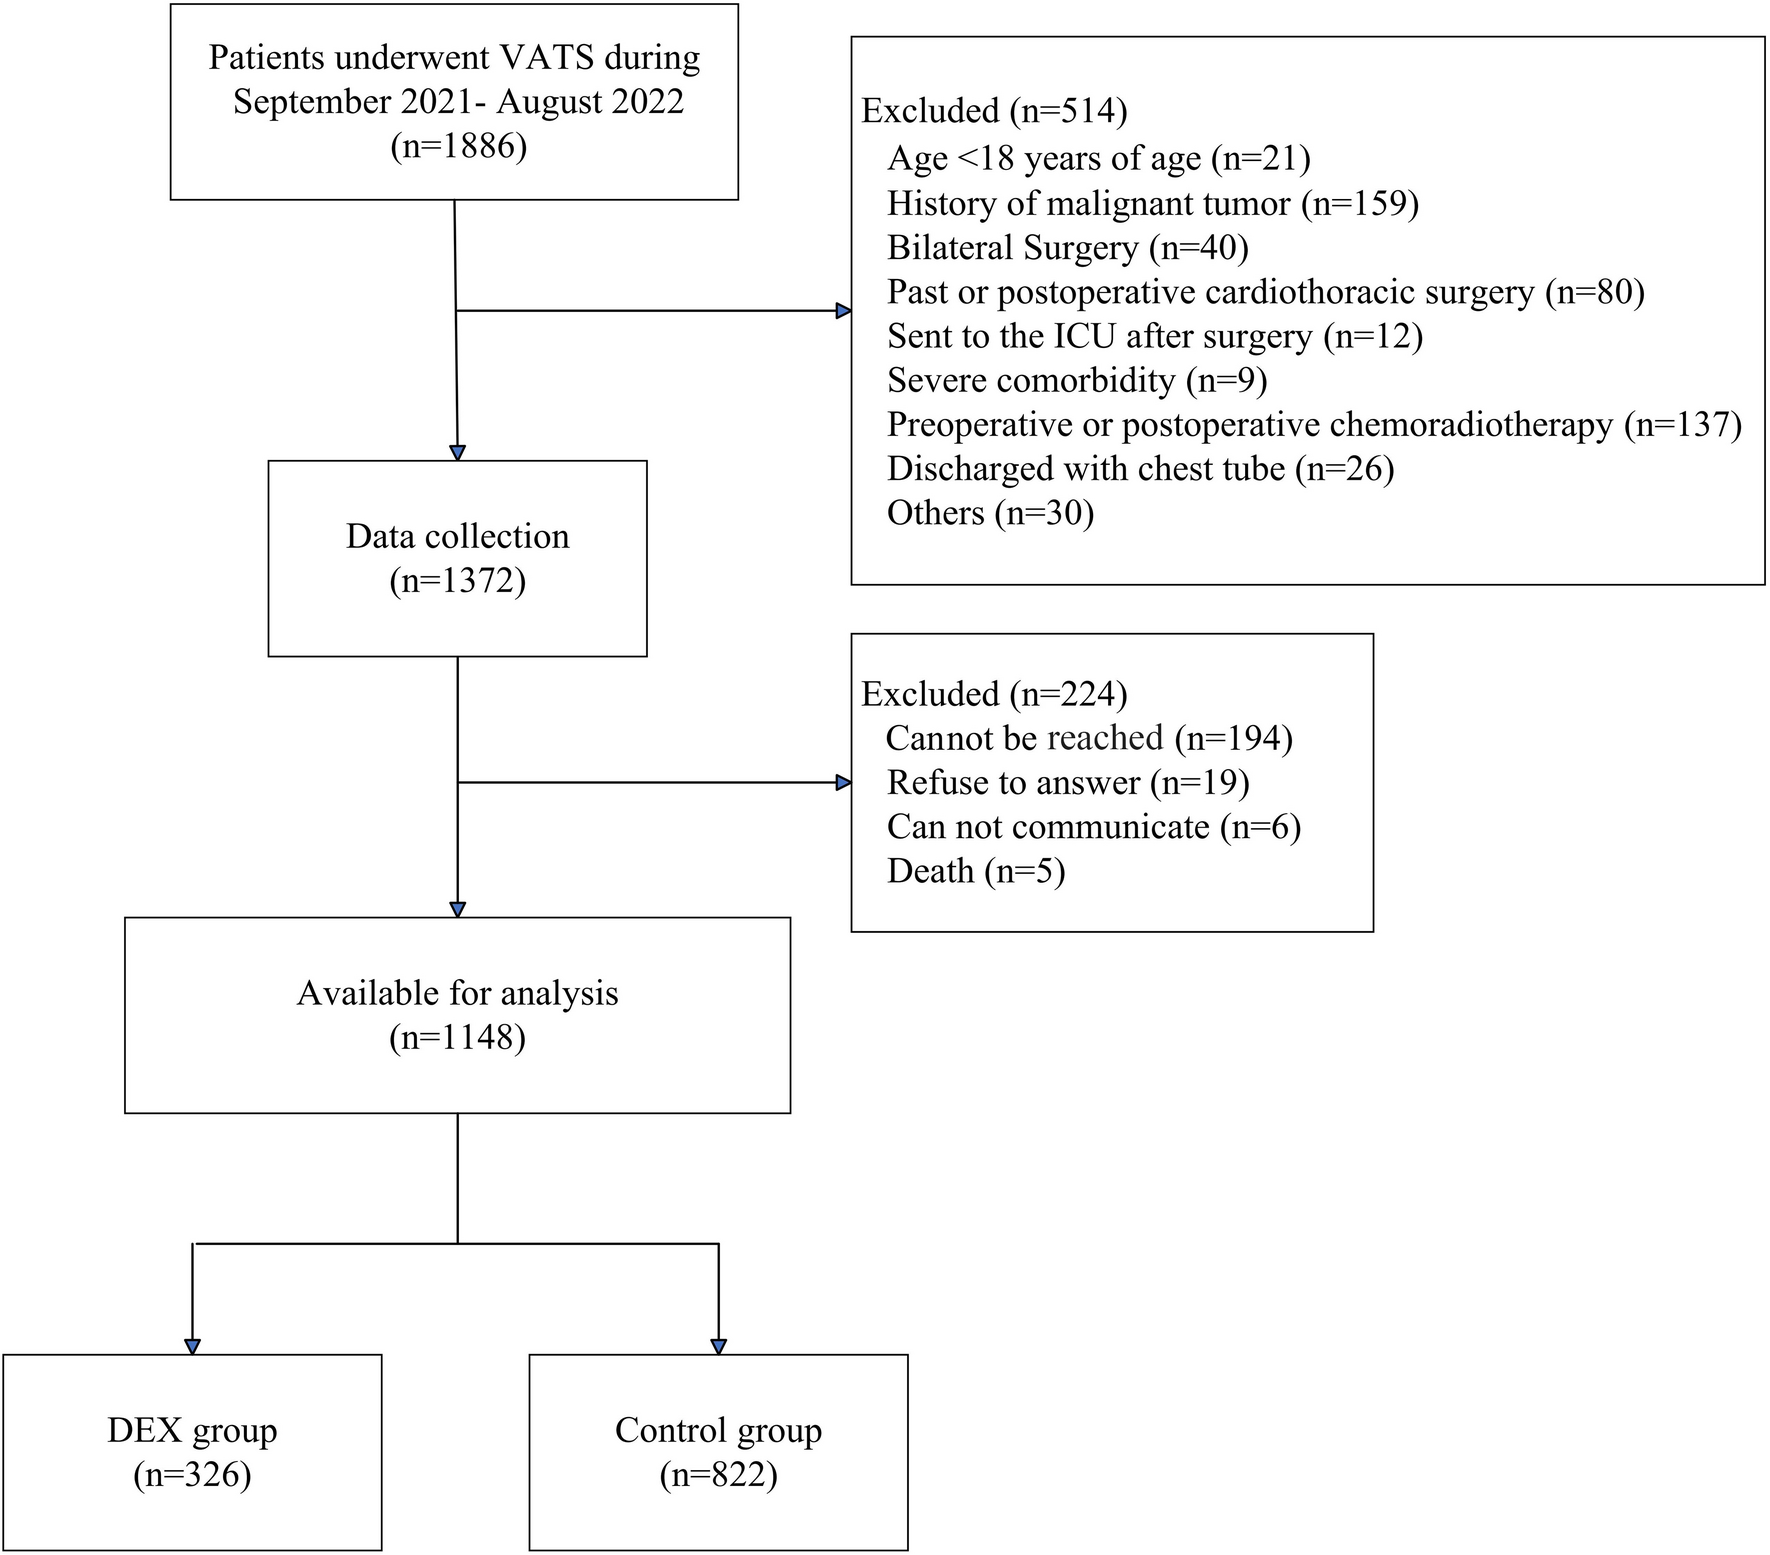


The patient disposition is shown in Fig. 1. Among the 114 patients with CPSP in the overall study who were assessed for eligibility, 94 were enrolled and included in the current analysis. Of the 20 patients excluded, the most common reason for exclusion was screening failure (n = 13). Seventy-nine patients (84.0%) completed the 52-week study, and the main reason for discontinuation was TEAEs (n = 12, 12.8%).
Fig. 1
Patient disposition. TEAE treatment-emergent adverse event
The patient baseline characteristics are shown in Table 1 and Table S1 in the electronic supplementary material. All patients were Japanese, the mean (SD) age was 65.3 (11.1) years, and 54/94 (57.4%) patients were ≥ 65 years old. The mean (SD) VAS at baseline was 71.0 (15.1) mm and the mean CrCL was 72.7 (26.0) mL/min. The proportion of patients with motor weakness was 55.3%. The thalamus was the most common stroke location (n = 43, 45.7%), followed by the putamen (n = 20, 21.3%), brainstem (n = 16, 17.0%), and other (n = 15, 16.0%). Forty-six patients had an ischemic stroke (48.9%), and 48 had a hemorrhagic stroke (51.1%). There were some differences in characteristics between patients with ischemic stroke and those with hemorrhagic stroke, e.g., male ratio (84.8% and 56.3%) and motor weakness (32.6% and 77.1%), respectively. A higher proportion of patients with the putamen as the stroke location had motor weakness compared with the brainstem (75.0% and 37.5%). The baseline SF-MPQ VAS values (SD) were slightly higher in patients with ischemic vs hemorrhagic stroke (65.6 [13.0] mm vs 76.2 [15.1] mm) and in patients with motor weakness vs those without (75.5 [14.7] mm vs 65.5 [13.7] mm). Baseline SF-MPQ VAS scores were similar among patients with different stroke locations, post-stroke duration, and CPSP duration.
Table 1 Patient background characteristicsEfficacyThe SF-MPQ VAS scores are shown in Table 2 and Fig. 2, and further details are provided in Table S2 and Fig. S1 in the electronic supplementary material. Overall and in each subgroup, the mean SF-MPQ VAS scores initially decreased after mirogabalin treatment until week 8 (Fig. 2 and Fig. S1 in the electronic supplementary material). The scores then remained stable until week 48, whereafter an increase occurred between weeks 48 and 52, which included the 1-week taper period (weeks 51–52). The LS mean [95% CI] in SF-MPQ VAS score from baseline at week 52 (LOCF) was − 17.0 [− 22.1, − 11.9] mm (Fig. 2d). The LS mean [95% CI] changes from baseline at week 52 (LOCF) for the subgroups were − 17.8 [− 25.7, − 10.0] (ischemic stroke), − 16.1 [− 23.0, − 9.3] (hemorrhagic stroke), − 16.0 [− 23.4, − 8.5] (stroke location: thalamus), − 25.2 [− 39.2, − 11.2] (stroke location, putamen), − 15.5 [− 25.4, − 5.6] (stroke location, brainstem), − 10.5 [− 24.6, 3.6] (stroke location, other), − 16.8 [− 23.6, − 10.0] (with motor weakness), and − 17.2 [− 25.3, − 9.1] (without motor weakness). Patients with ≥ 59 and < 59 months since stroke onset had LS mean [95% CI] changes from baseline at week 52 (LOCF) of − 20.4 [− 27.4, − 13.3] and − 13.0 [− 20.5, − 5.4], respectively, and patients with a CPSP duration of ≥ 55.5 and < 55.5 months had LS mean [95% CI] changes from baseline at week 52 (LOCF) of − 20.6 [− 28.0, − 13.1] and − 13.4 [− 20.5, − 6.2], respectively. Among all subgroups, SF-MPQ VAS scores improved from baseline throughout the 52-week study period or at week 52 (LOCF) (Fig. 2, Fig. S1a, b).
Table 2 Short-form McGill Pain Questionnaire visual analog scale scores and changes from baselineFig. 2

SF-MPQ VAS scores by patient group. Data are arithmetic mean (SD), except where otherwise stated. SF-MPQ VAS scores by a type of stroke, b stroke location, c presence or absence of motor weakness, and d LS mean change [95% CI] from baseline at week 52 (LOCF). CI confidence interval, CPSP central post-stroke pain, LOCF last observation carried forward, LS least squares, SD standard deviation, SF-MPQ short-form McGill Pain Questionnaire, VAS visual analog scale
The SF-MPQ total scores and subscale scores are shown in Table 3, Fig. 3, and Table S3 in the electronic supplementary material. The overall LS mean [95% CI] changes from baseline at week 52 (LOCF) in the sensory score, affective score, total score, and present pain intensity score were − 3.6 [− 4.7, − 2.4], − 1.5 [− 2.0, − 1.0], − 5.1 [− 6.6, − 3.5], and − 0.8 [− 1.1, − 0.6], respectively (Fig. 3). Regarding the sensory score, affective score, total score, and present pain intensity score of the SF-MPQ, the LS mean changes improved from baseline at week 52 (LOCF) among all subgroups (Fig. 3).
Table 3 Short-form McGill Pain Questionnaire subscale scores and changes from baselineFig. 3

Change from baseline in SF-MPQ subscale and total scores at week 52 (LOCF). Data are LS mean [95% CI]. The panels show a SF-MPQ sensory scores, b SF-MPQ affective scores, c SF-MPQ total scores, and d SF-MPQ present pain intensity scores. CI confidence interval, CPSP central post-stroke pain, LOCF last observation carried forward, LS least squares, SF-MPQ short-form McGill Pain Questionnaire
The SF-MPQ subscale scores were not notably different between ischemic and hemorrhagic stroke groups (LS mean [95% CI] change from baseline at week 52 (LOCF): sensory score, − 2.7 [− 4.4, − 0.9] vs − 4.4 [− 6.1, − 2.8]; affective score, − 1.3 [− 1.9, − 0.7] vs − 1.6 [− 2.4, − 0.9]; total score, − 4.0 [− 6.3, − 1.7] vs − 6.1 [− 8.3, − 3.8]; and present pain intensity score, − 0.7 [− 1.1, 0.4] vs − 0.9 [− 1.2, − 0.6]).
Regarding stroke location, the SF-MPQ subscale scores in the stroke locations of thalamus, putamen, and brainstem were as follows: sensory score, − 3.7 [− 5.1, − 2.2], − 5.0 [− 7.8, − 2.2], − 2.3 [− 5.5, 0.9], respectively; affective score, − 1.7 [− 2.3, − 1.1], − 1.4 [− 2.6, − 0.2], − 1.5 [− 2.8, − 0.2], respectively; total score, − 5.4 [− 7.2, − 3.5], − 6.4 [− 10.2, − 2.6], − 3.8 [− 8.2, 0.6], respectively; and present pain intensity score, − 0.9 [− 1.3, − 0.6], − 0.9 [− 1.2, − 0.5], − 0.4 [− 1.1, 0.2], respectively.
The SF-MPQ subscale scores in patients with and without motor weakness were similar: sensory score, − 4.3 [− 5.8, − 2.8] vs − 2.7 [− 4.6, − 0.7]; affective score, − 1.7 [− 2.4, − 1.0] vs − 1.3 [− 1.9, − 0.6]; total score, − 6.0 [− 8.0, − 3.9] vs − 3.9 [− 6.5, − 1.4]; and present pain intensity score − 1.0 [− 1.3, − 0.7] vs − 0.6 [− 1.0, − 0.3].
SafetyThe incidence of TEAEs was 87.2%, with a similar incidence observed among subgroups (Tables 4 and S4). The most common TEAEs were somnolence, peripheral edema, nasopharyngitis, and dizziness, and most TEAEs were mild or moderate. Peripheral edema was more common in patients with ischemic stroke than patients with hemorrhagic stroke, and less common in patients with the putamen as the stroke location than patients with stroke occurring in the thalamus or brainstem, and less common in patients with motor weakness than those without motor weakness.
Table 4 Treatment-emergent adverse events occurring in ≥ 5% of patientsSevere TEAEs occurred in 6 patients (6.4%), including cerebral hemorrhage (n = 2, 2.1%), cerebral infarction (n = 1, 1.1%), spinal compression fracture (n = 1, 1.1%), cholecystitis acute (n = 1, 1.1%), and hyperkalemia (n = 1, 1.1%); none of these events were considered related to mirogabalin treatment.
ADRs are shown in Table 5 and Table S5 in the electronic supplementary material. Among all patients, the proportion with at least one ADR was 54.3%, and the most common ADRs were somnolence (25.5%), peripheral edema (13.8%), dizziness (11.7%), and weight gain (6.4%). No severe ADRs were reported, and similar types and frequencies of ADRs were observed among the subgroups.
Table 5 Adverse drug reactions in patients with central post-stroke pain treated with mirogabalin
留言 (0)