Care and maintenance of animals
All in vivo experiments were approved and performed in strict accordance with the guidelines of the Institutional Animal Care and Use Committee of SYSUCC and Guangzhou Women and Children's Medical Center, Guangzhou Medical University. BALB/c nude mice, aged 3–4 weeks, were procured from Vital River Laboratory Animal Technology Co. Ltd. (China). Additionally, 4–5-week-old male NCG mice (NOD/ShiLtJGpt-Prkdc^em26Cd52Il2rg^em26Cd22/Gpt) were acquired from GemPharmatech Co. Ltd. (China) and maintained in a sterile, pathogen-free environment. To establish the patient-derived xenograft (PDX) model, male NCG mice of 4–5 weeks were engrafted subrenally with primary cells obtained from fresh human Wilms tumor tissue specimens. For the orthotopic rescue assays, sub-capsular injections were performed using cells that had been stably transfected with either a negative control, shRNA, or a circMARK2 overexpression plasmid, with a density of 1 × 10⁵ cells in a 5 μL volume per mouse. Each experimental group comprised five mice, which were randomly assigned. Imaging was executed using the Xenogen IVIS Lumina system, and lung tissues were harvested for hematoxylin and eosin (H&E) staining. In experiments designed to assess the impact of C-SLN nanoparticles (NPs) and circMARK2 knockdown, a sub-capsular WT model was established. Three weeks post-implantation, 15 nude mice were randomly divided into three groups to receive treatments via tail vein injection: naked siRNA, C-SLN NPs, or C-SLN NPs coupled with siRNA. Each mouse received a total dose of 4 μg of siRNA, administered twice weekly over a three-week period. The sample size was determined based on prior empirical knowledge and relevant literature for the specific experiments conducted. No formal sample size calculation was employed. Animals were allocated to different groups using a randomization method; they were first numbered according to body weight, followed by a random number table to assign them to experimental cohorts. Throughout the study, all data was included in the analyses without any exclusion, and the experiment was not blinded.
WT patient samples
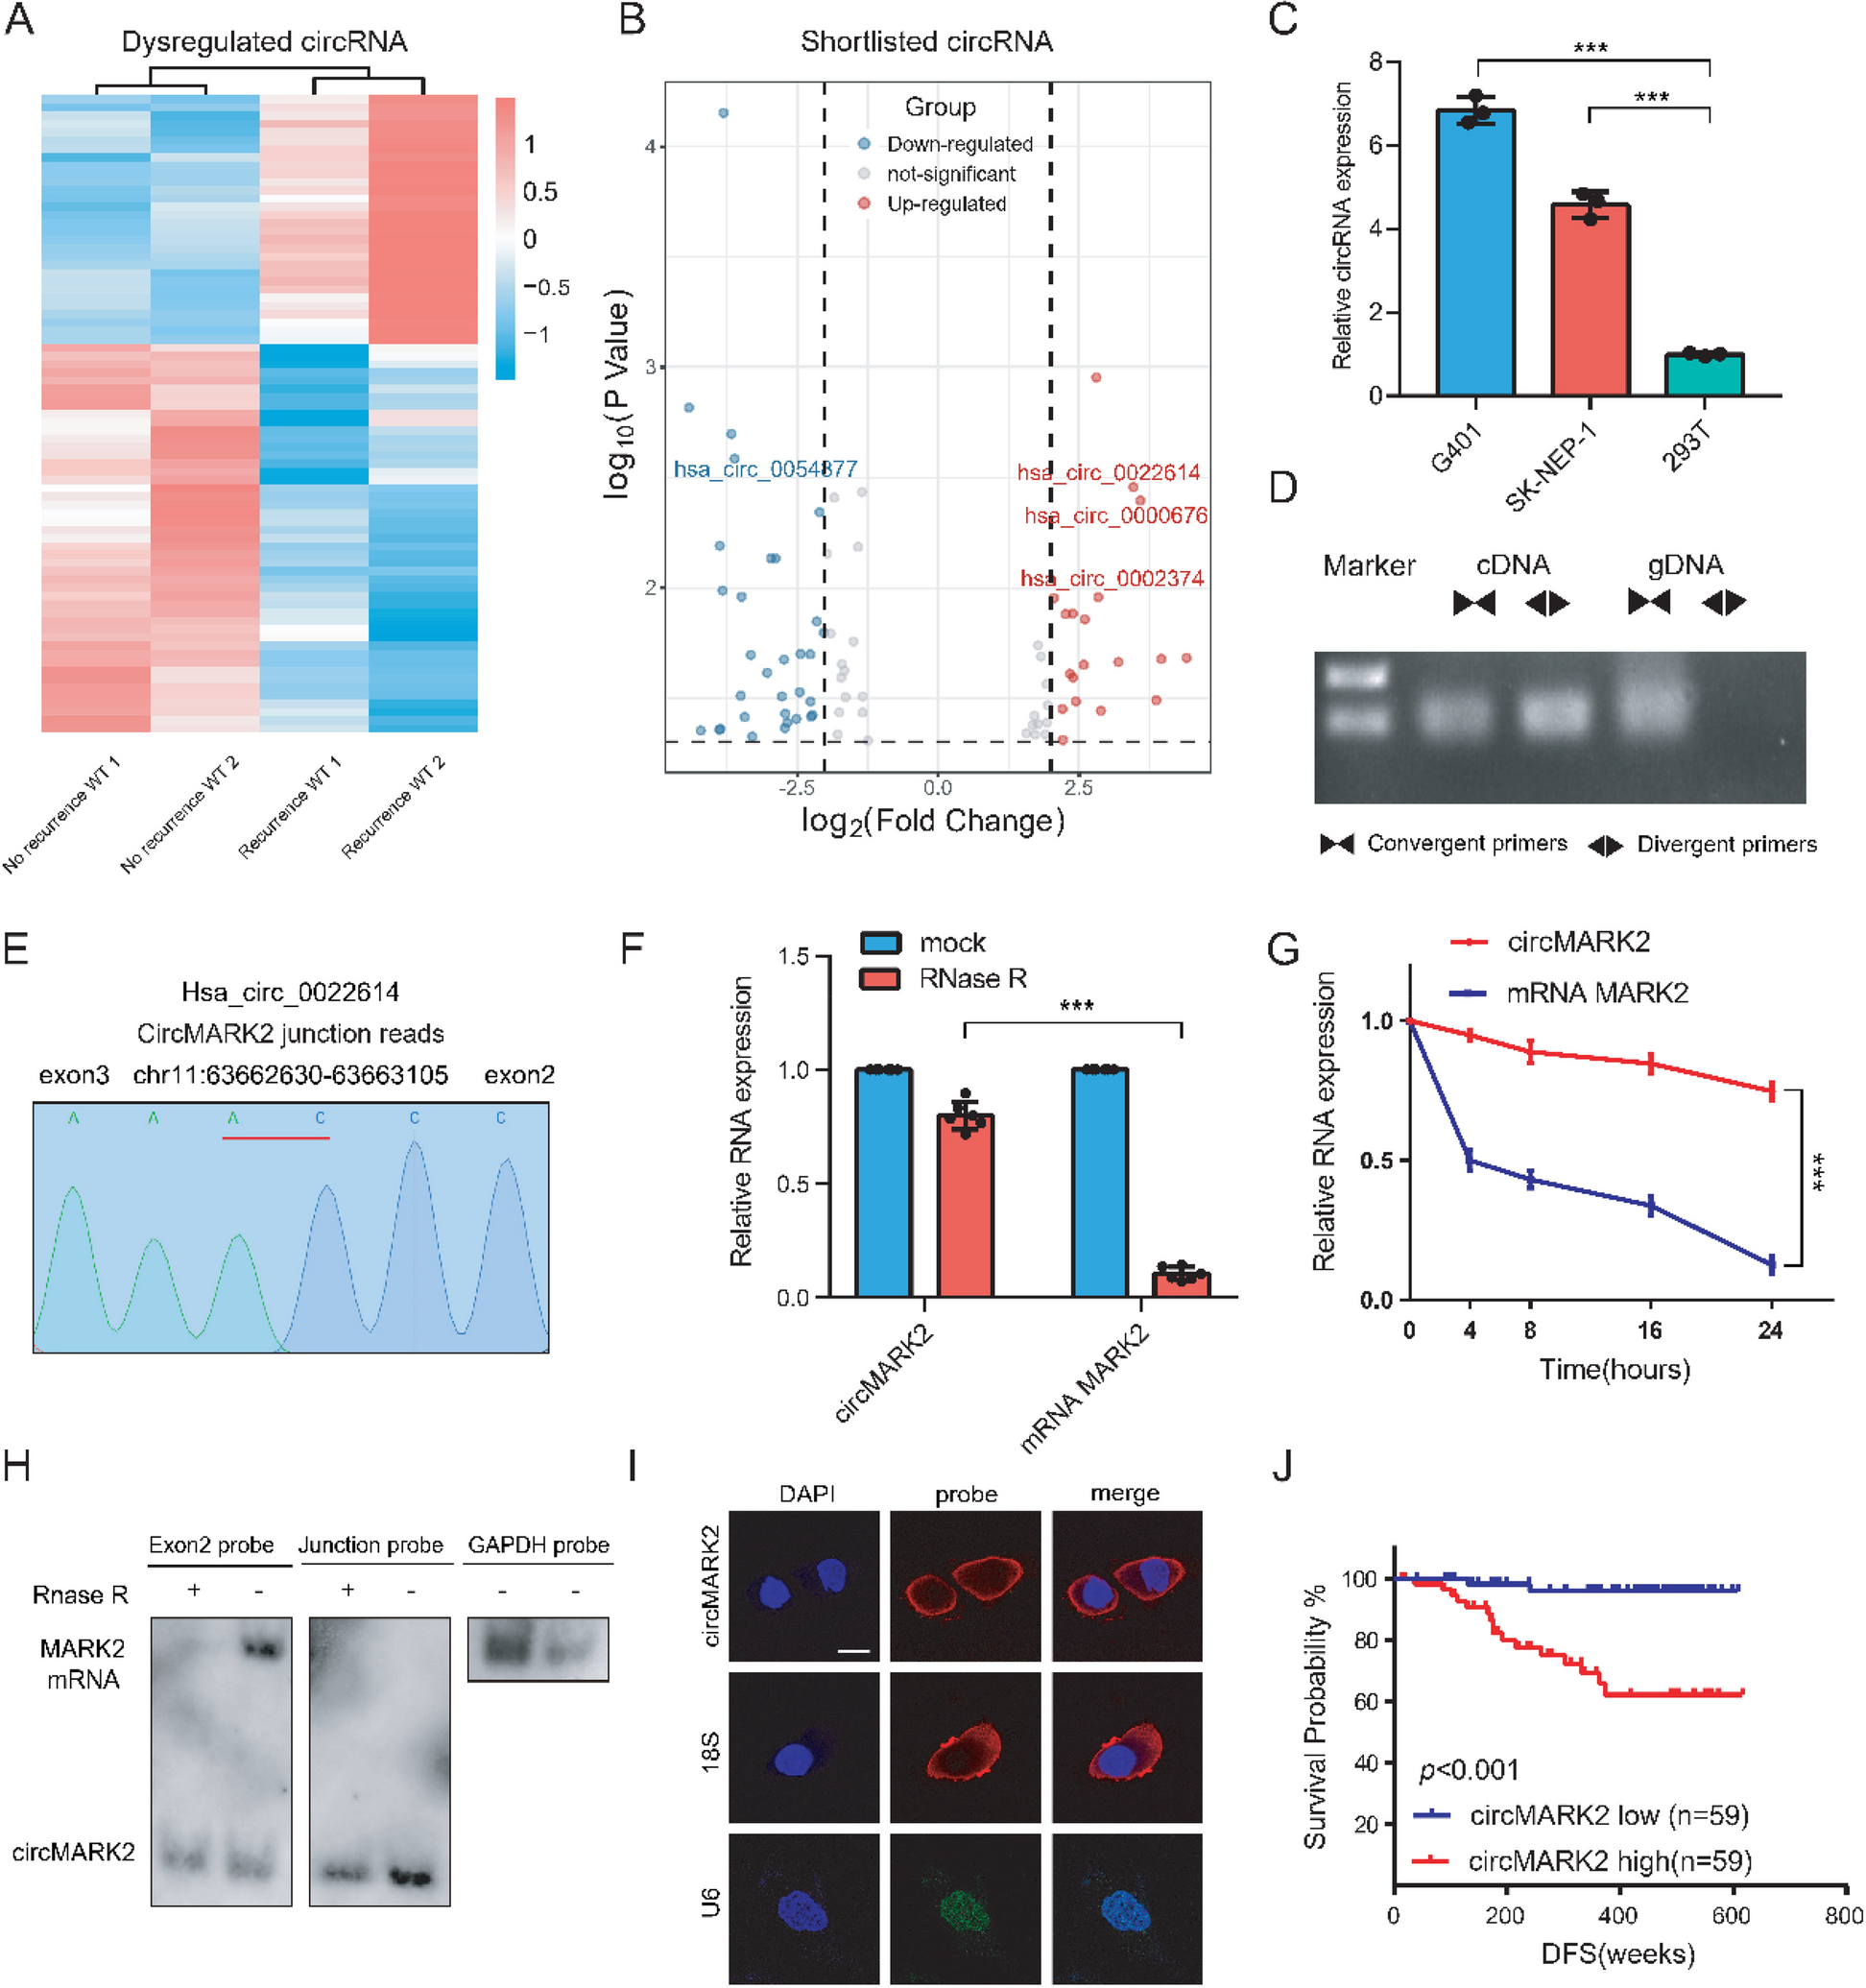
For circRNA expression sequencing, clinical samples were obtained from two pediatric patients exhibiting recurrence and two without recurrence. Each of these patients, aged below two years, presented with Stage I disease and had tumors weighing under 550 g, classified as having a favorable prognosis. Notably, these tumors did not demonstrate loss of heterozygosity at the 1p/16q loci. None of the four patients received preoperative or postoperative radiotherapy or chemotherapy.
For circRNA expression profiling, we obtained 118 paired pathologically diagnosed WT tumor samples from Guangzhou Women and Children's Medical Center and The First Affiliated Hospital of Sun Yat-sen University. Corresponding adjacent noncancerous tissues were acquired approximately ≥ 5 mm away from the tumor site. The clinical features of the WT patients are summarized in Table S1. Regular follow-up was carried out and DFS was determined from the date of surgery to the date of the first evidence of clinical recurrence. Samples used in this study were approved by the Medical Ethics Committee of Guangzhou Women and Children's Medical Center. The informed consent of each patient was obtained.
Cell lines and cell culture
Human Wilms tumor (WT) cell lines G401 and SK-NEP-1, along with the human embryonic kidney cell line HEK-293 T, were procured from the Cell Bank of the Chinese Academy of Sciences. The WT cell lines, including patient-derived primary cells, were maintained in McCoy's medium (Gibco, China), while HEK-293 T cells were cultured in Dulbecco's Modified Eagle Medium (DMEM) (Gibco, China). Both media were fortified with 10% fetal bovine serum (FBS) (PAN-Seratech, Germany) and 1% penicillin–streptomycin (Biosharp, China). The cell cultures were incubated at 37°C in a humidified atmosphere containing 5% CO2. To ensure authenticity and purity, all cell lines underwent short tandem repeat DNA profiling and were routinely screened for mycoplasma contamination, with all tests returning negative results. The cell lines were used for experiments within two months of culture to maintain their physiological relevance.
Bioinformatics analysis
Data analysis in this study was conducted using R (version 3.4.3), available at https://www.r-project.org/. For the determination of circMARK2's secondary structures, we utilized Mfold (version 2.3). The three-dimensional (3D) structure of circMARK2 was generated using RNA Composer. Molecular docking procedures were performed using the NPDock web server. The 3D crystal structures of protein domains referenced in this study were sourced from the Protein Data Bank. To visualize the docking models and to determine the contact distances between atoms, Discover Studio software was employed.
RNA interference (RNAi) and transfection
Transient transfection of circMARK2 was carried out using two distinct siRNAs, along with a scrambled siRNA serving as a negative control, all of which were synthesized by RiboBio (China). The siRNAs were introduced into Wilms tumor (WT) cells employing RNAiMAX transfection reagent (Invitrogen, USA), following the manufacturer’s protocol. Functional assays to evaluate the impact of transfection were conducted 48 h post-transfection. Additionally, lentiviral vectors for the knockdown of circMARK2, as well as their corresponding negative controls, were sourced and quality-verified from Genechem (China).
Plasmid construction
For the circMARK2 over-expression plasmids, circMARK2 cDNA was synthesized and cloned into a pLC5-ciR vector (Geneseed, China). An empty vector served as negative control. Flag-IGF2BP2 WT and truncated plasmids, truncated circMARK2, Flag-HNRNPC WT and mutant plasmids were obtained from Genecreate (China). Plasmids were transfected using Lipofectamine 3000 (Invitrogen, USA), according to the manufacturer’s instructions. In vivo bioluminescence imaging was conducted following the injection of cells transfected with vectors containing Gaussia luciferase (Gluc).
RNA quantitative real-time polymerase chain reaction
Total RNA was extracted utilizing TRIzol reagent (Invitrogen, USA) and quantified using the NanoDrop 2000 spectrophotometer (Thermo Fisher Scientific, USA). For reverse transcription of RNA, PrimeScript RT Master Mix (Takara, China) was employed. Quantitative real-time polymerase chain reaction (qRT-PCR) was performed using SYBR Green SuperMix (Roche, Basel, Switzerland) on a LightCycler 480 system (Roche, Basel, Switzerland). The expression levels of circRNAs and mRNAs were analyzed using the 2−ΔΔCt method. β-actin and U3 were applied as controls in the cytoplasm and nucleus, respectively.
Western blot
Cellular lysates were prepared using a lysis buffer supplemented with proteinase inhibitor (Beyotime, China) for cells cultured in dishes. The lysates were subjected to incubation on ice for 15 min, followed by centrifugation at 12,000 g at 4°C for another 15 min. Post-centrifugation, supernatants were collected, and protein concentrations were quantified using the BCA Protein Assay Kit (Thermo Fisher Scientific, USA). For electrophoresis, equal amounts of protein samples were loaded onto 10% SDS-PAGE gels, followed by protein transfer onto PVDF membranes. These membranes were blocked with nonfat milk for 1 h at room temperature and then incubated overnight at 4°C with primary antibodies. This was followed by a 1-h room temperature incubation with secondary antibodies. Detection of hybridizations was conducted using high-signal ECL Western Blotting Substrate (Tanon, China) and visualized on a ChemiDoc Touch Imaging System (BIO-RAD, USA). The primary antibodies used for Western blotting included IGF2BP2 (1:1000 dilution, 11601–1-AP, Proteintech, China), LIN28B (1:2000 dilution, ab191881, Abcam, USA), HNRNPC (1:1000 dilution, sc-32308, Santa Cruz Biotechnology, USA), GAPDH (1:1000 dilution, 5174, Cell Signaling, USA), anti-Flag (1:1000 dilution, 8146, Cell Signaling), METTL3 (1:1000 dilution, ab195352, Abcam), and ALKBH5 (1:1000 dilution, ab195377, Abcam). HRP-conjugated secondary antibodies included goat anti-mouse (1:5000 dilution, Proteintech) and goat anti-rabbit antibody (1:5000 dilution, Proteintech).
Actinomycin D and RNase R treatment
Upon reaching 60% confluence in six-well plates, cells were treated with actinomycin D at a concentration of 5 μg/mL, or with DMSO as a control, and were then harvested at designated time points. Total RNA was subsequently subjected to treatment with 3 U/μg of RNase R (Epicentre Technologies, USA) for 15 min at 37 °C to degrade linear RNAs. Following this treatment, the expression levels of circMARK2 and various mRNAs were quantified using quantitative real-time polymerase chain reaction (qRT-PCR) to assess RNA stability.
Northern blotting
Custom RNA probes were synthesized by GenePharma (China) for Northern blotting, which was conducted using the NorthernMax Kit (Ambion, Life Technologies, USA) in accordance with the manufacturer’s guidelines. Total RNA, both untreated and treated with RNase R, was separated on a 2% agarose gel and subsequently transferred to a Hybond-N + membrane (GE Healthcare, Sweden) through capillary action. For hybridization, the membrane was incubated overnight at 58°C with biotin-labeled oligonucleotide probes. Detection of these biotin-labeled RNA probes was achieved using the Chemiluminescent Nucleic Acid Detection Module (Thermo Fisher Scientific, USA). GAPDH served as the internal control for these assays, ensuring the accuracy of RNA quantification.
Nuclear and cytoplasmic extraction
The PARIS Kit (Invitrogen) was used to separate nuclear and cytoplasmic lysates according to the manufacturer’s instructions. Briefly, cells were lysed in Cell Fraction Buffer on ice for 10 min. After centrifugation at 500 × g for 3 min at 4°C, the supernatant was collected as a cytoplasmic fraction. The nuclei were collected followed by washing the pellet with Cell Fraction Buffer.
Fluorescence in situ hybridization and immunohistochemistry
Oligonucleotide probes specific for circMARK2 and LIN28B mRNA were synthesized by GenePharma (China). For fluorescence in situ hybridization (FISH), paraffin-embedded tissue blocks were sectioned into 2.5-μm slices and affixed onto glass slides. FISH was performed on these tissue sections utilizing a FISH kit obtained from GenePharma (China), adhering strictly to the manufacturer's instructions. Imaging of the hybridized sections was carried out using an OLYMPUS FV1000 confocal microscope (Japan), and fluorescence intensity was quantitatively analyzed using ImageJ software. Pearson's correlation coefficient for colocalization studies was calculated using the OLYMPUS FV1000 software. In the immunohistochemistry (IHC) procedures, steps including deparaffinization, rehydration, antigen retrieval, and staining were methodically performed. The normal goat serum blocking buffer (no. ZLI-9056), Rabbit two-step kit (no. PV-6001), and DAB kit (no. ZLI-9017) used in these processes were sourced from ZSGB-BIO (China).
Immunofluorescence
Cells grown on a confocal dish (Corning, USA) were fixed with 4% paraformaldehyde in PBS for 15 min on ice and then permeabilized with 0.1% TritonX-100 for 10 min. Then, cells were washed twice with PBS and blocked with 5% BSA for 30 min at 37°C. Afterward, cells were incubated with primary antibody overnight at 4°C and washed with PBS. The secondary antibody was incubated for 30 min at 37°C, followed by staining with DAPI for nucleus staining. Fluorescent images were taken with OLYMPUS FV1000 confocal microscopy. Fluorescence densities were analyzed by ImageJ. Correlation analysis was carried out with GraphPad Prism 7 software.
Transwell assays
Cells were starved for 8 h in serum-free medium. Then, cells were collected, resuspended in serum-free medium, and added to Transwell inserts (Corning, USA). Medium containing 10% FBS was added to the bottom chamber. After incubation for 6–12 h, the migrated cells in lower filters were fixed with 4% polyformaldehyde (Beyotime, China), and stained with 0.4% crystal violet (Beyotime, China) for 20 min. Migrated cells were calculated by capturing five random fields under an Olympus IX83 inverted microscope (Japan). All experiments were performed in triplicate.
RNA pull-down assays
The biotin-labeled RNA complex was isolated from cell lysates using streptavidin-coated magnetic beads (Invitrogen, Carlsbad, USA). This RNA pull-down procedure was conducted utilizing the Pierce Magnetic RNA–Protein Pull-Down Kit (Thermo Scientific, USA), in strict accordance with the provided manufacturer’s protocol. The presence of target transcripts in the captured fractions was subsequently quantified via quantitative real-time polymerase chain reaction (qRT-PCR). Proteins bound to the biotinylated RNA were then eluted from the beads and subjected to SDS-PAGE analysis. The proteins in the capture complex were identified by western blotting or silver staining or mass spectrometry analysis.
Silver staining and mass spectrometry analysis
Silver staining was performed with a Fast Silver Stain Kit (Beyotime, China). The targeted region of gel was cut off and saved in microcentrifuge tubes. MS analysis was provided by BGI (Shenzhen, China). A protein presented exclusively in circMARK2 compared to controls, with unique peptides > 2 was considered significant.
Immunoprecipitation of RNA-binding proteins
RIP was carried out using an EZ-Magna RIP Kit (Millipore, USA) according to the manufacturer's instructions. The m6A RIP assay was carried out using a Magna MeRIP m6A Kit (Millipore) according to manufacturer's instructions. The rRNAs were removed from the total RNA before the specific enrichment. Five micrograms of IgG, anti-HNRNPC antibody (sc-32308, Santa Cruz Biotechnology) and anti-m6A antibody (202003, Synaptic Systems) were used for each sample. The precipitated RNAs were examined through qRT-PCR analyses. The bounded proteins were further confirmed by western blotting.
Docking simulations, contact maps, and identification of binding site residues
NPDOCK Server was used to determine the possible interaction of circMARK2 with IGF2BP2 and HNRNPC. NPDOCK Server combines GRAMM for global macromolecular docking, scoring with a statistical potential, clustering, followed by refinement of best-scored docked complexes from the three largest clusters. A distance-based approach was used to identify the binding site residues/nucleotides for protein-RNA complexes using a specific cutoff value determined by Discovery Studio.
Electrophoretic mobility shift assay
Biotin-labeled RNA oligonucleotides were obtained from Umine Biotechnology (Guangzhou, China). The RNA Electrophoretic mobility shift assay (EMSA) was carried out using LightShift™ Chemiluminescent RNA EMSA Kit (Thermo Fisher Scientific, USA), according to the manufacturer’s instructions. Purified proteins were purchased from Origene (USA). For supershift assays, recombinant proteins were pre-incubated with antibodies at 0°C for 20 min followed by the addition of the labeled probe.
Luciferase reporter assay
The target sequence was cloned separately downstream of the pmirGLO dual luciferase vector (Genecreate, China). Mutations were inserted at the binding sites. Cells were seeded in 24-well plates and transfected with a mixture of pmirGLO dual-luciferase reporter and siRNA at the same time. After 48 h, the relative luciferase activity was measured as the ratio between Firefly and Renilla luciferase activities with a Dual-luciferase Reporter Assay System (Promega, USA). Renilla luciferase activity was used as an internal control. The relative Luc/Rluc ratio was further normalized to that of the control sample in the circMARK2 knockdown or overexpression group.
Polysome analysis
Approximately 1.5 × 10⁷ cells were incubated in complete medium supplemented with 100 mg/mL cycloheximide (CHX) at 37°C for 10 min prior to cell lysis. Following incubation, the cells were harvested and centrifuged at 1000 × g for 5 min at 4°C. The supernatant was then discarded, and cells were lysed in 500 mL of a specially prepared buffer containing 300 mmol/L NaCl, 20 mmol/L Tris–HCl (pH 7.4), 10 mmol/L MgCl2, 1% Triton X-100, 1 mmol/L 1,4-dithiothreitol, 100 mg/mL CHX, 0.5% (w/v) sodium deoxycholate, an EDTA-free protease inhibitor cocktail, and RNase inhibitor. The lysed samples were kept on ice for 10 min. Subsequently, these were centrifuged at 13,000 × g for 5 min at 4°C, and the supernatants were collected for RNA concentration measurements. Sucrose gradient separation was prepared using 5% and 50% sucrose solutions, each containing 100 mg/mL CHX, in a Gradient Master 108 (Biocomp). Equal volumes of cell extracts were layered atop each gradient in ultracentrifuge tubes (Beckman Coulter). The tubes were then centrifuged using a SW41 rotor in a Beckman Coulter Optima™ L-100XP ultracentrifuge at 39,000 rpm for 120 min at 4°C. From these ultracentrifuged tubes, twelve distinct fractions were collected using a Piston Gradient Fractinator (Biocomp). RNA from each fraction was extracted using TRIzol reagent (Invitrogen), and following reverse transcription, quantitative real-time PCR (qRT-PCR) analyses were conducted.
Statistical analysis
Statistical analyses in our study were conducted using GraphPad Prism 7 software and R software (version 3.4.3), available at https://www.r-project.org/. All experimental procedures were replicated a minimum of three times, with data from a representative experiment presented. Results were expressed as mean ± standard deviation (S.D.). Statistical comparisons among or between groups were carried out using one-way analysis of variance (ANOVA) or independent samples two-tailed Student's t-test. Disease-free survival rates were analyzed via Kaplan–Meier curves, and the Log-rank test was employed to ascertain statistical significance. The correlation between clinicopathological features and circMARK2 expression levels was assessed using the chi-square test. We also calculated the coefficient of variation for these analyses. Hazard ratios (HRs) for univariate and multivariate analyses were determined using Cox regression models. Statistical significance was established at P values less than 0.05, with specific levels indicated as follows: *P < 0.05, **P < 0.01, ***P < 0.001.


留言 (0)