
記住我


Antibiotic resistance poses a critical threat to animal and human health, food security, and global environments. These mainly “ESKAPE” pathogens (Enterococcus faecium, Staphylococcus aureus, Klebsiella pneumoniae, Acinetobacter baumannii, Pseudomonas aeruginosa, and Enterobacter spp.) possess the possibility to “escape” antibiotics and host immune and are responsible for the majority of hospital or public infections (Rice, 2008; Da Rosa et al., 2023). Among these “ESKAPE” pathogens, P. aeruginosa was considered a “critical” pathogen in the bacterial pathogens list of the World Health Organization (WHO), which emphasized the emergency for researching and developing novel antibacterial agents to cure P. aeruginosa infection (Tacconelli et al., 2018). The quorum sensing (QS) system of P. aeruginosa regulates the production of virulence factors and biofilm formation to adapt to diverse habitats causing chronic diseases and antibiotic resistance (Morita et al., 2014; Qin et al., 2014). QS is a bacterial cell-to-cell communication that is an extensive signaling in which diffusible signaling molecules are secreted into the environment and sensed until the density reaches the threshold by a homologous cellular receptor (Waters and Bassler, 2005; Asfahl et al., 2017). After binding to these signaling molecules, the receptor complex activates the transcription of target genes involved in processes of secreting virulence factors, biofilm formation, and drug resistance (Papenfort and Bassler, 2016; Smith and Schuster, 2022). Therefore, QS inhibition has already been considered a potent strategy for avoiding drug resistance to combat P. aeruginosa infections (Ji et al., 2023). Quorum sensing inhibitors (QSIs) can attenuate the production of virulence factors and inhibit biofilm formation of pathogens without affecting their growth, leading to avoidance of multidrug resistance, which has attracted extensive attention. Aminoglycosides and β-lactam agents are usually the first line to treat P. aeruginosa infections (Foulkes et al., 2022; Tamma et al., 2022). Combined with aminoglycoside antibiotics, hordenine as a typical QSI could downregulate genes involved in QS and biofilm formation to enhance the susceptibility of aminoglycosides against P. aeruginosa PAO1 biofilm formation (Zhou et al., 2018b). Therefore, the combination of the aminoglycoside antibiotics with a QSI may be more effective than antibiotics alone in curing infections caused by P. aeruginosa.
Natural products are one of the essential sources of QSIs. Endophytic fungi are an under-explored source of bioactive natural products, offering opportunities for the discovery of novel QSIs (Joo et al., 2021; Pellissier et al., 2021). Rajesh and Ravishankar Rai reported that the endophytic fungi Fusarium graminearum and Lasiodiplodia sp. isolated from Ventilago madraspatana Gaertn present anti-QS activity (Rajesh and Ravishankar Rai, 2013). 1-(4-Amino-2-hydroxyphenyl)ethanone isolated from the endophytic fungus Phomopsis liquidambari presents QSI activity against P. aeruginosa (Zhou et al., 2021). In addition, Koh et al. reported that Areca catechu L. fruit extracts inhibit QS in both Chromobacterium violaceum CV026 and P. aeruginosa PAO1 (Koh and Tham, 2011). Endophytes generate the same various metabolites including QSI with symbiotic plants (Meena et al., 2020). Actinomycin D isolated from an endophyte of Streptomyces cyaneochromogenes RC1 isolated from A. catechu L. is a novel P. aeruginosa QSI (Zeng et al., 2022). However, the QSIs in A. catechu L. endophytic fungus are not clear.
Previous reports suggested that the biofilm eradication of the combination of antibiotics and QSIs is better than that of antibiotics alone (Chanda et al., 2017; Zhou et al., 2018b). Resveratrol as a QSI can combine with aminoglycoside to strengthen the bactericidal effect of antibiotics on P. aeruginosa (Zhou et al., 2018a). Therefore, the present study aimed to find new QSI form A. catechu L. endophytic fungi, which are involved in the inhibition of QS-related virulence factors and biofilm formation of P. aeruginosa PAO1. The inhibition of biofilm formation and the eradication of mature biofilm treated with QSI combined with gentamycin or piperacillin were also investigated to increase the antibiotic sensitivity and decrease the pathogenicity of P. aeruginosa.
Materials and methodsBacterial strains and culture conditionC. violaceum CV026 and P. aeruginosa PAO1 were kindly acquired from Q.H. Gong (Ocean University of China). C. violaceum CV026 was cultured in Luria–Bertani (LB) broth at 28°C, 180 rpm, for 17 h to prepare overnight cultures. P. aeruginosa PAO1 was incubated in LB broth at 37°C, 180 rpm, for 20 h to prepare overnight cultures.
Isolation and extraction of endophytic fungusThe surface of the A. catechu L. fruits was disinfected with 75% (v/v) ethanol for 1 min, then soaked in 0.2% mercuric chloride solution for 10 min, and washed three times with sterilized water to remove the residual mercuric chloride (Li et al., 2016). The surface-sterilized samples were transferred onto a dried sterile filter paper to remove the liquid on the surface. After that, the fruits were cut into small lumps (approximately 1.0 × 1.0 cm). Subsequently, each lump was carefully settled on a potato dextrose agar (PDA) plate separately and incubated at 28°C for 15 d. During the incubation period, the samples were observed every day, and every newly emerged fungal spot was immediately picked out and carefully transferred to another fresh PDA plate. After incubation, the resulting fungal strains were further purified and then maintained at 4°C (Supplementary Figure S1). Sterile conditions were needed during the process of all operations.
The isolated strains were cultured in 200 mL of Fungus NO.2 medium at 180 rpm, 28°C, for 1 week (Zhou et al., 2021). The cultures were centrifuged at 8,000 rpm, 4°C, for 10 min. The supernatant was added to an equal volume of ethyl acetate to be extracted three times, and the pooled extraction solvent was removed by rotary evaporation to collect the crude extracts. The crude extracts were dissolved in 1 mL methanol and filtered through a 0.22-µm nylon filter for the next QSI screening assay.
Screening and identification of the QSI active strainsC. violaceum CV026 was used as a sensor to test the QSI activities (Zeng et al., 2022). The overnight culture of C. violaceum CV026 was adjusted to OD620 = 0.1, then 1 mL culture was added to 100 mL LB agar medium with exogenous signaling molecule N-hexanoyl-l-homoserine lactone (final concentration 5 μM) and mixed thoroughly evenly, and the mixture was poured into Petri dishes. The crude extracts (20 μL) were added to each Oxford cup. Equal volume methanol was used as the negative control. After incubating at 28°C for 24 h, the pigment inhibition zone of C. violaceum CV026 was observed and recorded (Zhou et al., 2021).
The endophytic fungus was cultured on a PDA plate before DNA extraction. The total DNA was extracted and amplified by PCR with primers ITS1 (5′-TCCGTAGGTGAACCTGCGG-3′) and ITS4 (5′-TCCTCCGCTTATTGATATGC-3′) for analyzing the internal transcribed spacer (ITS) region of the nuclear ribosomal DNA (Zhang et al., 2016). The PCR product of endophytic fungus was sequenced by Tsingke Biotechnology Co., Ltd. (Beijing, China). The obtained sequences were aligned using MEGA-X to construct a phylogenetic tree.
Isolation and identification of the QSI active compoundThe endophytic fungus was cultured in rice solid medium for 15 d. After that, the metabolites of endophytic fungus were extracted with ethyl acetate and then purified by normal and reversed-phase C18 silica gel chromatography, high-performance liquid chromatography (HPLC), and Sephadex LH-20 with QS inhibiting bio-guided assays. The purified active compound was identified by liquid chromatography–mass spectrometry (LC-MS) and NMR and numbered PT22. PT22 was dissolved in dimethyl sulfoxide (DMSO) for 100 mg/mL.
Minimum inhibitory concentrations and growth curves measurementThe minimum inhibitory concentrations (MICs) of PT22 and antibiotics against P. aeruginosa PAO1 were performed according to the Clinical and Laboratory Standards Institute (CLSI 2023) method. Different final concentrations of PT22 and antibiotics (gentamycin and piperacillin) were twofold serially diluted in Müller–Hinton (MH) medium mixed with bacterial overnight cultures (0.1% volume percent, OD620 = 0.5). The mixtures were transferred to 96-well plates and incubated at 37°C, 180 rpm, for 24 h. DMSO served as a negative control. After incubation, the value of OD620 of each well was determined at each dose. The sub-MICs were considered for further assays.
The growth curves measurement assays were performed according to the reported methods with some modifications (Dahibhate et al., 2022). Overnight cultures of P. aeruginosa PAO1 were inoculated into 5 mL fresh LB broth with 0.1% volume percent and supplemented with different concentrations of PT22 (0.50 mg/mL, 0.75 mg/mL, 1.00 mg/mL, and 2.00 mg/mL). Hordenine (1.00 mg/mL) and DMSO served as positive and negative controls, respectively (Zhou et al., 2018b). The mixtures were transferred to 96-well plates and incubated at 37°C, 180 rpm, for 28 h. For every hour, the absorbance at OD620 was assessed by a microplate reader (Biotek EPOCH2, Winooski, VT, USA).
Signaling molecule level assayThe effects of PT22 on the synthesis of N-butanoyl-l-homoserine lactone (C4-HSL) and N-(3-oxododecanoyl)-l-homoserine lactone (3-oxo-C12-HSL) in P. aeruginosa PAO1 were detected by a high-performance liquid chromatography–mass spectrometry system (LCMS-IT-TOF, SHIMADZU, Kyoto, Japan) equipped with a C18 column (100 × 2.1 mm, particle 5 μm). The relative levels of C4-HSL and 3-oxo-C12-HSL were identified and determined according to the retention time (Rt) of standards and their MS/MS2 fragment ions. Overnight culture of 100 µL was added to 100 mL of LB broth containing PT22 (0.50 mg/mL, 0.75 mg/mL, and 1.00 mg/mL) and inoculated at 37°C, 180 rpm, for 20 h. DMSO served as the negative control. After that, the fermentation broths were centrifuged at 10,000 rpm at 4°C for 10 min. The supernatant was mixed with an equal volume of acidified ethyl acetate (0.5% formic acid) three times. The resulting solvents were dried, then dissolved in methanol, and filtered through a 0.45-µm nylon filter (Zhou et al., 2018a). Mobile phase A was double distilled water (0.1% formic acid), and mobile phase B was methanol. The injection volume was 10 µL. The flow rate was 0.8 mL/min. The gradient for standard C4-HSL was set as follows: 1–10 min, 10% B; 15–20 min, 10%–30% B. The gradient for authentic 3-oxo-C12-HSL was set as follows: 1–10 min, 20% B; 15–20 min, 20%–40% B. The results were normalized to the relative quantification of negative control.
Inhibition of virulence factor assayThe overnight cultures of P. aeruginosa PAO1 (0.50 mL) were inoculated 0.1% into 50 mL LB broth supplemented with PT22, hordenine, and DMSO (Zhou et al., 2023a), and their final concentrations of PT22 were 0.50 mg/mL, 0.75 mg/mL, and 1.00 mg/mL, respectively. The reported QSI hordenine (1.00 mg/mL) and DMSO served as positive and negative controls, respectively. After incubation at 37°C, 180 rpm, for 20 h, the cultures were centrifuged at 4°C, 10,000 rpm, for 10 min and filtered through a sterilized 0.22-μm nylon syringe filter. The cell-free supernatant was collected for virulence factor assays.
The measurement of pyocyanin was performed according to reports with some modifications (Ahmed et al., 2019). Chloroform (1.2 mL) was added to 2 mL supernatant and vortexed until the color of the chloroform phase was changed. After centrifugation at 10,000 rpm, 1 mL chloroform phase was then transferred to a new tube and added equal volume of 0.2 M of hydrochloric acid (HCl). The tubes were vortexed until the color of the chloroform phase was changed. The mixtures were centrifuged at 4°C, 10,000 rpm, for 10 min. The absorbance of the supernatant was determined at OD520 using a microplate reader (Biotek EPOCH2, USA).
Alginate production was estimated according to the method with slight modifications (Gopu et al., 2015). In brief, 100 µL supernatant was added to 600 µL of boric acid–sulfuric acid mixing solution (4:1, V/V). The mixture was added to 20 µL of 0.2% of carbazole suspended in ethanol, vortexed for 30 s, and then incubated at 55°C for 30 min. The absorbance of the mixture was measured at OD530 (Biotek EPOCH2, USA).
Siderophore quantitative assay was performed as the chrome azurol S method with minor modifications (Yin et al., 2022). The supernatant (2 mL) was mixed with an equal volume of chrome azurol S (CAS) assay solution and maintained for 30 min in darkness. The absorbance of the mixture was measured at OD630 with a microplate reader (Biotek EPOCH2, USA).
The inhibitory effects of PT22 on elastase activity were determined based on the experimental protocol given by the elastase ELISA kit (Mlbio, Shanghai, China).
Protease activities were measured via reported methods with some modifications (Zhou et al., 2018a). Briefly, 150 μL supernatant was added to 250 µL 0.3% azocasein dissolved in 0.1 M phosphate-buffered saline (PBS; pH 8.0) and incubated at 37°C for 3 h. To quickly terminate the reaction, 1.2 mL of 10% trichloroacetic acid was added and immersed in ice for 20 min. After centrifugation at 4°C, 10–000 rpm, for 10 min, an equal volume of 1 M sodium hydroxide solution was mixed with the supernatant, and the absorbance at OD440 was measured using a microplate reader (Biotek EPOCH2, USA).
Rhamnolipid contents were measured using reported methods with some modifications (Zhou et al., 2018a). HCl at a concentration of 6 M was added to the supernatant (5 mL) to pH 2.0. The mixtures were maintained at 4°C for 15 h and then centrifuged at 10,000 rpm, 4°C, for 20 min. The supernatant was removed, and the precipitate was dissolved in 1 mL of methanol. After the addition of 4 mL of sulfuric acid anthrone solution (0.2% anthrone dissolved in 85% sulfuric acid), the solution was maintained in a boiling water bath for 15 min, and the absorbance at OD625 was measured using a microplate reader (Biotek EPOCH2, USA).
Motility assaysThe motility assays were evaluated according to the reports (Chadha et al., 2022). Overnight cultures (2 μL) of P. aeruginosa PAO1 were inoculated into the center of the swimming agar (1% tryptone, 0.5% NaCl, and 0.3% agar), swarming agar (1% peptone, 0.5% NaCl, 0.5% glucose, and 0.5% agar), and twitching agar (LB broth with 1% agar) in the absence or presence of PT22 (0.50 mg/mL, 0.75 mg/mL, and 1.00 mg/mL). Hordenine (1.00 mg/mL) and DMSO served as positive and negative controls, respectively. The plates were incubated at 37°C for 17 h, and the diameters of the colony were recorded.
Real−time quantitative PCR analysisThe effects of PT22 on the expression levels of QS-related genes in P. aeruginosa PAO1 were investigated with previous descriptions (Zhou et al., 2018a; Zhou et al., 2023b). Briefly, overnight culture was inoculated to 50 mL of LB broth containing PT22 (1.00 mg/mL) and incubated at 37°C, 180 rpm, for 20 h. DMSO served as the negative control. The RNA extraction kit (Sangon Biotech, Shanghai, China) was used to extract total RNA. The cDNA was obtained by Maxima Reverse Transcriptase (Thermo Scientific, Waltham, MA, USA). RT-qPCR was performed using SG Fast qPCR Master Mix Kit (Sangon Biotech, China) on a fluorescent qPCR instrument (StepOnePlus, ABI, Foster City, CA, USA). The gene rpsL was used as an internal control to normalize RT-qPCR data. The primers used are listed in Supplementary Table S2. The relative expression levels of target genes were calculated via the 2−ΔΔCt method.
Molecular dockingMolecular docking analysis was performed using the AutoDock Vina (Trott and Olson, 2010). The 3D structures of all ligands were drawn using Chem 3D software. The 3D structures of the receptor proteins LasI, LasR, RhlR, and PqsR were downloaded from the Protein Data Bank (ID: 1RO5, 2UV0, 8B4A, and 6Q7U). The 3D structures of RhlI and MexB (ID: P54291 and P52002) were obtained from UniProt (https://www.uniprot.org).
Microdilution checkerboard assayThe microdilution checkerboard methods were performed to evaluate the effects of antibiotics in combination with PT22 (Chadha et al., 2022). Different final concentrations of PT22 and antibiotics (gentamycin and piperacillin) were twofold serially diluted in MH medium mixed with bacterial overnight cultures. The mixtures were transferred to 96-well plates, and each well that contained antibiotic and PT22 was incubated at 37°C for 24 h. The fractional inhibitory concentration indexes (FICIs) were calculated for each antibiotic in each combination.
Biofilm inhibition assayBiofilm inhibition assays were carried out according to the reports with minor modifications (Moreno-Chamba et al., 2023; Zhou et al., 2023a). For biofilm formation inhibition assays, overnight cultures were inoculated into tryptic soy broth (TSB) broth supplemented with PT22 (0.50 mg/mL, 0.75 mg/mL, and 1.00 mg/mL), gentamycin (4.00 μg/mL), piperacillin (4.00 μg/mL), the combination of 4.00 μg/mL gentamycin and 0.50 mg/mL PT22 (gentamycin + PT22), and the combination of 4.00 μg/mL piperacillin and 0.50 mg/mL PT22 (piperacillin + PT22). Hordenine (1.00 mg/mL) and DMSO served as positive and negative controls, respectively. The mixtures were transferred to the 96-well plates (150 μL), and after incubation at 37°C for 24 h, the excess TSB medium was removed. The biofilms were washed with sterile PBS and stained with 0.05% (w/v) crystal violet for 15 min. Then, the biofilms were washed with PBS to remove excess crystal violet. After being dried at 60°C, 200 µL of 95% ethanol was used to dissolve crystal violet. The absorbance was determined at OD570 using a microplate reader (Biotek EPOCH2, USA).
For biofilm eradication assays, overnight cultures were inoculated to fresh TSB broth, and 150 µL was transferred to 96-well plates followed by incubation at 37°C for 24 h. After that, the suspension cultures were removed, and the residual biofilms were gently washed with sterile PBS. Then, 150 μL fresh TSB broth was added to well containing PT22 (0.50 mg/mL), gentamycin (4.00 μg/mL), piperacillin (4.00 μg/mL), gentamycin (4.00 μg/mL) + PT22 (0.50 mg/mL), and piperacillin (4.00 μg/mL) + PT22 (0.50 mg/mL). The plates were incubated at 37°C for 24 h. After incubation, the biofilm mass was determined according to the biofilm formation inhibition assays.
Microscopic analysisScanning electron microscopy (SEM) and confocal laser scanning microscopy (CLSM) were used to investigate and visualize biofilms following exposure to drugs (Chadha et al., 2023). Briefly, overnight cultures were inoculated to LB broth supplemented with PT22 (0.50 mg/mL, 0.75 mg/mL, and 1.00 mg/mL), gentamycin (4.00 μg/mL), piperacillin (4.00 μg/mL), gentamycin (4.00 μg/mL) + PT22 (0.50 mg/mL), and piperacillin (4.00 μg/mL) + PT22 (0.50 mg/mL). DMSO served as a negative control. The mixtures were transferred to the 24-well plates with circular coverslips and incubated at 37°C for 24 h.
For SEM assay, after incubation, the mature biofilms on the coverslips were gently washed with PBS to remove the planktonic bacteria; 2.5% glutaraldehyde was used to fix the mature biofilms for 12 h and then removed followed by gentle washing with PBS (pH 7.2). The resulting biofilms were sequentially dehydrated using a gradient of ethanol (50%, 70%, 90%, and 100%). The coverslips were freeze-dried, gold-coated, and visualized under SEM (S4800, HITACHI, Tokyo, Japan).
For CLSM, the mature biofilms on the coverslips were stained with 0.1 mg/mL of acridine orange solution and ethidium bromide solution (V/V = 1:1) for 15 min in darkness, and the images were observed by CLSM (TCS SP8, Leica, Wetzlar, Germany).
Cytotoxicity assayCytotoxicity was measured via CCK-8 assay using RAW 264.7 cells incubated in Dulbecco’s Modified Eagle’s Medium (DMEM) according to the reported method, with some modifications (Fong et al., 2019). Briefly, RAW 264.7 cells were grown in DMEM and supplemented with 10% fetal bovine serum (Gibco, Grand Island, NY, USA) at 37°C and 5% CO2. The cells were transferred into 96-well microplates with 1 × 10⁵ cells/well. After being incubated for 24 h, the cells were washed with PBS and treated with PT22 (0.50 mg/mL, 0.75 mg/mL, and 1.00 mg/mL) in 100 µL DMEM. DMSO was used as the negative control. After continuous incubation at 37°C and 5% CO2 for 24 h, 10 μL of CCK-8 solution was added to each well, followed by incubation at 37°C for an additional 1 h for cell viability measurement. Subsequently, solution absorbance was measured using a microplate reader (Biotek EPOCH2, USA) at 450 nm.
Galleria mellonella survival assayG. mellonella larvae have been considered a traditional model to investigate microbial infections in vivo (Tsai et al., 2016). The survival rates of the larvae after the treatment of PT22 (0.50 mg/mL, 0.75 mg/mL, and 1.00 mg/mL), antibiotics (4.00 μg/mL gentamycin and 4.00 μg/mL piperacillin) alone, gentamycin (4.00 μg/mL) + PT22 (0.50 mg/mL), and piperacillin (4.00 μg/mL) + PT22 (0.50 mg/mL) were used to evaluate the effects on P. aeruginosa PAO1 infection according to the reports with some modifications (Ménard et al., 2021). DMSO served as a negative control. Briefly, overnight cultures of P. aeruginosa PAO1 were centrifuged at 4°C, 10,000 rpm, for 10 min, resuspended in sterile 0.95% NaCl solution, and adjusted to 106 CFU/mL. After being disinfected externally with 75% ethanol, a 10-μL aliquot was injected into larvae using a Hamilton syringe, and a 10-μL dose of a single drug type or drug combination was injected directly into larvae at 1 h post-infection. Mortality was monitored each 24 h for 120 h. The controls were injected with 10 µL of sterile 0.95% NaCl solution.
Statistical analysisAll experiments were performed in biological triplicates, and data were presented as means ± standard deviation (SD). Statistical differences were evaluated with a one-way analysis of variance ANOVA test or t-test using GraphPad Prism 8 (GraphPad Software Inc., La Jolla, CA, USA). p ≤ 0.05 was considered to be statistically significant (*p ≤ 0.05, **p ≤ 0.01, ***p ≤ 0.001, and ****p ≤ 0.0001).
ResultsIdentification of the QSI active strainThe active endophytic fungus FF2 was isolated from the fruits of A. catechu L. Morphologically, a colony of strain FF2 on the PDA plate is radial with white substrate mycelia and has a leathery texture (Figure 1). The phylogenetic tree was constructed (Figure 1) based on the ITS rRNA gene sequencing and the blast results. The strain FF2 was identified as Perenniporia tephropora (NCBI accession number: OR349622).
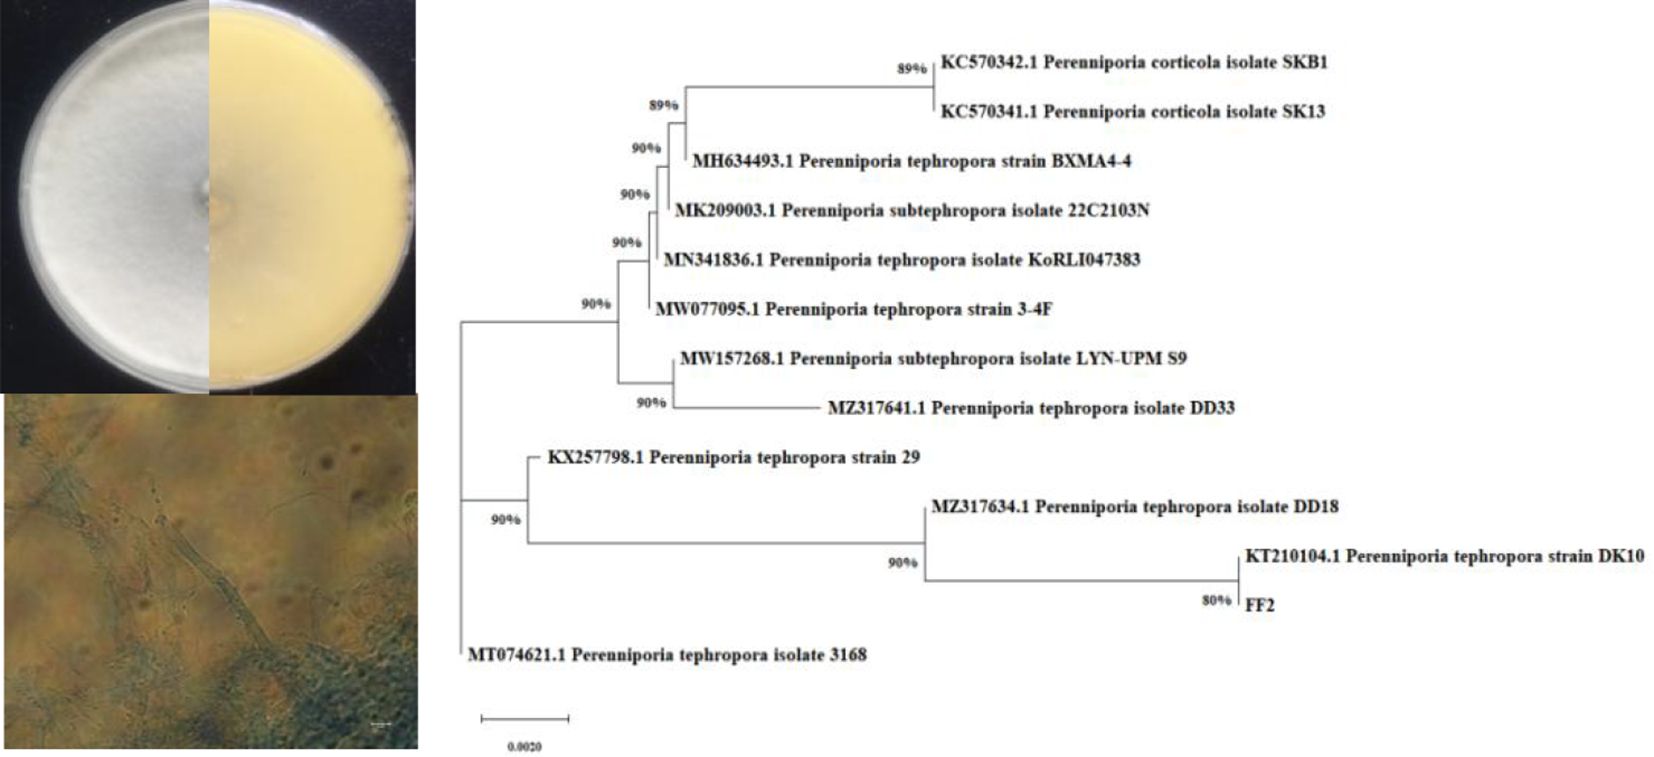
Figure 1 The phylogenetic tree and morphological features of Perenniporia tephropora FF2.
Purification and identification of QSI active compoundA total of 51.1 mg of QSI active compound PT22 was obtained under bio-guided screenings (Supplementary Figure S2), it was a yellow powder, and its high-resolution electrospray ionization mass spectrometry (HR-ESI-MS) was 154.0160 [M]− (calcd for C6H5NO4, 155.1082). By comparing the data from HR-ESI-MS and NMR spectra (Supplementary Figure S3) with those of previous studies (Koálová et al., 1992), the chemical was identified as 1H-pyrrole-2,5-dicarboxylic acid (Supplementary Figure S3).
Determination of MICs and growth curvesThe MIC of PT22 against P. aeruginosa PAO1 was more than 2.00 mg/mL, and hence, the concentrations for studying the QSI experiments should be sub-MIC. The results of the growth curves showed that PT22 presented no effect on P. aeruginosa PAO1 growth from 0.50 to 1.00 mg/mL (Figure 2). Therefore, the concentrations of 0.50 mg/mL, 0.75 mg/mL, and 1.00 mg/mL were selected for the QSI active evaluation. In addition, the MICs of gentamycin and piperacillin were 8.00 μg/mL (Supplementary Table S1).
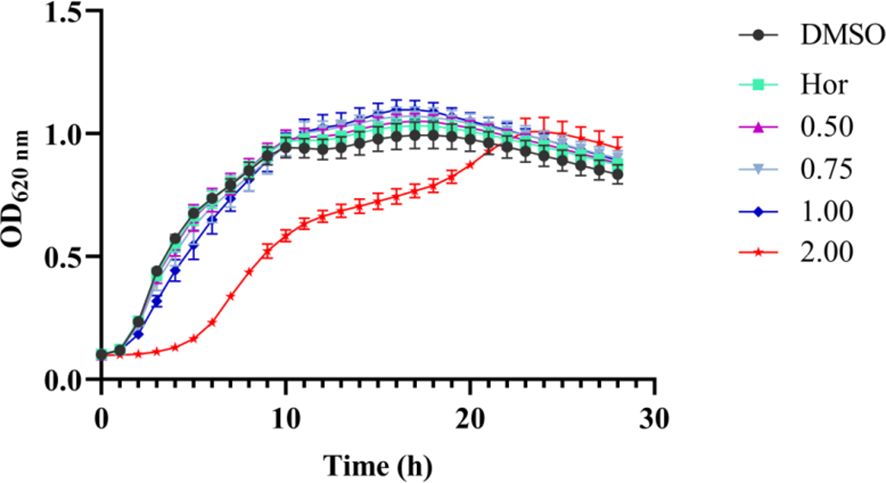
Figure 2 Effects of PT22 (0.50 to 2.00 mg/mL) on the growth curves of Pseudomonas aeruginosa PAO1. Hordenine (Hor; 1.00 mg/mL) and DMSO served as positive and negative controls, respectively. DMSO, dimethyl sulfoxide.7.
Inhibition of signaling molecule secretionThe Rts of C4-HSL and 3-oxo-C12-HSL in strain were 11.99 and 13.56 min, respectively, which were identified with standards and their MS/MS2 fragment ions (Figures 3A, B). Compared to those of the control group, the relative levels of C4-HSL treated with PT22 (0.50 mg/mL, 0.75 mg/mL, and 1.00 mg/mL) were reduced by 8.59%, 31.41%, and 44.12%, respectively (Figure 3C, a). Correspondingly, the levels of 3-oxo-C12-HSL were reduced by 11.55% after PT22 treatment at 1.00 mg/mL (Figure 3C, b). This demonstrates the PT22 may impede C4-HSL production, resulting in QSI activity.
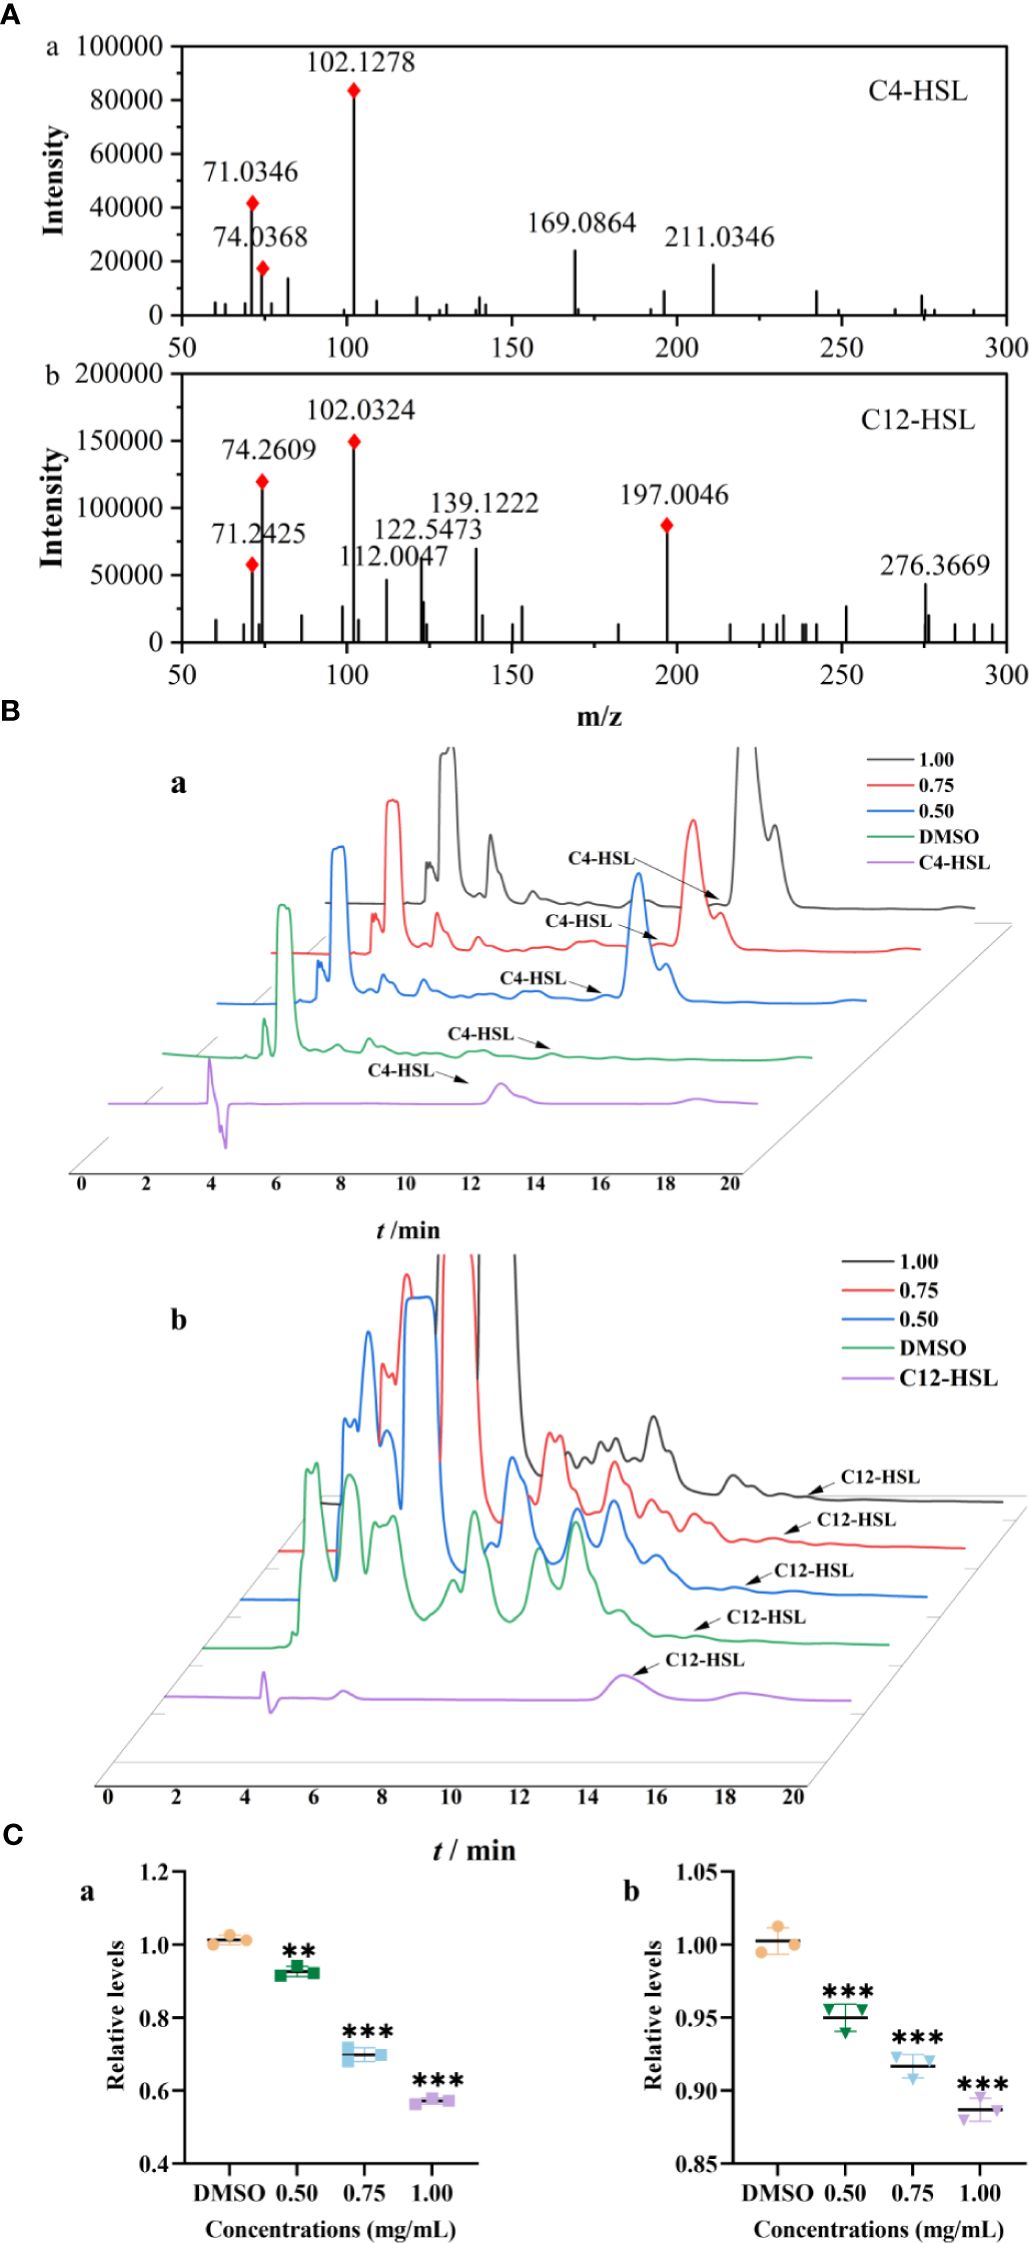
Figure 3 Relative quantification of C4-HSL and 3-oxo-C12-HSL by HPLC-MS/MS2. Product ion spectra of C4-HSL (a) and 3-oxo-C12-HSL (b) (A). The chromatograms of AHLs produced by Pseudomonas aeruginosa PAO1 treated with PT22 (0.50 mg/mL, 0.75 mg/mL, and 1.00 mg/mL) (B). Quantitative analysis of C4-HSL (a) and 3-oxo-C12-HSL (b) exposed to PT22 (0.50 mg/mL, 0.75 mg/mL, and 1.00 mg/mL) (C). DMSO served as negative control. **p < 0.01 and ***p < 0.001 compared to the DMSO group by one-way ANOVA. HPLC, high-performance liquid chromatography; AHLs, acylated homoserine lactones; DMSO, dimethyl sulfoxide.
Inhibition of virulence factorsThe virulence factors are the key element to help bacteria infect, colonize, and survive. There were significant reductions in virulence factors of P. aeruginosa PAO1 after being exposed to PT22. As shown in Figure 4A, the pyocyanin contents were dramatically reduced by 13.17%, 37.06%, and 73.05% after treatment with different concentrations (0.50 mg/mL, 0.75 mg/mL, and 1.00 mg/mL, respectively) of PT22, whereas hordenine presented inhibition by 67.54% at 1.00 mg/mL. Hordenine (1.00 mg/mL) treatment led to the reduction of the rhamnolipid level by 37.95%. Additionally, rhamnolipid production declined by 24.75%, 29.66%, and 34.06% at concentrations of 0.50 mg/mL, 0.75 mg/mL, and 1.00 mg/mL, respectively (Figure 4B). The relative levels of the siderophores were decreased by 10.35% and 53.59% at 0.75 and 1.00 mg/mL of PT22, respectively, while the positive control hordenine (1.00 mg/mL) showed the depletion in siderophores by 27.7% (Figure 4C). The protease and elastase activities were reduced by 8.27% and 8.16%, respectively, after being treated with PT22 at 1.00 mg/mL (Figures 4D, F), whereas hordenine (1.00 mg/mL) presented inhibition by 25.15% and 11.17%, respectively. Approximately 26.98% and 42.02% reductions of alginate were observed with exposure of 0.75 and 1.00 mg/mL of PT22, respectively (Figure 4E). Moreover, the hordenine (1.00 mg/mL) presented a depletion of alginate production by 34.46%. Further, with the concentration increasing, the inhibitory effects of PT22 on virulence factors except protease and elastase of P. aeruginosa PAO1 were gradually increased in dose-dependent manners.
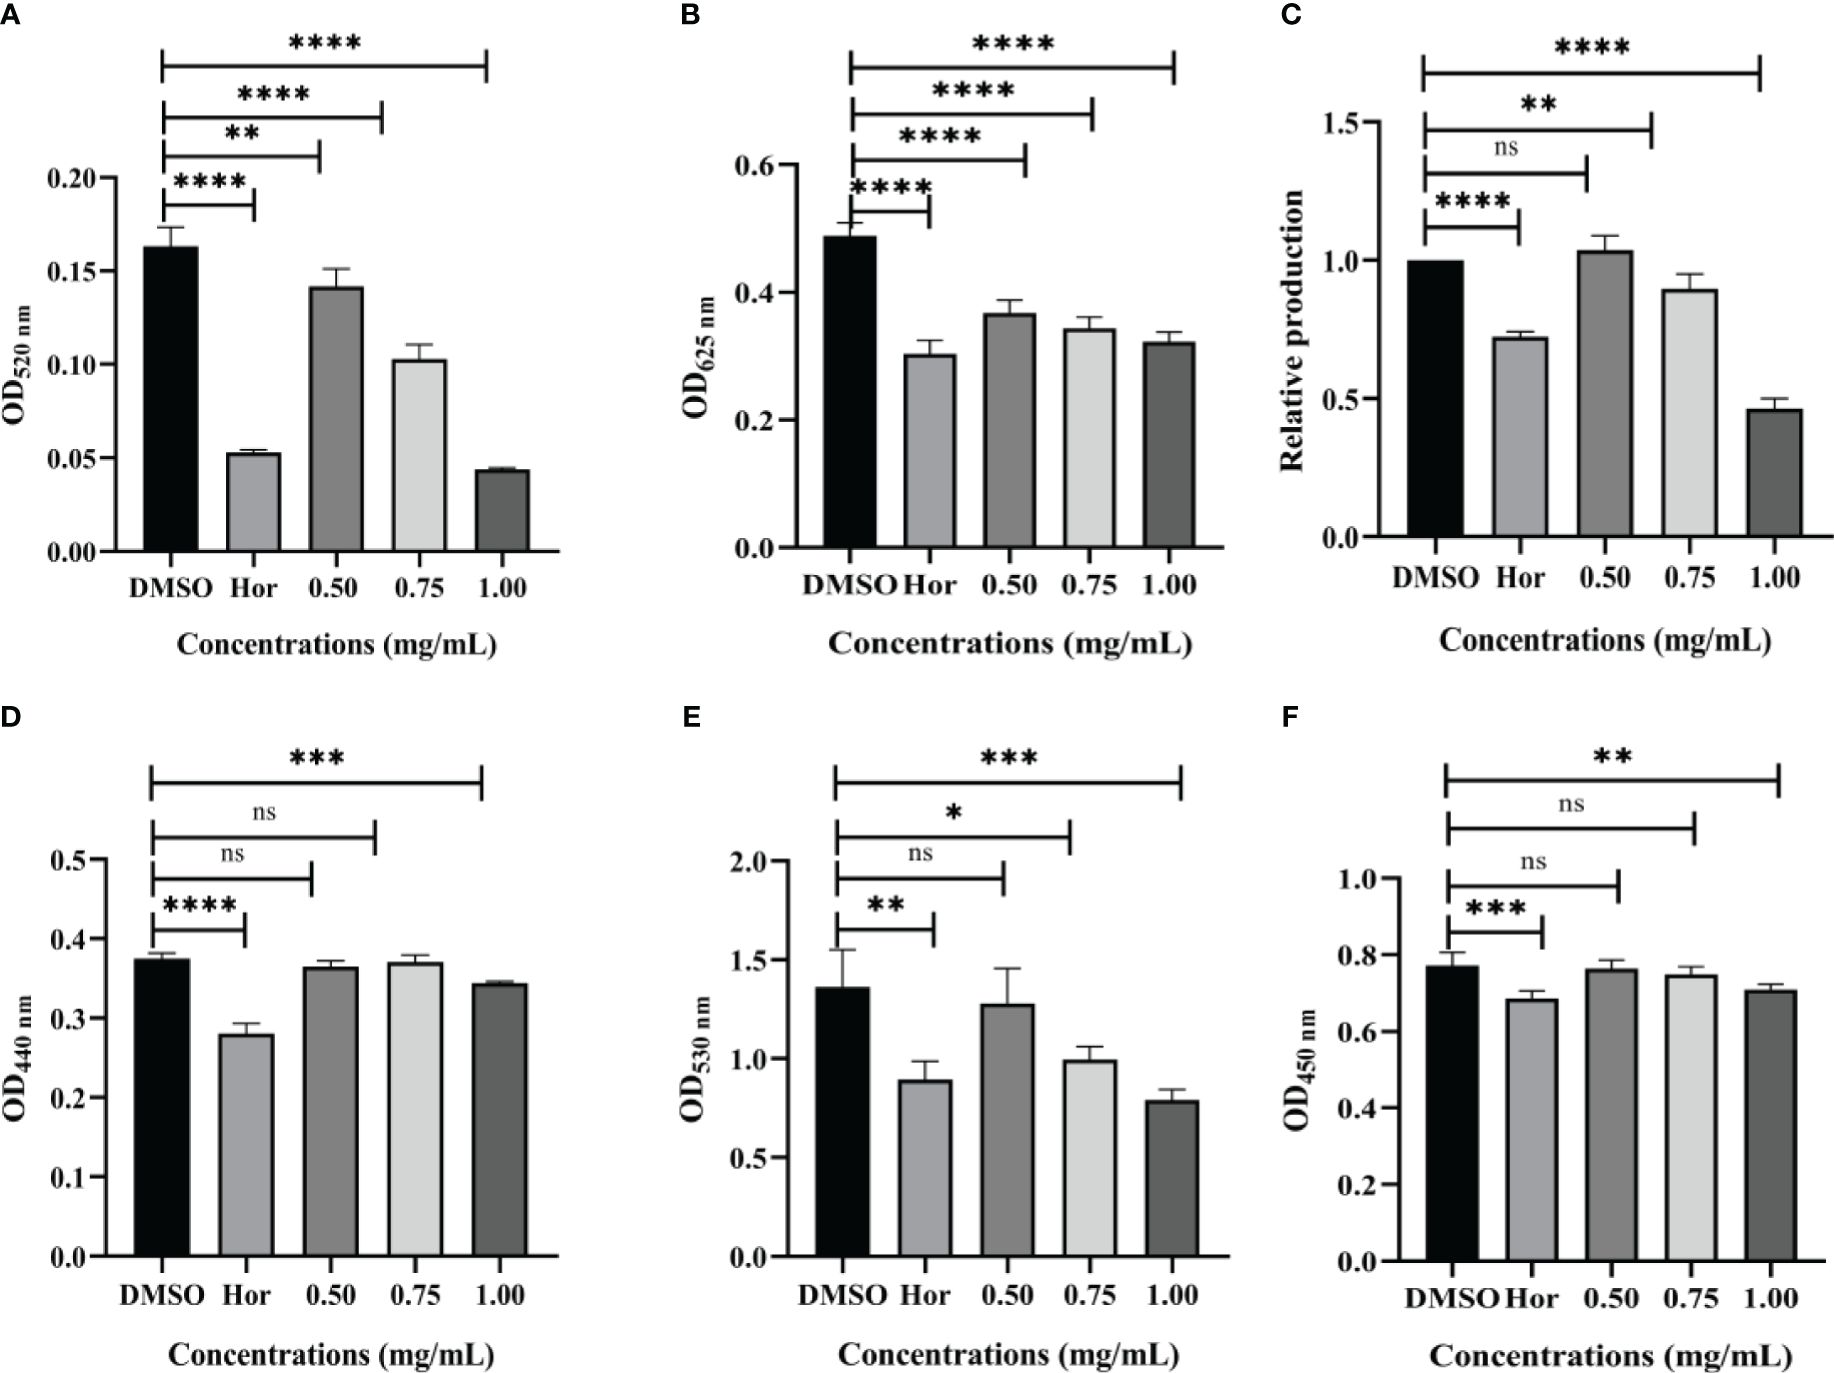
Figure 4 Effects of PT22 (0.50 mg/mL, 0.75 mg/mL, and 1.00 mg/mL) on virulence factors of Pseudomonas aeruginosa PAO1, including pyocyanin (A), rhamnolipid (B), siderophores (C), elastase (D), alginate (E), and protease (F). Hordenine (b) and DMSO (a) served as positive and negative controls, respectively. *p < 0.05, **p < 0.01, ***p < 0.001, and ****p < 0.0001 compared to the DMSO group by one-way ANOVA. DMSO, dimethyl sulfoxide. “ns” means no significance.
Inhibition of motilityFlagella are able to help planktonic bacteria colonize on surfaces. The effects of PT22 on swimming, swarming, and twitching of P. aeruginosa PAO1 were evaluated (Figures 5A–C). There was a significant depletion in swimming motility of 22.22%, 57.78%, and 90.73% when exposed to PT22 (0.50 mg/mL, 0.75 mg/mL, and 1.00 mg/mL, respectively) (Figure 5D, a). The swimming motility of P. aeruginosa PAO1 was markedly reduced by 42.96% when exposed to hordenine (1.00 mg/mL). The swarming diameter was decreased by 43.53%, 65.75%, and 86.11% (Figure 5D, b). Moreover, when treated with hordenine (1.00 mg/mL), the colony diameter was reduced by 70.36%. For the twitching study, the colony diameter was decreased by 20.93, 31.79, and 73.65% (Figure 5D, c). Furthermore, treatment with hordenine (1.00 mg/mL) demonstrated a significant reduction in the colony diameter of 44.95%. There is a significant reduction in motility activity of P. aeruginosa PAO1 in response to PT22 in comparison with negative control.
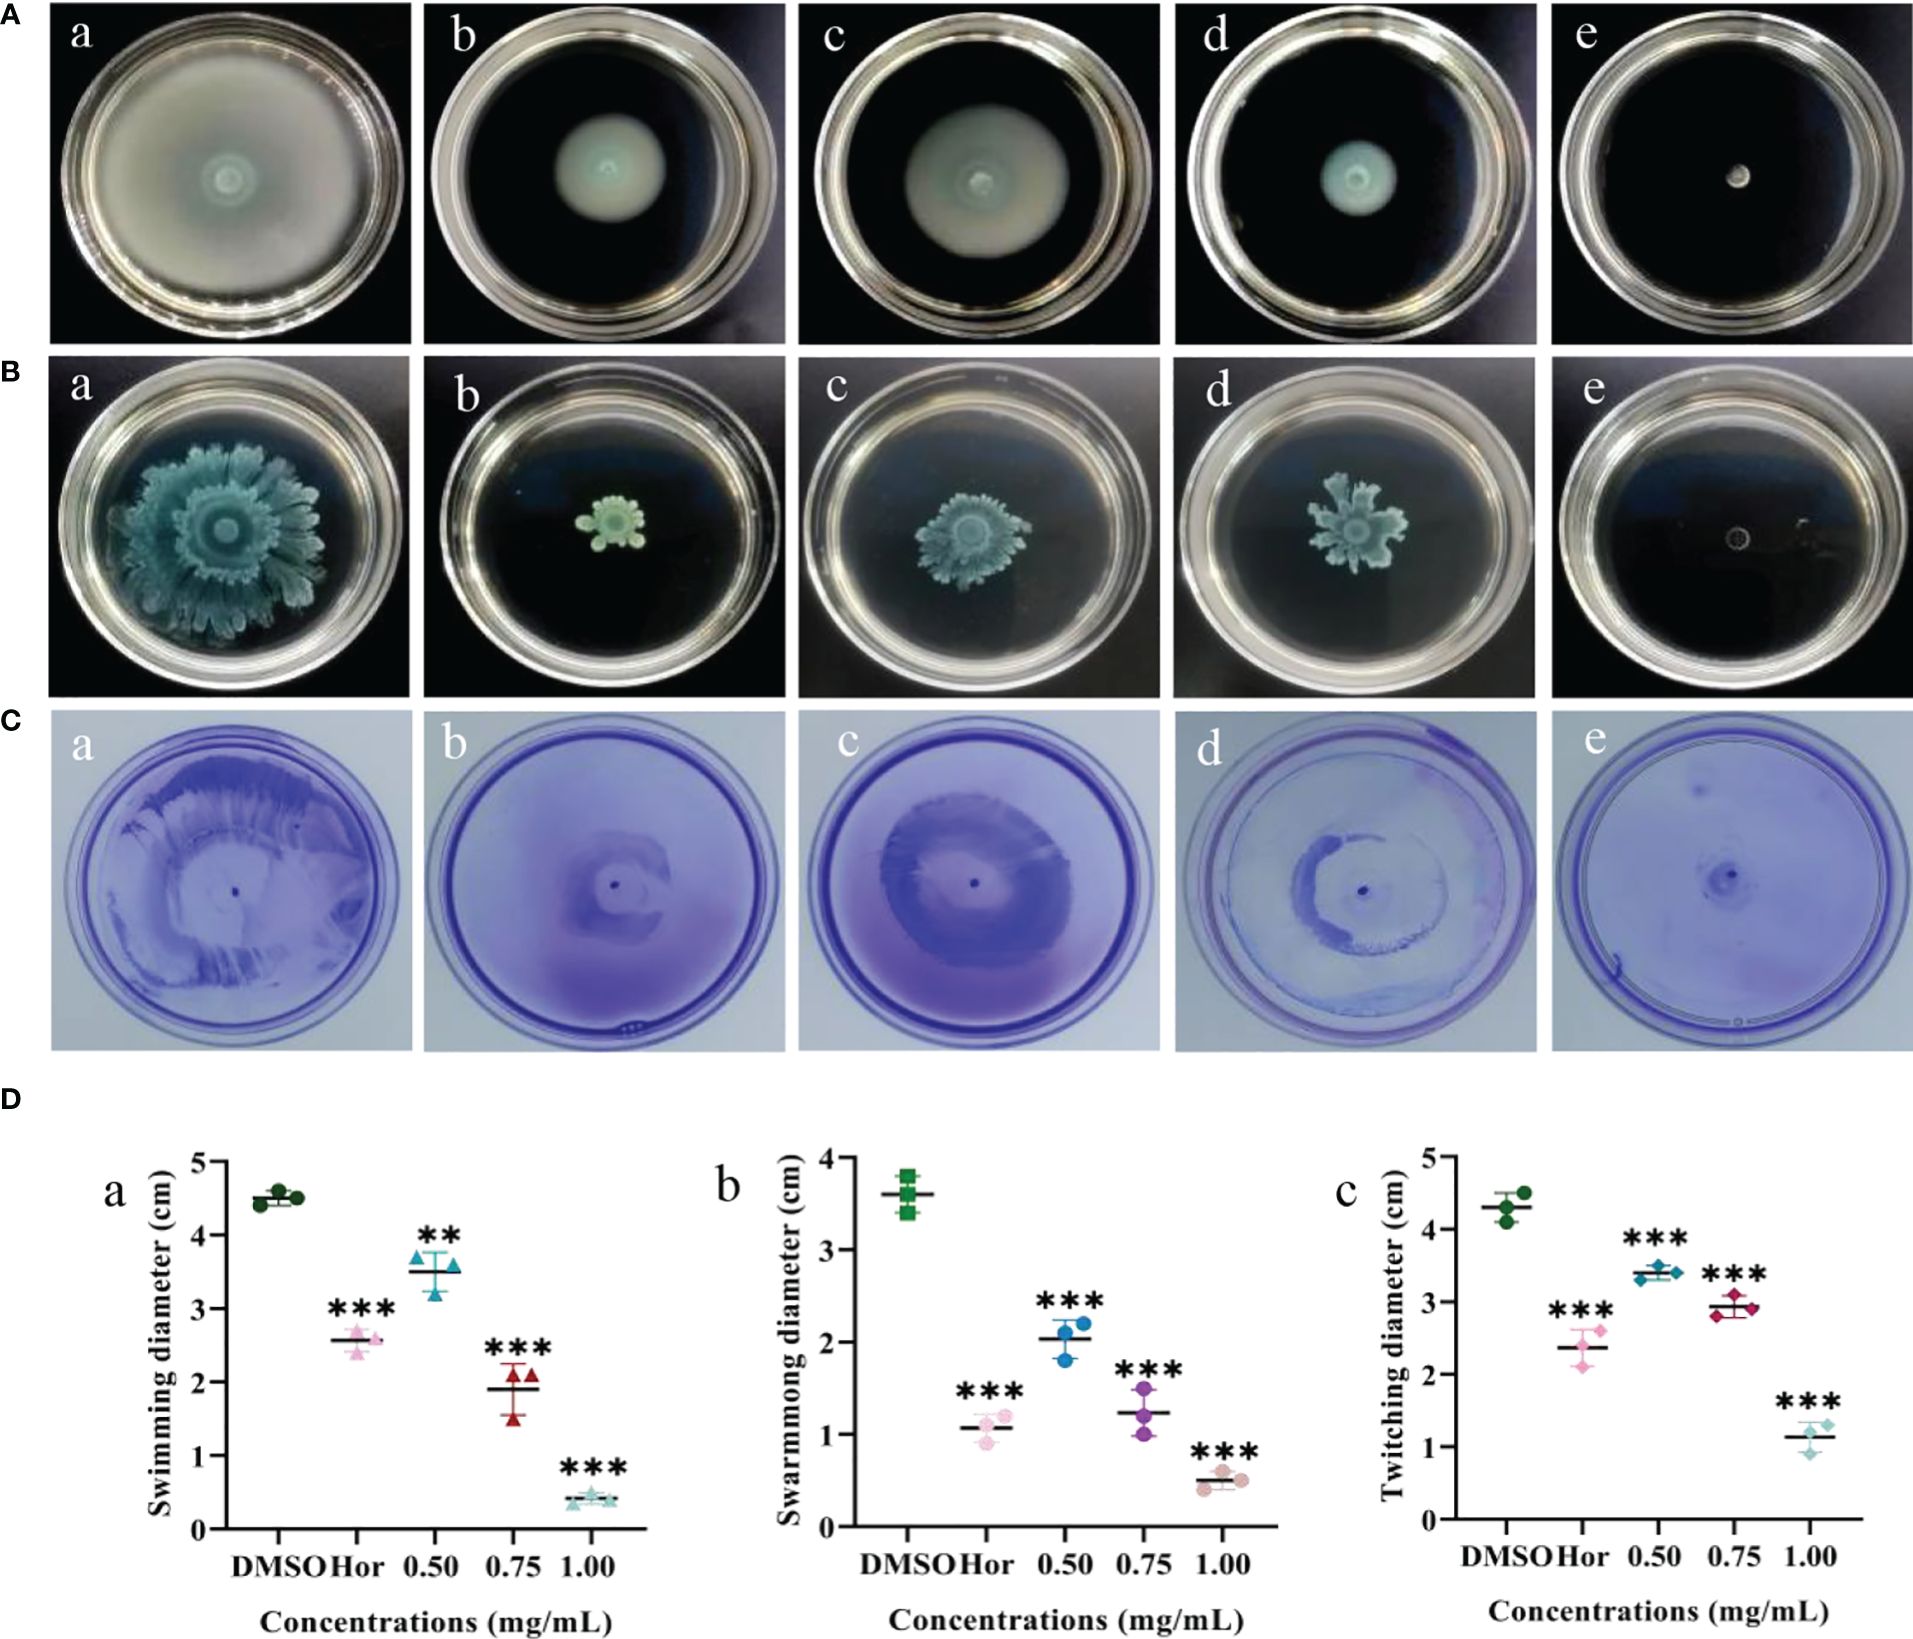
Figure 5 Effects of PT22 [0.50 (c), 0.75 (d), and 1.00 (e) mg/mL) on swimming (A), swarming (B), and twitching (C) of Pseudomonas aeruginosa PAO1. Hordenine (b) and DMSO (a) served as positive and negative controls, respectively. The diameters of the swimming (a), swarming (b), and twitching (c) zones were recorded (D). **p < 0.01 and ***p < 0.001 compared to the DMSO group by one-way ANOVA. DMSO, dimethyl sulfoxide.
Effects on gene expressionRT-qPCR was performed to study the effect of PT22 on the transcriptional level of QS-related genes in P. aeruginosa PAO1 (Figure 6). After being exposed to PT22 (1.00 mg/mL) for 20 h, the expression of genes encoding the QS systems (lasI, lasR, rhlI, rhlR, and pqsR) was downregulated extremely by 70.41%, 78.18%, 83.56%, 77.39%, and 86.67%, respectively. QS-related genes included protease (lasA), elastase (lasB), rhamnolipid (rhlA), exotoxin A (toxA), and pyocyanin production (phzM), which presented significant downregulation by 57.79%, 55.49%, 62.16%, 89.97%, and 86.08%, respectively. Exopolysaccharides produced by P. aeruginosa PAO1 mainly including alginate, Pel, and Psl are responsible for biofilm formation. The genes encoding the alginates (algD), Pel (pelA), and Psl (pslA) treated with PT22 were reduced by 88.71%, 90.00%, and 84.41%, respectively. The genes regulated to motility activity (fliC and pilA) were downregulated by 66.58% and 82.15%, respectively. Furthermore, exoS and exoY encoding the ExoS and ExoY effectors secreted by type III secretion system (T3SS) were downregulated by 88.99% and 89.99%, respectively. The expression level of mexB related to the multidrug resistance efflux pump was downregulated by 87.63%. In addition, the expression level of gacA related to the GacS/GacA two-component system (TCS), which is a master regulator of virulence, swarming motility, and biofilm formation, was reduced by 68.14% (Wei et al., 2013). The results indicated that the genes related to QS, T3SS, multidrug resistance efflux pump, and the GacS/GacA TCS were downregulated significantly when exposed to PT22 (1.00 mg/mL) for 20 h.
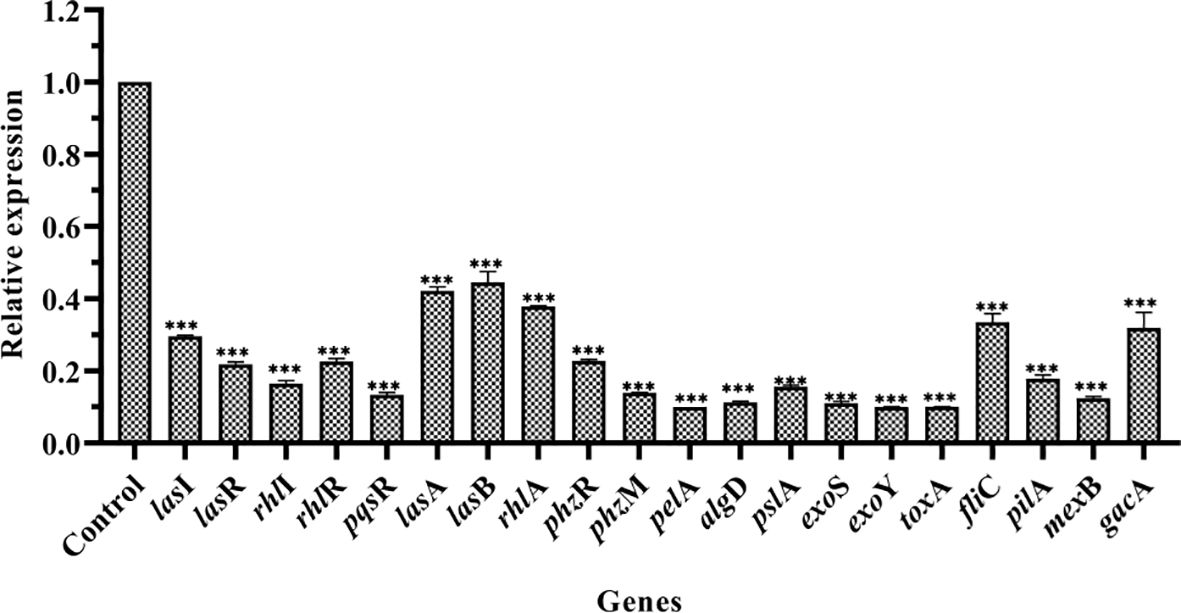
Figure 6 Effects of PT22 1.00 mg/mL on the expression of genes in Pseudomonas aeruginosa PAO1. The expression level was versus DMSO control group. The relative expression levels of genes were normalized by the 2−ΔΔCt method. rpsL was used as an internal reference gene to normalize. The relative expression levels of lasI, lasR, rhlI, rhlR, pqsR, lasA, lasB, rhlA, phzR, phzM, pelA, algD, pslA, exoS, exoY, toxA, fliC, pilA, mexB, and gacA were significantly reduced by 70.41%, 78.18%, 83.56%, 77.39%, 86.67%, 57.79%, 55.49%, 62.16%, 77.21%, 86.08%, 90.00%, 88.71%, 84.41%, 88.99%, 89.99%, 89.97%, 66.58%, 82.15%, 87.63%, and 68.14%, respectively. Values are shown as the mean ± SD. ***p < 0.001 compared to the DMSO group by one-way ANOVA. DMSO, dimethyl sulfoxide.
Molecular docking analysisTo confirm the PT22 against the QS system and multidrug resistance efflux pump of P. aeruginosa PAO1, the possibility of PT22 binding interactions with receptor proteins was analyzed by molecular docking. The 3D structures of docking complexes of LasI, LasR, RhlI, RhlR, PqsR, and MexB receptor proteins are shown in Figure 7, and the 2D interaction is shown in Supplementary Figure S4. The results showed that 3-oxo-C12-HSL binds to the auto-inducer secreting protein LasI via hydrogen bonds at Arg30 and Thr145 residues. PT22 binds to LasI via hydrogen bonds at Arg104, Phe105, Val43, and Arg30 residues (Figure 7A). The docking energy between LasI and 3-oxo-C12-HSL is −6.4 kcal/mol, and that between LasI and PT22 is −6.2 kcal/mol (Supplementary Table S3). Residues Trp60, Asp73, Thr75, Ser129, and Tyr56 form hydrogen bonds, which are responsible for the docking complex of LasR and 3-oxo-C12-HSL. PT22 binds to the receptor protein LasR via hydrogen bonds at Tyr56, Tyr64, Asp73, Tyr93, and Ser129 residues (Figure 7B). The docking energy between LasR and 3-oxo-C12-HSL is −8.6 kcal/mol, which is −7.1 kcal/mol between LasR and PT22 (Supplementary Table S3). Hydrogen bonds at Tyr105 and Val138 residues play a major role in C4-HSL binding to RhlI. PT22 binds to RhlI via hydrogen bonds at Val138 and Arg104 residues (Figure 7C). The interaction docking energy between RhlI and C4-HSL, and between RhlI and PT22 are −5.4 kcal/mol and −5.1 kcal/mol, respectively (Supplementary Table S3). C4-HSL binds to RhlR by hydrogen bonds at Tyr64, Ser135, Asp81, and Trp68 residues. PT22 binds to the receptor protein RhlR via hydrogen bonds at Ser135 and Asp81 residues (Figure 7D). The interaction docking energy between RhlR and C4-HSL is −4.4 kcal/mol, and that between RhlR and PT22 is −6.1 kcal/mol. The natural ligand 2-nony-4-quinolone (NHQ) binds to the receptor PqsR via hydrophobic bonds. Residues His204, Ile236, and Gln194 form hydrogen bonds, which are responsible for the docking complex of PqsR and PT22 (Figure 7E). The interaction docking energy between PqsR and NHQ, and between PqsR and PT22 is −7.1 kcal/mol and −5.8 kcal/mol, respectively. There are six hydrogen bonds between MexB and gentamycin formed at Phe617, Asn718, Thr93, Tyr77, and Ser79 residues. Piperacillin binds to MexB via covalent bonds of Thr115, Val64, Gln63, Met69, and Ile127. PT22 binds to MexB via covalent bonds at Leu111 and Thr115 residues (Figure 7F). The interaction docking energy of gentamycin, piperacillin, and PT22 to MexB was −8.5 kcal/mol, −8.6 kcal/mol, and −5.9 kcal/mol, respectively (Supplementary Table S4).
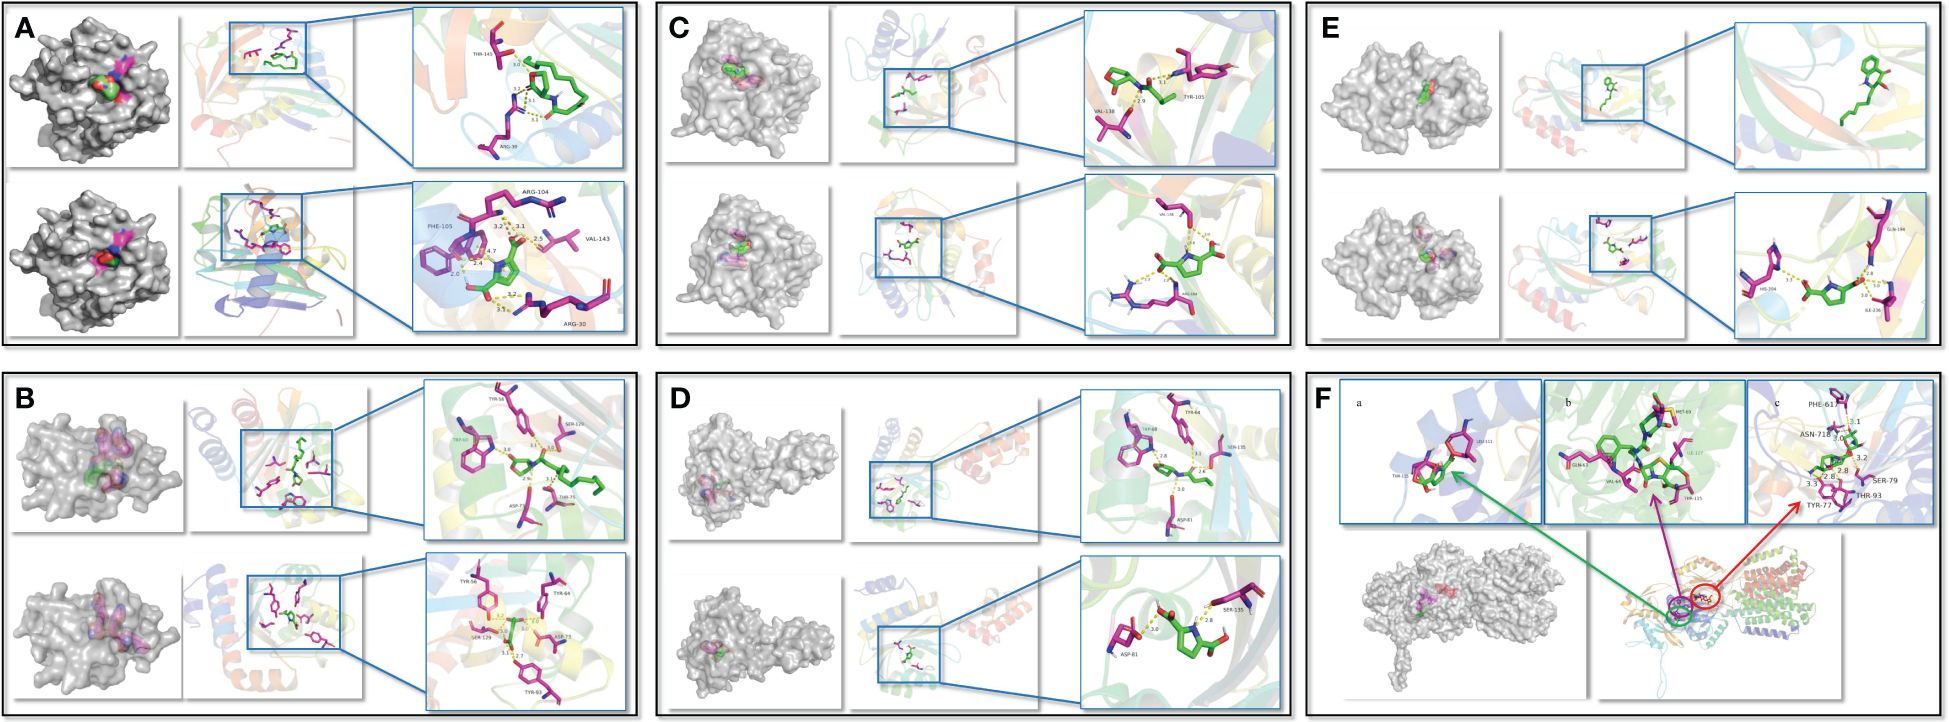
Figure 7 Interactions between QS receptor proteins and various ligands. (A) LasI binding to 3-oxo-C12-HSL and PT22. (B) LasR binding to 3-oxo-C12-HSL and PT22. (C) RhlI binding to C4-HSL and PT22. (D) RhlR binding to C4-HSL and PT22. (E) PqsR binding to NHQ and PT22. (F) MexB binding to PT22 (a), piperacillin (b), and gentamycin (c). The receptor proteins are indicated in gray, and the interaction sites are indicated in multicolor. The hydrogen bonds are shown as yellow dotted lines. The ligands are shown as green sticks, and the interacted residues are shown as magenta sticks. QS, quorum sensing.
Compared with signaling molecular, PT22 required less docking energy for docking with RhlR but more docking energy for docking with LasR and PqsR, indicating that PT22 can form stable complexes with RhlR as well as exhibit better affinity for RhlR than C4-HSL. There is approximately equal required energy for PT22 and 3-oxo-C12-HSL binding to LasI, and PT22 and C4-HSL binding to RhlI. The lower energy required for the binding of PT22 to LasR compared to RhlR and PqsR suggested that it is easier for PT22 and LasR to form a complex than that of PqsR and RhlR.
Microdilution checkerboard analysisThe effects of the antibiotics (gentamycin and piperacillin) used in combination with PT22 against P. aeruginosa PAO1 were evaluated by FICI values. The FICs of PT22, gentamycin, and piperacillin were 0.50 mg/mL, 4.00, and 4.00 μg/mL, respectively. The FICIs of antibiotics (gentamycin and piperacillin) in combination with PT22 were 0.75, indicating that both gentamycin and piperacillin combined with PT22 have additive interaction against P. aeruginosa PAO1 (Table 1).
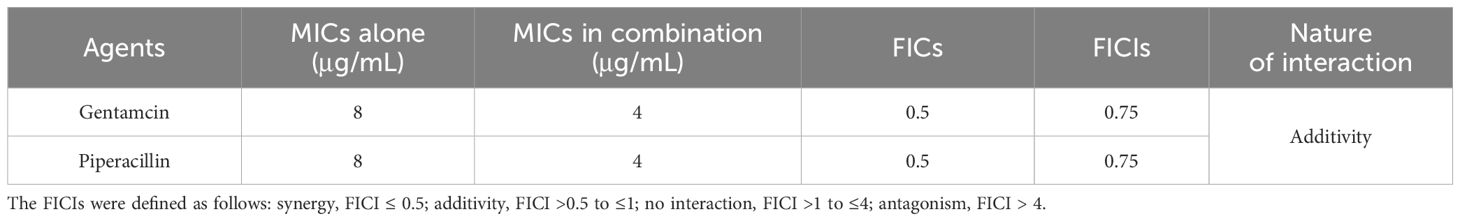
Table 1 Fractional inhibitory concentrations (FICs) and FIC indexes (FICIs) for testing synergy between PT22 and antibiotics against Pseudomonas aeruginosa PAO1.
Inhibition and eradication of biofilmThe biofilm biomass treated with PT22 (0.50 mg/mL, 0.75 mg/mL, and 1.00 mg/mL) was approximately reduced by 27.89%, 47.59%, and 64.74%, respectively, compared with negative control (Figure 8A). Hordenine (1.00 mg/mL) presented significant depletion in biofilms by 75.19%. Furthermore, after being treated with PT22 (0.50 mg/mL, 0.75 mg/mL, and 1.00 mg/mL), the amount of viable cells in the biofilms had a significant reduction compared to the negative control. The inhibition rate was 26.00%, 36.67%, and 46.67% (Figure 8B). The amount of viable cells treated with hordenine (1.00 mg/mL) was reduced by 50.00%. The biofilm biomass exposed to gentamycin (4.00 μg/mL) and piperacillin (4.00 μg/mL) was remarkably decreased by 79.47% and 63.24%, respectively. Interestingly, after exposure to gentamycin (4.00 μg/mL) + PT22 (0.50 mg/mL) and piperacillin (4.00 μg/mL) + PT22 (0.50 mg/mL), the biofilm biomass was significantly reduced by 95.06% and 90.16%, respectively, compared with negative control, as well as reduced by 76.00% and 78.46% compared with gentamycin (4.00 μg/mL) and piperacillin (4.00 μg/mL) alone. The biofilm biomass treated with gentamycin (4.00 μg/mL) was significantly reduced compared with piperacillin (4.00 μg/mL). There is no significant difference in inhibiting biofilm formation between treatments of gentamycin (4.00 μg/mL) + PT22 (0.50 mg/mL) and piperacillin (4.00 μg/mL) + PT22 (0.50 mg/mL) (Figure 8C). Compared with the control, PT22 (0.50 mg/mL), gentamycin (4.00 μg/mL), piperacillin (4.00 μg/mL), gentamycin (4.00 μg/mL) + PT22 (0.50 mg/mL), and piperacillin (4.00 μg/mL) + PT22 (0.50 mg/mL) treatments resulted in reductions in the amount of viable cells in biofilms by 15.91%, 52.27%, 31.81%, 70.45%, and 59.47%, respectively. After being treated with gentamycin (4.00 μg/mL) + PT22 (0.50 mg/mL) and piperacillin (4.00 μg/mL) + PT22 (0.50 mg/mL), the viable cells in biofilms were significantly reduced by 38.10% and 40.55%, respectively, compared with gentamycin (4.00 μg/mL) and piperacillin (4.00 μg/mL) alone (Figure 8D). To assess whether PT22 could enhance mature biofilm sensitivity to antibiotics, the overnight mature biofilms were exposed to PT22 (0.50 mg/mL), gentamycin (4.00 μg/mL), piperacillin (4.00 μg/mL), gentamycin (4.00 μg/mL) + PT22 (0.50 mg/mL), and piperacillin (4.00 μg/mL) + PT22 (0.50 mg/mL) as well as DMSO (negative control) for 24 h. The mature biofilms exposed to gentamycin (4.00 μg/mL) + PT22 (0.50 mg/mL) and piperacillin (4.00 μg/mL) + PT22 (0.50 mg/mL) were dramatically decreased by 93.73% and 90.11% compared with negative control, as well as 82.14% and 80.78% compared with gentamycin (4.00 μg/mL) and piperacillin (4.00 μg/mL) alone, respectively. The mature biofilms treated with gentamycin (4.00 μg/mL) were significantly reduced compared with piperacillin (4.00 μg/mL). There is no significant difference in erasing mature biofilms between those treated with gentamycin (4.00 μg/mL) + PT22 (0.50 mg/mL) and piperacillin (4.00 μg/mL) + PT22 (0.50 mg/mL) (Figure 8E). Compared with the control, the amount of viable cells in mature biofilms exposed to gentamycin (4.00 μg/mL) + PT22 (0.50 mg/mL) and piperacillin (4.00 μg/mL) + PT22 (0.50 mg/mL) was reduced by 61.33% and 50.52% and reduced by 31.06% and 40.58% compared with gentamycin (4.00 μg/mL) and piperacillin (4.00 μg/mL) alone, respectively (Figure 8F). The results suggested that PT22 enhanced the cytosensitivity of mature biofilm to gentamycin and piperacillin.
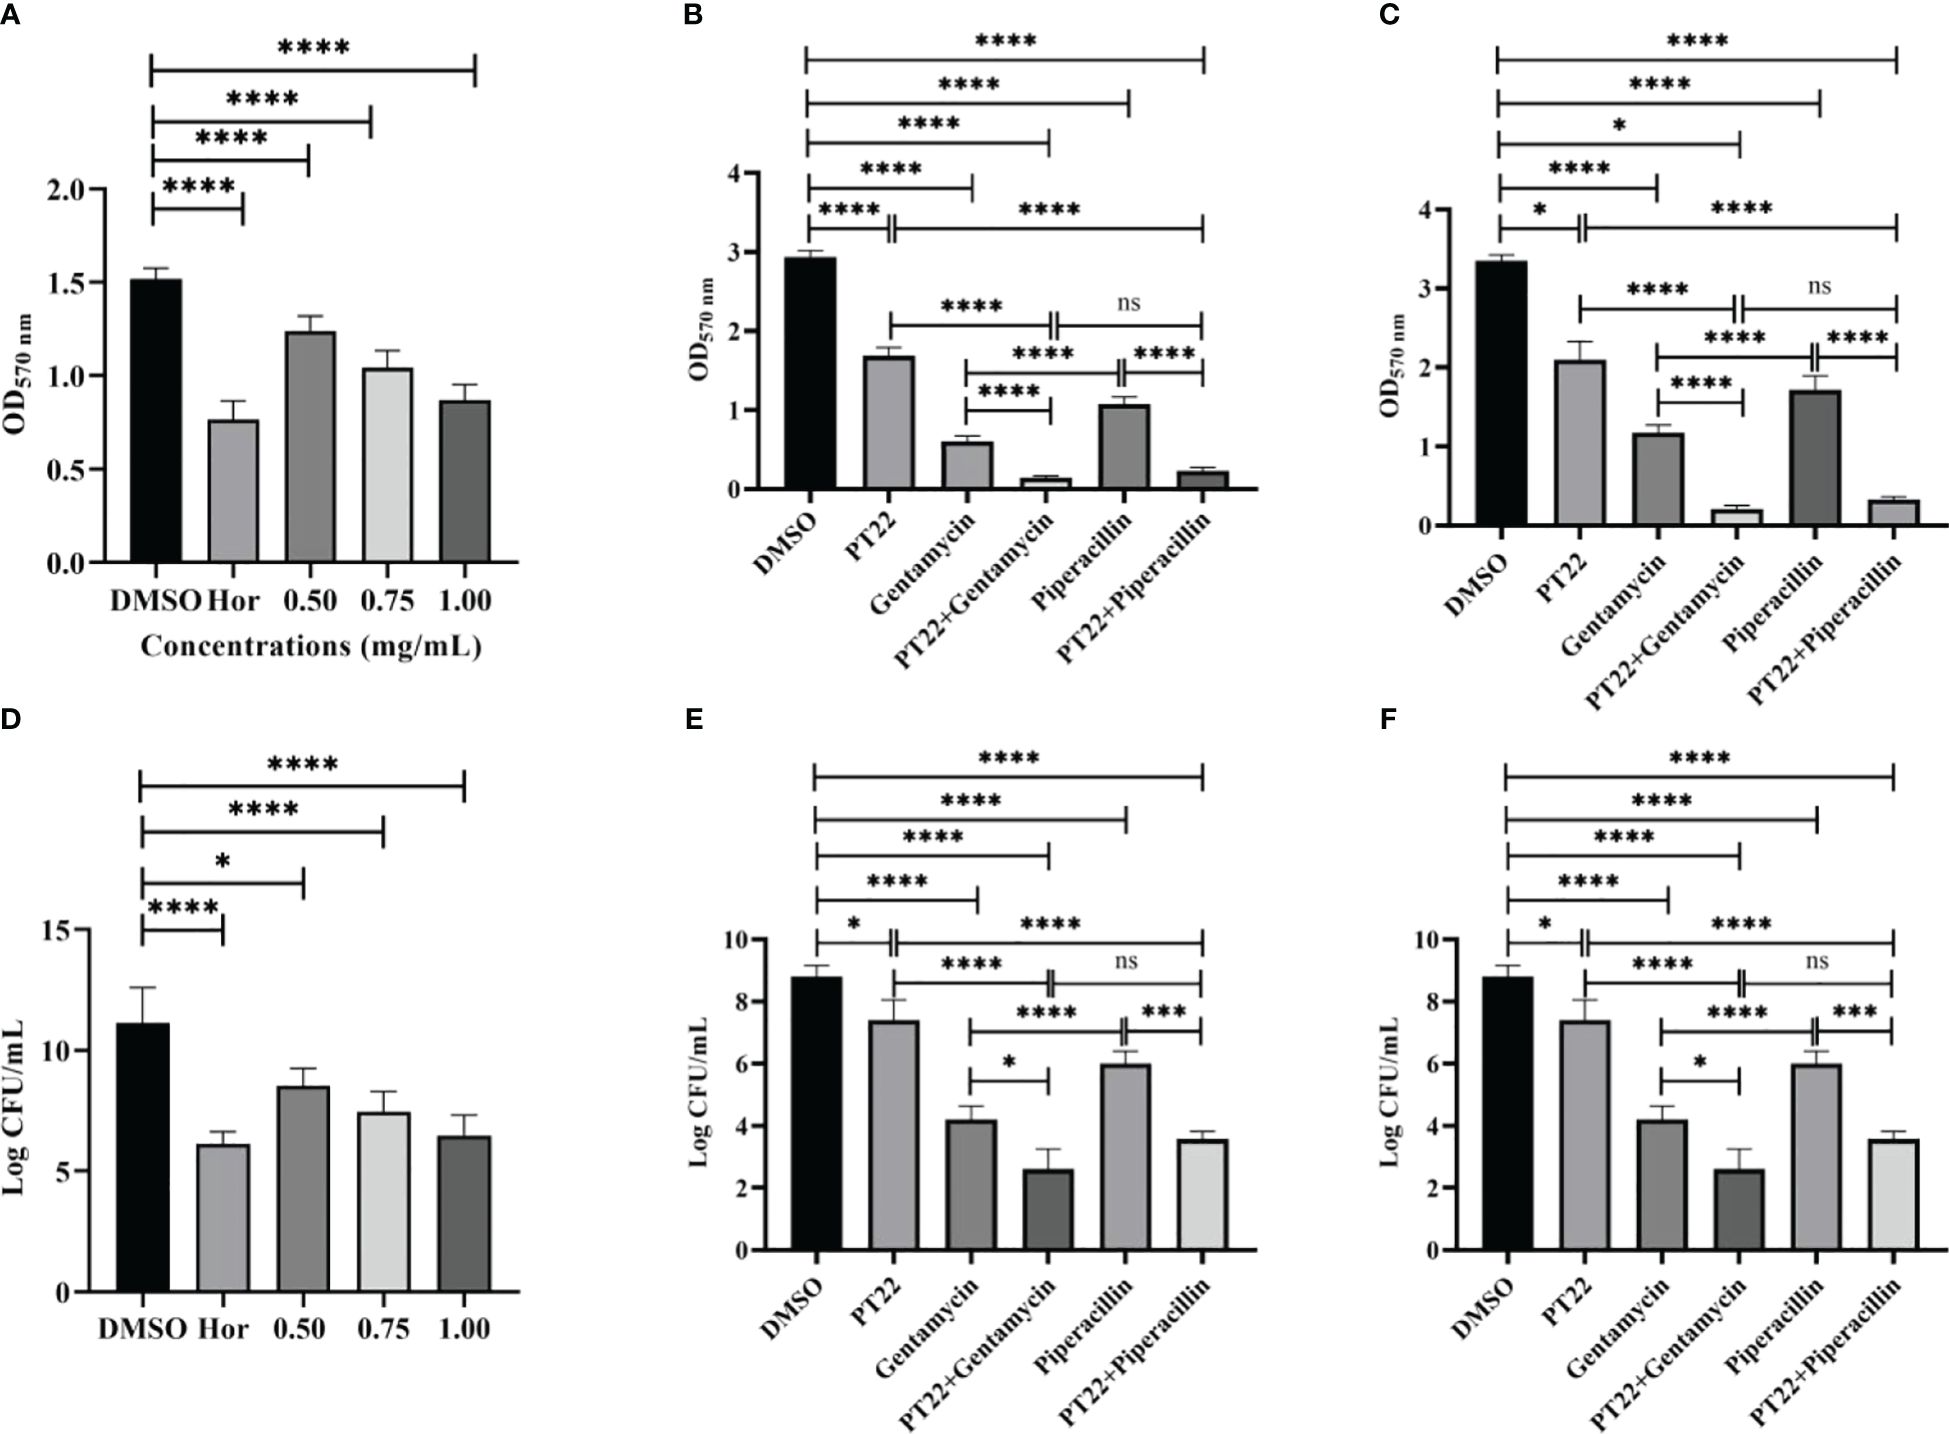
Figure 8 Effects of PT22 (0.50 mg/mL, 0.75 mg/mL, and 1.00 mg/mL) on biofilm formation of Pseudomonas aeruginosa PAO1 (A, B). Hordenine and DMSO were served as positive and negative controls, respectively. Additive effects of PT22 (0.5 mg/mL) and gentamycin and piperacillin on inhibition (C, D) and eradication (E, F) of biofilm of P. aeruginosa PAO1. *p < 0.05, ***p < 0.001 and ****p < 0.0001 compared to the DMSO group by one-way ANOVA. DMSO, dimethyl sulfoxide. “ns” means no significance.
The inhibitory effects of PT22 on biofilms were confirmed visually by SEM and CLSM images. The control group formed thick dense and heterogeneous masses while being treated with PT22, and the biofilms became looser, scattered, and broken (Figure 9A). The CLSM results are consistent with the results by SEM (Figure 9B). The biofilms treated with PT22, gentamycin, piperacillin, gentamycin + PT22, and piperacillin + PT22 presented reductions in biofilm formation (Figures 9C, E). The quantity of viable cells and the extracellular substrate of biofilms treated with gentamycin + PT22 were significantly reduced compared with gentamycin alone (Figures 9C c, d, 9E c, d). After being treated with piperacillin + PT22, the quantity of viable cells was significantly reduced, and the bacterial mitosis was blocked, resulting in the formation of filamentous polymers and contraction of the cytoplasm compared with piperacillin alone (Figures 9C e, f and 9E e, f). The same results were observed in which biofilms treated with PT22, gentamycin, piperacillin, gentamycin + PT22, and piperacillin + PT22 presented a reduction in mature biofilm (Figures 9D, F). The results demonstrated that PT22 dramatically enhanced the bactericidal effects of gentamycin and piperacillin on P. aeruginosa PAO1.
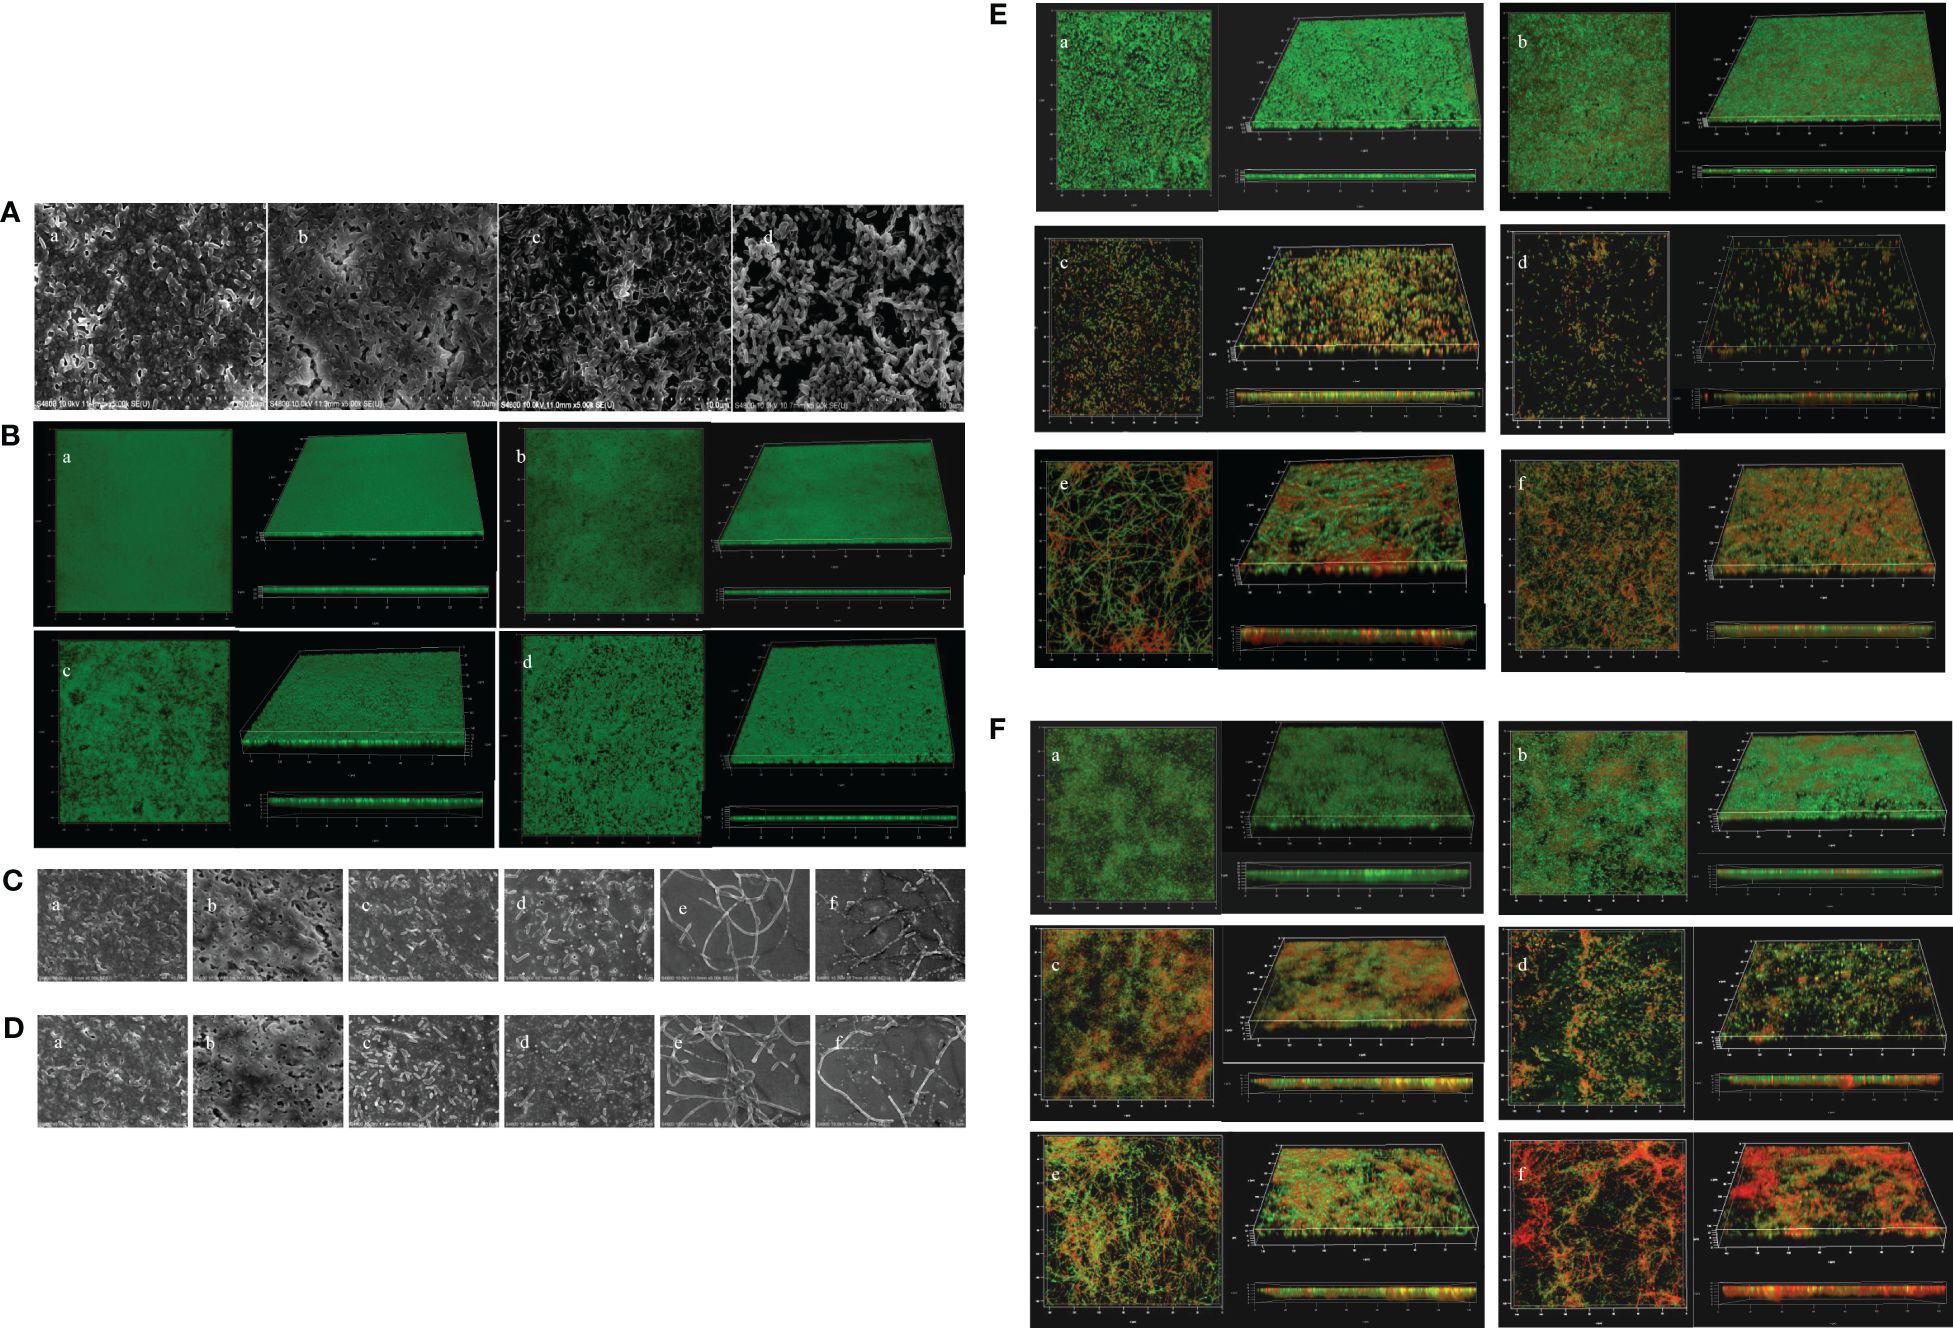
Figure 9 Microscopy images of Pseudomonas aeruginosa PAO1 biofilms treated with PT22. SEM images of biofilms treated with DMSO (a), 0.50 (b), 0.75 (c), and 1.00 mg/mL (d) (A). CLSM images of biofilms treated with DMSO (a), 0.50 (b), 0.75 (c), and 1.00 mg/mL (d) (B). Microscopy images of additive effects on biofilm treated with PT22 (0.5 mg/mL) and gentamycin and piperacillin on biofilm formation (C, E) and biofilm eradication (D, F) of P. aeruginosa PAO1. SEM images of biofilm (C) treated with DMSO (a), PT22 (0.50 mg/mL) (b), gentamycin (c), PT22 + gentamycin (d), piperacillin (e), and PT22 + piperacillin (f) (C, D). CLSM images of biofilms treated with DMSO (a), PT22 (0.50 mg/mL) (b), gentamycin (c), PT22 + gentamycin (d), piperacillin (e), and PT22 + piperacillin (f) (E, F). DMSO, dimethyl sulfoxide; CLSM, confocal laser scanning microscopy.
Cytotoxicity of PT22 in vitroThe cytotoxic effects of PT22 were determined using cck-8 kit with murine macrophage RAW 264.7 cells. The cell viability was measured after 24-h incubation time. PT22 was observed to have cytotoxicity at their working concentrations (0.50 mg/mL, 0.75 mg/mL, and 1.00 mg/mL; Figure 10). This result indicates that PT22 could be further used for subsequent in vivo experiments.
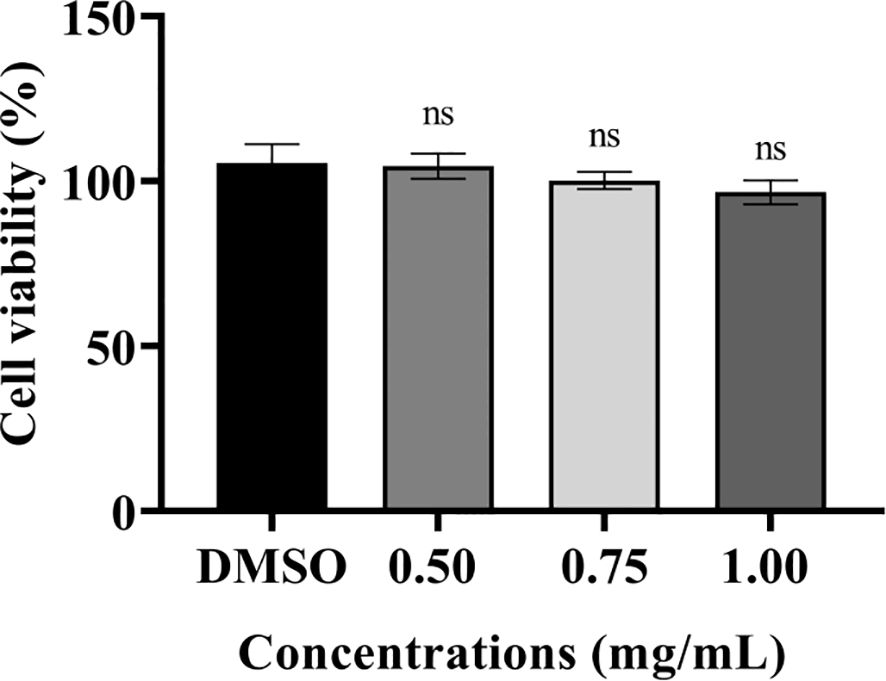
Figure 10 Cytotoxicity of PT22 in vitro on murine macrophages RAW 264.7 cells. DMSO was used as negative control. “ns” means no significance compared to the DMSO group by one-way ANOVA. DMSO, dimethyl sulfoxide.
G. mellonella survival ratesThe G. mellonella larvae were used to evaluate the preservation effect of PT22, antibiotics, and the combination of PT22 and antibiotics on P. aeruginosa PAO1 infection (Figure 11). In the control group, gentamycin monotherapy group, and piperacillin monotherapy group, almost no survival rates were observed in P. aeruginosa PAO1 infected within 36 h. However, the inf
留言 (0)