
記住我


The study population was derived from the PIC database, which is an open, single-center, retrospective electronic medical record database developed by the Children’s Hospital, Zhejiang University School of Medicine (ZUCH). Detailed information about this database can be found on the official website (http://pic.nbscn.org) as well as in previous research studies [17,18,19,20,21]. In brief, the ZUCH, with more than 1900 beds, is the largest comprehensive pediatric medical center in Zhejiang Province, and it has 119 critical care beds in 5 ICUs, including general ICU (GICU), pediatric ICU (PICU), surgical ICU (SICU), cardiac ICU (CICU), and neonatal ICU (NICU). The PIC database contains clinical data from 12,881 pediatric patients admitted to any ICU in the ZUCH from 2010 to 2018. The clinical data included laboratory tests, prescriptions, diagnoses, physical examinations, surgical procedures, and admission and discharge date. The project has been approved by the Ethics Committee of the ZUCH, and the requirement of individual patients informed consent was waived because the retrospective nature of the study and all personalized information has been de-identified.
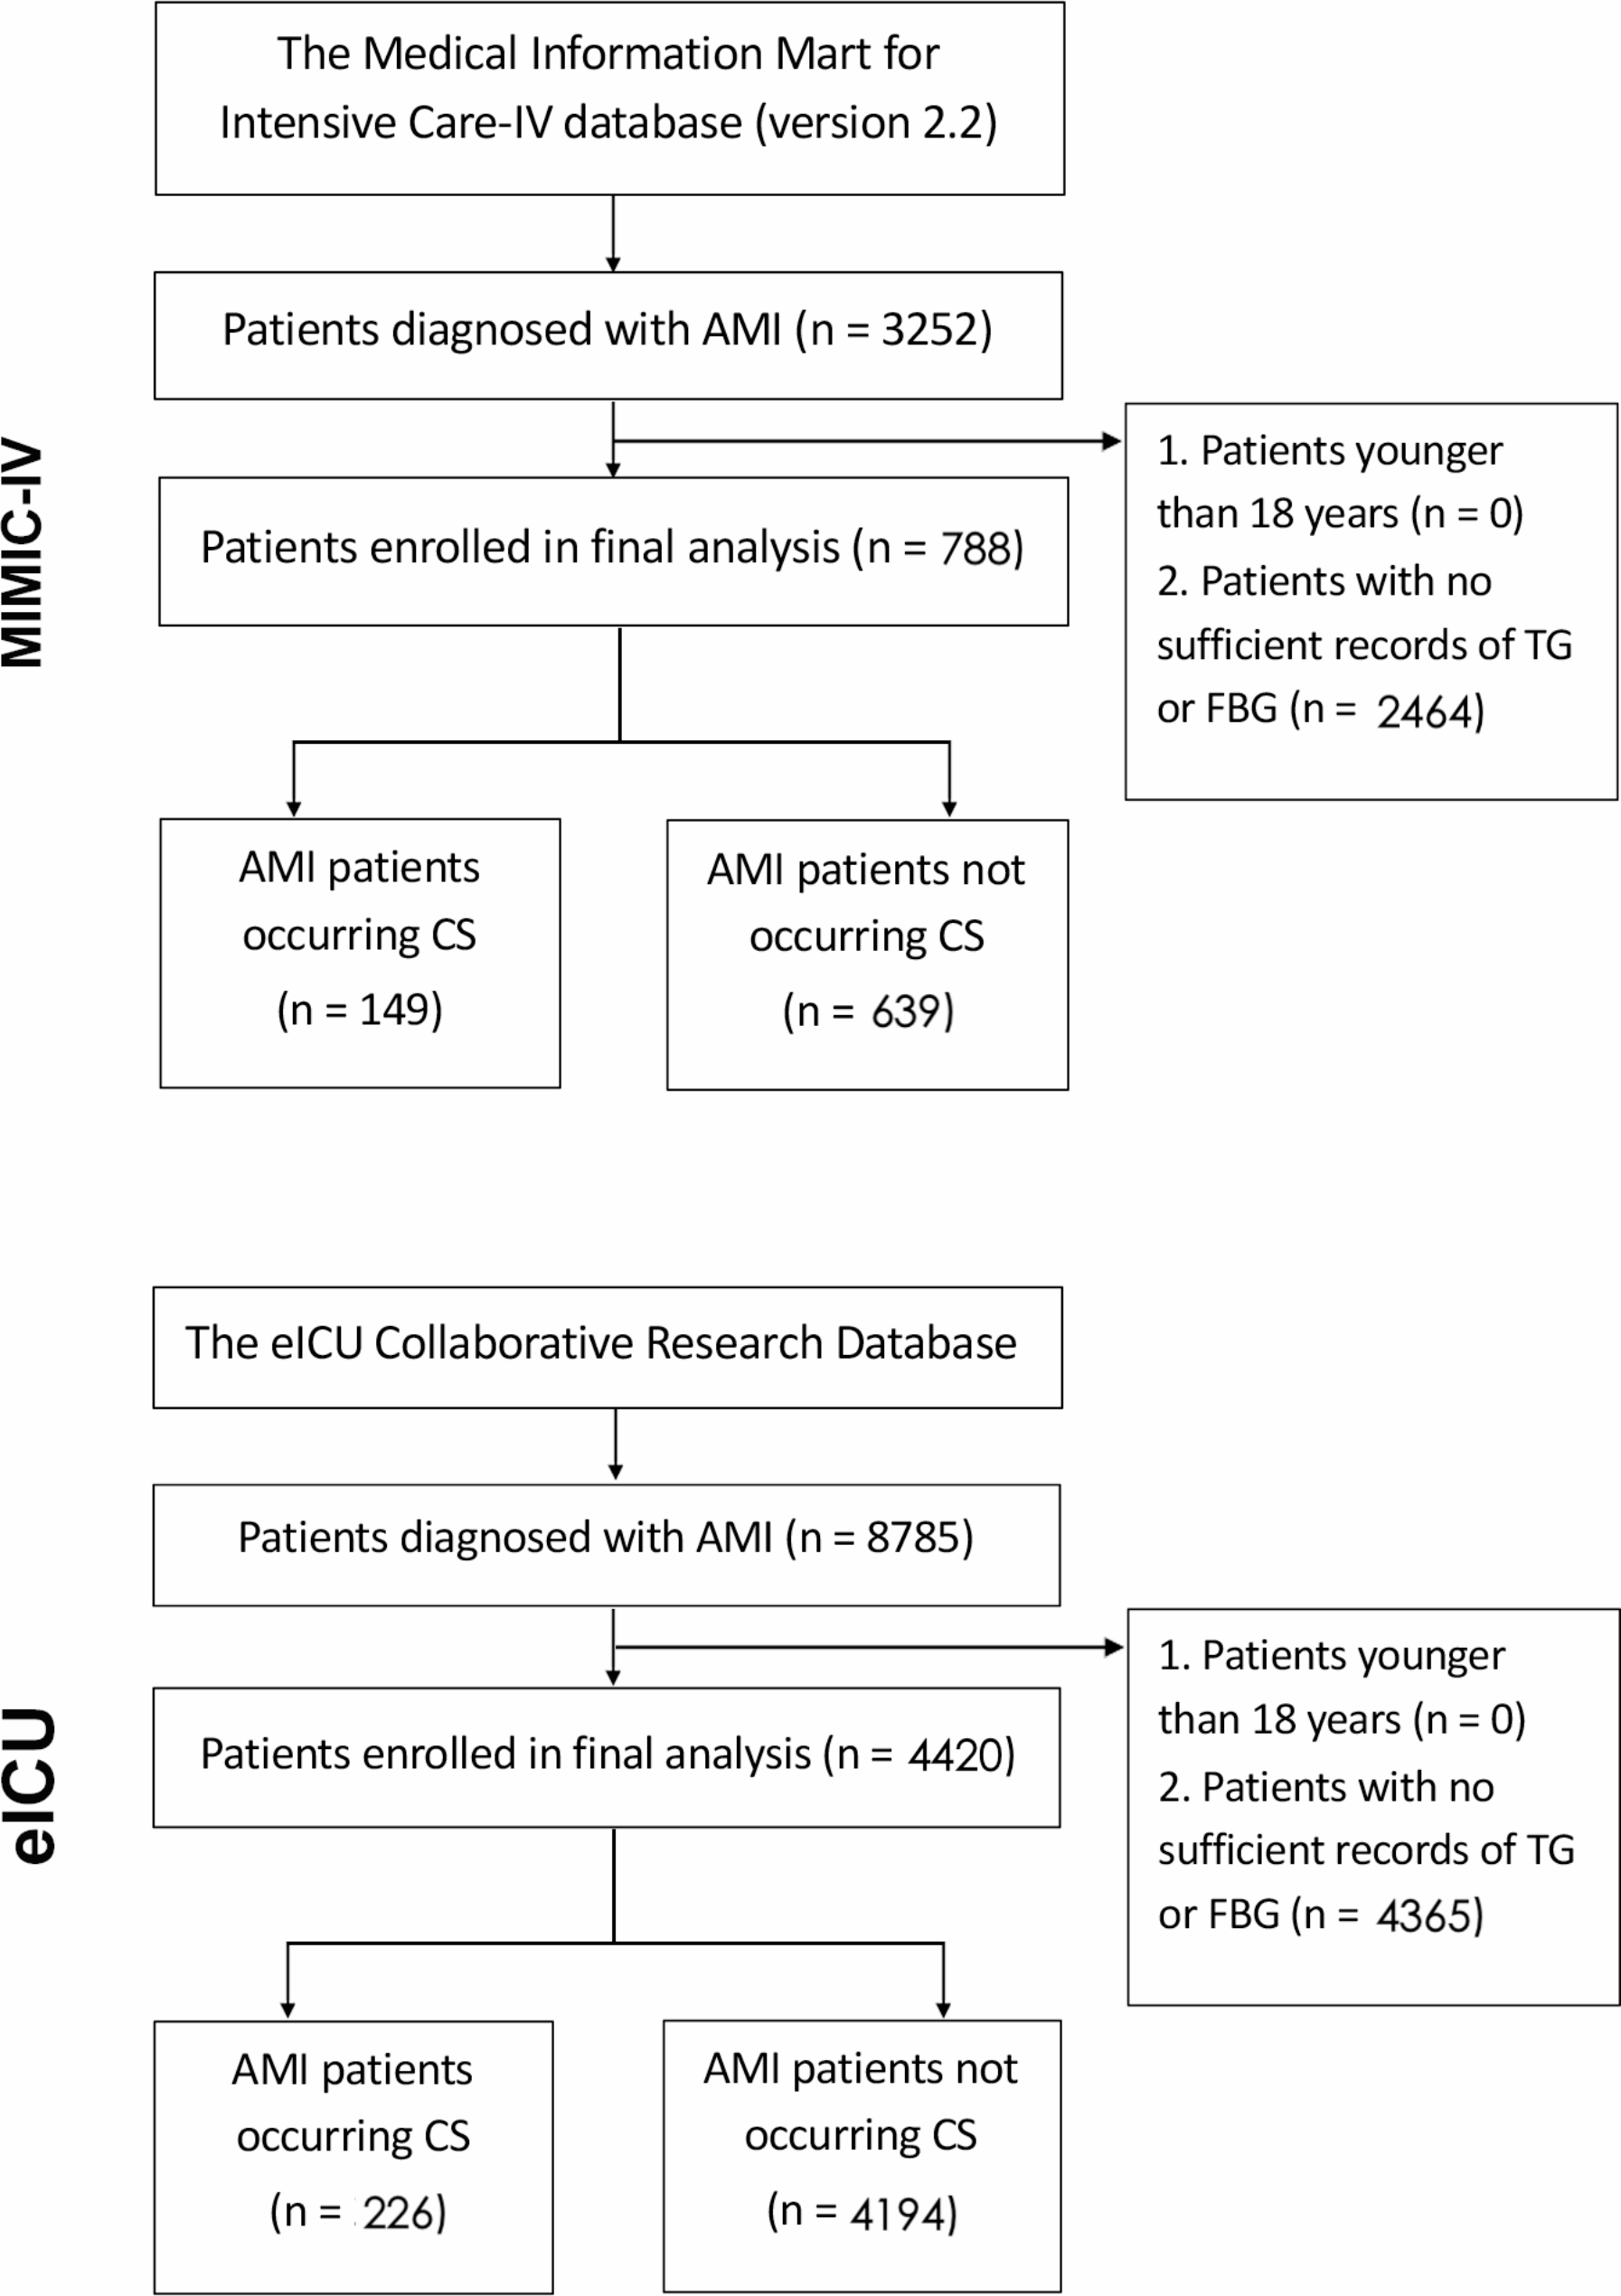
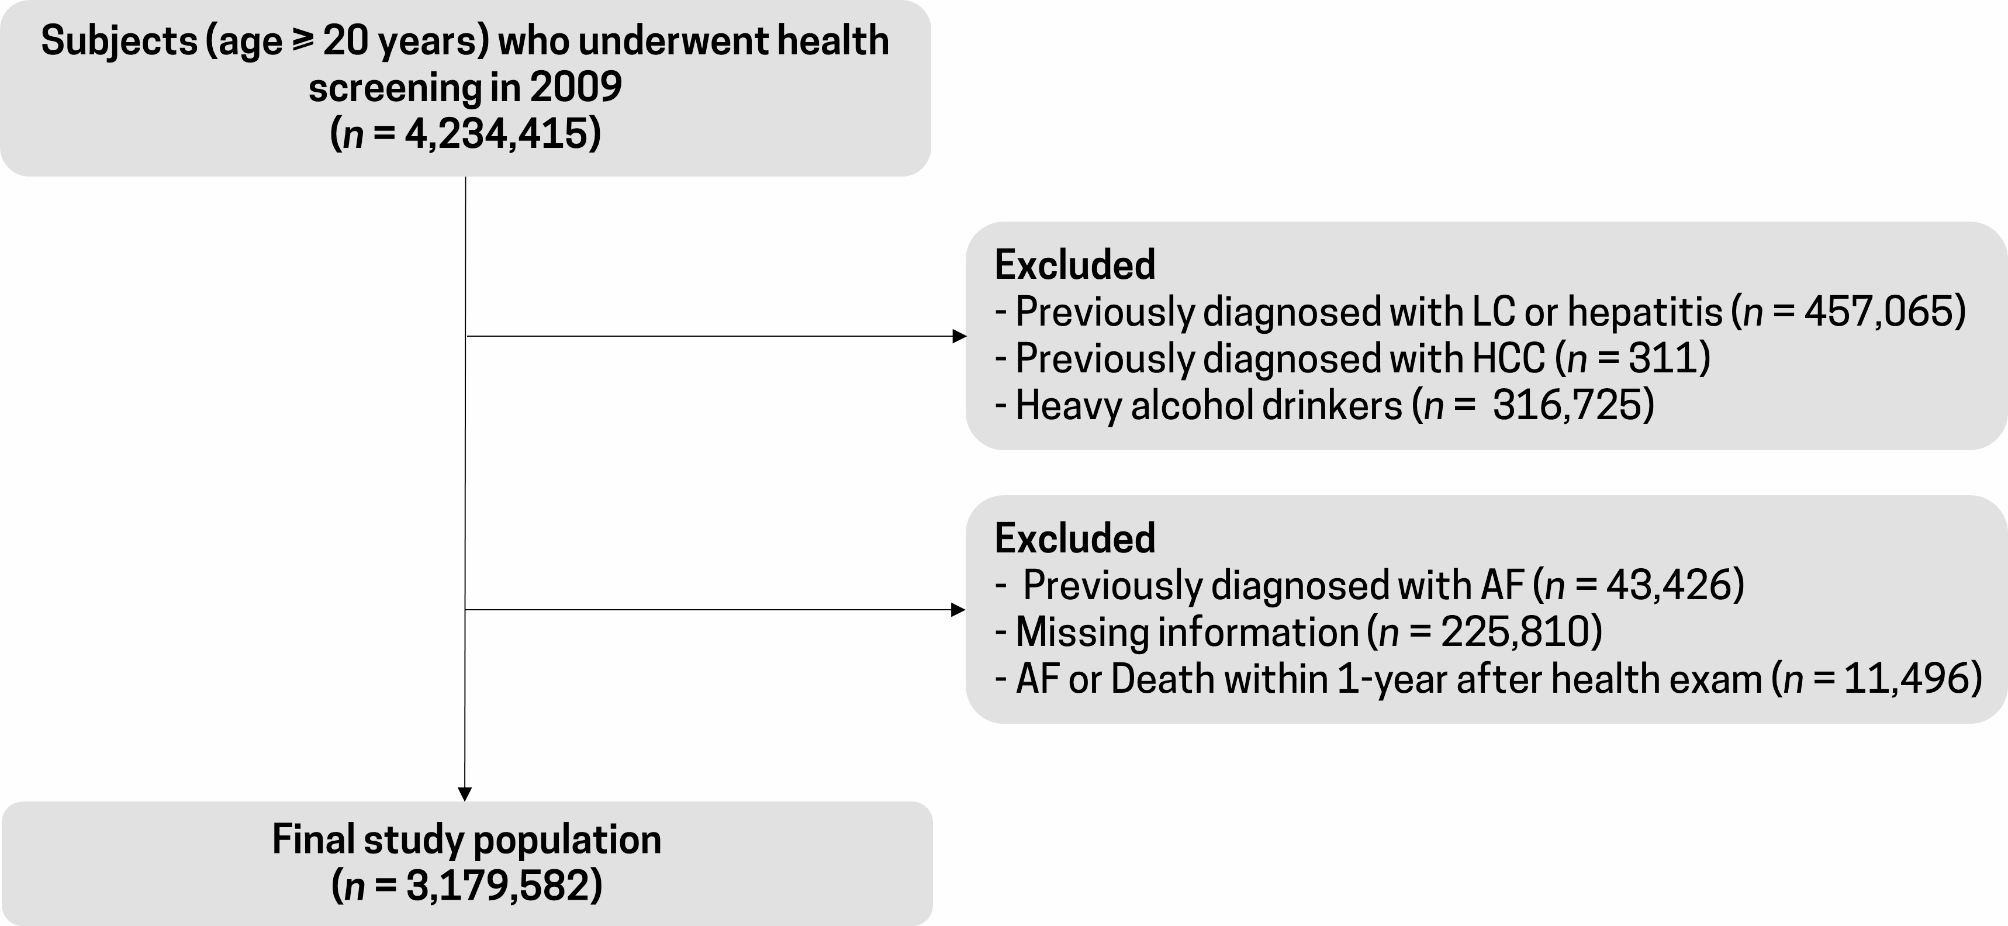
This study included all 12,881 patients from the PIC database. The exclusion criteria were as follows: (a) missing TyG index (n = 4335); (b) age ≤ 28 days (n = 2590); (c) length of hospital stay (LOS hospital) ≤ 2 days (n = 250). Finally, a total of 5706 pediatric patients were included in the final analysis. The flowchart of the study population is shown in Fig. 1.
Fig. 1
Flowchart of study population selection
Clinical variablesThe study variables included demographic information, LOS hospital, length of ICU stay (LOS ICU), ICU type, medication treatment, clinical diagnoses, surgical procedures, and laboratory tests. The exposure window of all laboratory tests, medication treatments, and surgical procedures was defined within 48 h after admission. If the laboratory tests were measured multiple times after admission, data from the first time were used. Clinical diagnoses were determined based on International Classification of Diseases 10 (ICD-10) codes.
Exposure, outcomes, and follow-upThe TyG index was calculated using the equation: ln (TG (mg/dL) × FBG (mg/dL)/2) [22]. The primary outcome of this study was 30-day in-hospital all-cause mortality after admission, and the secondary outcome was 30-day in-ICU all-cause mortality, namely, death occurring in ICU after admission. For the primary outcome, patients were followed up until death, the 30th days after admission, or discharged from the hospital, whichever came first. For secondary outcome, patients were followed up until death, the 30th days after admission, or discharged from ICU, whichever came first.
Handling of missing valuesIn the dataset, there were missing values in blood urea nitrogen (BUN, n = 1), cystatin C (n = 1), serum creatinine (SCr, n = 3), hemoglobin (n = 10), white blood cell count (WBC, n = 61), platelets (n = 61), high-sensitivity C-reactive protein (hs-CRP, n = 67), neutrophil percentage (n = 73), and lymphocyte percentage (n = 116). We performed imputation of missing values using the random forest method in the R package RandomForest [23].
Statistical analysisContinuous variables were presented as mean ± standard deviation (SD) or median [interquartile range (IQR)] and compared between groups using analysis of variance (ANOVA) and the Kruskal–Wallis test. Categorical variables were presented as frequencies (percentages) and compared between groups using the chi-square test.
We explored the association between the TyG index and mortality using univariate and multivariate Cox proportional hazards models, and hazard ratios (HRs) were expressed with their 95% confidence intervals (95% CIs). The Model 1 adjusted for age and sex, ICU types (including GICU, PICU, SICU, CICU, and NICU), surgical procedures (including cardiac surgery, neurosurgery, gastrointestinal surgery, respiratory system surgery, and other surgeries), congenital valvular heart disease, congenital heart disease, malignancy, pneumonia, sepsis, shock, use of vasopressors, WBC, lymphocyte percentage, neutrophil percentage, and hs-CRP. Model 2 further adjusted for other biochemical markers including serum albumin, total cholesterol, hemoglobin, platelets, BUN, cystatin C, and SCr. We used restricted cubic spline (RCS) Cox regression (adjusted for variables in Model 2, with 3 knots at the 10th, 50th, and 90th percentiles) to explore the dose–response relationship between the TyG index and the 30-day in-hospital and in-ICU all-cause mortality. The median of the TyG index was adopted as our reference, a widely accepted approach due to the absence of a recognized standard for the TyG index [24, 25]. Finally, based on the results of RCS analysis, we determined the optimal threshold and conducted threshold analysis using two-piecewise Cox regression to explore the relationship between the TyG index and the endpoints.
Subgroup analysesTo explore potential effect modifiers, we performed several subgroup analyses. Patients were stratified by age (1 month to 1 year, 1 year to 5 year, and ≥ 5 years), sex (male and female), ICU types (GICU, PICU, and other ICU), surgical procedures (yes or no), congenital heart disease (yes or no), sepsis (yes or no), and use of vasopressors (yes or no).
Sensitivity analysesThe robustness of results was further validated by several sensitivity analyses. First, we performed sensitivity analyses 1, 2, and 3 to minimize reverse causation between the TyG index and short-term mortality. Then, we performed sensitivity analyses 4 to explore whether missing values had an impact on the primary results. Sensitivity analysis 1: we excluded patients with severe conditions, including those with sepsis, shock, pneumonia, and malignancy. Sensitivity analysis 2: based on sensitivity analysis 1, we further excluded patients diagnosed with acute kidney injury (AKI) during hospital stay. AKI was identified using Kidney Disease Improving Global Outcomes (KDIGO) SCr criteria, defined as SCr during the follow-up ≥ 1.5 fold baseline SCr or need for dialysis [26, 27]. Sensitivity analysis 3: we excluded patients with LOS hospital less than 3 days. Sensitivity analysis 4: we reanalyzed using the dataset before imputation.
Additional analysesThe E-value analysis has been widely used in observational studies to assess the impact of unmeasured or uncontrolled confounding on study outcomes [28, 29]. It evaluated the minimum strength of association that an unmeasured confounder would need to have with both the exposure and the outcome to nullify the observed exposure-outcome association. Briefly, if the relative risk between unmeasured confounders, mortality and the TyG index over the computed E-value, residual confounding may be a plausible explanation for the detected association.
All analyses were conducted using R software (version 4.1.2, http://www.r-project.org/). A two-tailed P value less than 0.05 was considered statistically significant.
留言 (0)