
記住我


Elucidating the mechanisms underlying information processing in the brain represents a great challenge in neuroscience. In parallel to collecting data with experiments, building brain models has proven to be a powerful approach to enable in-silico analysis and provide a framework for understanding information processing in the brain. Macroscopic models (Kawato, 1999; Frank et al., 2001; Norman and O'Reilly, 2003; Walther and Koch, 2006) describe information flow at the functional level and present an overview of neural processing. In contrast, spiking neuronal network (SNN) models emulate the brain at the cellular and synaptic level and provide their in-silico counterparts, which are more tractable and easier to manipulate. From an engineering perspective, properly built SNN models are expected to be capable of intelligent information processing equivalent to the brain. Silicon neuronal network (SiNN) chips, which are highly power-efficient neuromorphic hardware optimized for SNN models, have already been developed (Merolla et al., 2014; Qiao et al., 2015; Davies et al., 2018). Therefore, they have great potential for next-generation artificial intelligence (AI) applications.
The structure of the brain is highly diverse, which makes it demanding to capture the comprehensible rules about the network topology. In addition, a wide variety of neuronal and synaptic properties has been reported. The data-driven approach intends to replicate the brain by semi-automatically incorporating vast amounts of anatomical and physiological data. Several large-scale data-driven SNN models (Markram et al., 2015; Bezaire et al., 2016; Ecker et al., 2020) that reproduce a part of the mammalian cortex and hippocampus have been built. They were designed to replicate the network topology, neuronal anatomy and electrophysiology, and synaptic properties, and they successfully reproduced the characteristic spiking activities seen in the target regions. However, in mammalian brains, the considerable number of neurons makes it challenging to measure the exact connection topology between the neurons. Hence, the network topology was inferred based on statistical data. In addition, because each brain region closely interacts with various other brain regions, it is not trivial to understand the specific function of the target region. Generally, data-driven models employ the ionic-conductance-based neuronal models, which can reproduce arbitrary electrophysiological properties but incur enormous computational costs. For example, the model in Bezaire et al. (2016) runs on a supercomputer consisting of 3,488 processors, and its simulation speed is 1,600 times slower than real-time. Moreover, these models are not suitable for implementation on SiNNs because they involve complex calculation processes that require enormous circuit resources.
In this study, we built a data-driven SNN model for the olfactory nervous system of Drosophila melanogaster (fruit fly). The system is a relatively small (~2,200 neurons) network having a known function, whose complete network topology, or connectome, is available. The electrophysiological activity of neurons was reproduced by using the piecewise quadratic neuron (PQN) model, which is a lightweight neuron model suitable for digital arithmetic circuit implementations (Nanami and Kohno, 2016a,b, 2023; Nanami et al., 2016, 2017, 2018).
The PQN model was adopted to reduce the computational cost and enable the SNN model to be run on a SiNN chip. It focuses on reproducing the key dynamics behind neuronal activities with lightweight calculations. The model is designed using the dimension reduction techniques of nonlinear dynamics such that the dynamical structure of the activity of the target neuron is preserved. Unlike integrate-and-fire (I&F) based models, such as the leaky I&F model, Izhikevich (IZH) model (Izhikevich, 2003), and adaptive exponential I&F model (Brette and Gerstner, 2005), the dynamics in the neuronal spike are not replaced by a resetting of the membrane potential. I&F-based models are generally more lightweight than the PQN model. However, they have been reported to have limitations in the reproducibility of neuronal activities. For example, because their spike amplitudes are fixed, they cannot reproduce the propagation of spike intensity observed in some brain regions including the hippocampus (Alle and Geiger, 2006). In addition, the IZH model can only reproduce spiking within a limited range of stimulus intensities (Nanami and Kohno, 2016b). Furthermore, the phase-resetting curve of the Class II mode in Hodgkin's classification (Hodgkin, 1948) of the IZH and AdEx models differs from the typical shape (Nanami and Kohno, 2023). In addition to the aforementioned advantages, the PQN model supports the efficient implementation on digital arithmetic circuits. Thus, the SNN model can be executed efficiently (power and speed) with a SiNN on field-programmable gate arrays (FPGAs) and application-specific integrated circuits (ASICs). The results in this study were obtained using a SiNN on an entry-level low-cost FPGA chip to demonstrate its potential for low-power brain-morphic artificial intelligence (AI) applications.
In recent years, brain-inspired AI has become popular, where spike-based machine learning (Yang and Chen, 2023a,b; Yang et al., 2023a,b) is studied mainly using I&F-based models. These studies built massively parallel information processing systems inspired by the brain's structure to enable advanced and robust information processing with low power consumption. In contrast, here we aim to provide an in silico platform that more faithfully reproduces neuronal connectivity and information processing in brain microcircuits, which is distinct from the objective of brain-inspired AI.
The fruit fly brain comprises 100,000 neurons. Moreover, its connectome was recently revealed (Scheffer et al., 2020). It is compact compared to the mammalian brain but capable of complex information processing. Its olfactory nervous system consists of brain regions including the antennal lobe and the mushroom body, the anatomy and physiology of which have been widely studied (Wilson, 2013; Modi et al., 2020). The function and activity of each type of neuron in these regions are better characterized in the context of sensory input and behavioral output than those of the mammalian cortex and hippocampus, enabling us to adequately verify the reproducibility of the model. However, previous modeling studies (Wessnitzer et al., 2012; Faghihi et al., 2017; Kennedy, 2019) (not data-driven) of the olfactory nervous system used simplified I&F-based neuron models, which did not fully reproduce the electrophysiological properties of each type of neurons. Specifically, they did not reproduce the characteristic spiking activities seen in the olfactory nervous system including (1) odor-evoked oscillatory firing in the projection neurons (PNs) and local neurons (LNs) (Tanaka et al., 2009), (2) absence of oscillations in Kenyon cells (KCs) (Turner et al., 2008), (3) different contributions of LN subclasses to the formation of oscillations (Tanaka et al., 2009), and (4) temporal dynamics of firing in mushroom body output neurons (MBONs) (Hige et al., 2015). Thus, it is uncertain whether they accurately capture information processing mechanisms in the olfactory nervous system. More sophisticated, ionic-conductance-based SNN models of the insect brain (Bazhenov et al., 2001a,b) had been built for the antennal lobe of locust. However, they were not data-driven and did not reproduce most of the aforementioned characteristics of spiking activities. This is likely because they modeled only PNs and LNs, and also lacked electrophysiological data on identified neurons. Here we built a model of a fly olfactory system incorporating the connectome data as well as neuronal and synaptic electrophysiological properties of neurons. Our model successfully reproduced not only the aforementioned characteristic spiking activities (1)–(4) of the constituent cells, but also olfactory associative plasticity, the primary function of the olfactory system. Although we did not intend to implement every single known neuron or connection in our model, this study lays a foundation for building lightweight data-driven SNN models and is expected to aid in understanding the brain and developing brain-morphic AI systems.
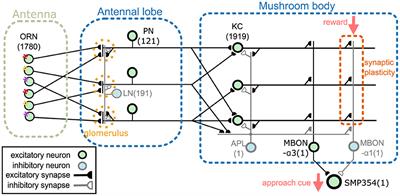
2 Methods 2.1 Network modelThis section provides an overview of the proposed network model. The model comprises an antenna, the antennal lobe, and the mushroom body (Figure 1). The antenna contains olfactory receptor neurons (ORNs), and the antennal lobe contains LNs and PNs (Stocker et al., 1990). KCs, an anterior paired lateral neuron (APL), and MBONs are present in the mushroom body (Aso et al., 2014a). The two MBONs, MBON-α1 and MBON-α3, project to SMP354 neuron, whose excitatory activity can trigger a series of olfactory approach behaviors including upwind steering and locomotion (Aso et al., 2023). ORNs, PNs, KCs, and MBON-α3 are cholinergic (Yasuyama and Salvaterra, 1999; Kazama and Wilson, 2008; Tanaka et al., 2008; Barnstedt et al., 2016) and form excitatory synapses. Some LNs are cholinergic (Shang et al., 2007) or glutamatergic (Das et al., 2011) and are considered as sources of excitatory or inhibitory input (Olsen et al., 2007; Shang et al., 2007). However, most LNs are GABAergic (Python and Stocker, 2002; Wilson and Laurent, 2005) and have been shown to provide inhibitory input (Olsen and Wilson, 2008; Root et al., 2008). Thus, in this model, all LNs were set as inhibitory. APL is GABAergic (Tanaka et al., 2008) and inhibitory, whereas MBON-α1 is glutaminergic (Aso et al., 2014a) and inhibitory. The numbers in Figure 1 represent the numbers of neurons implemented in the model. Synaptic connections were determined using the connectome database hemibrain v1.2.1 (HEM, 2020; Scheffer et al., 2020). Since this model targets the olfactory nervous system of the right hemisphere, we first obtained the number of neurons of each type in the right hemisphere from the hemibrain server using the NC function of the neuprint-python library. We then determined the connections between neurons using the fetch_neurons function of the neuprint-python that returns the number of synaptic connections between neurons. Connections with more than ten synapses were assumed to have sufficient strength, and their weight w was set to 1. Otherwise, w was set to 0. Note that the connections of LNs were determined based on a previous study (Seki et al., 2010).
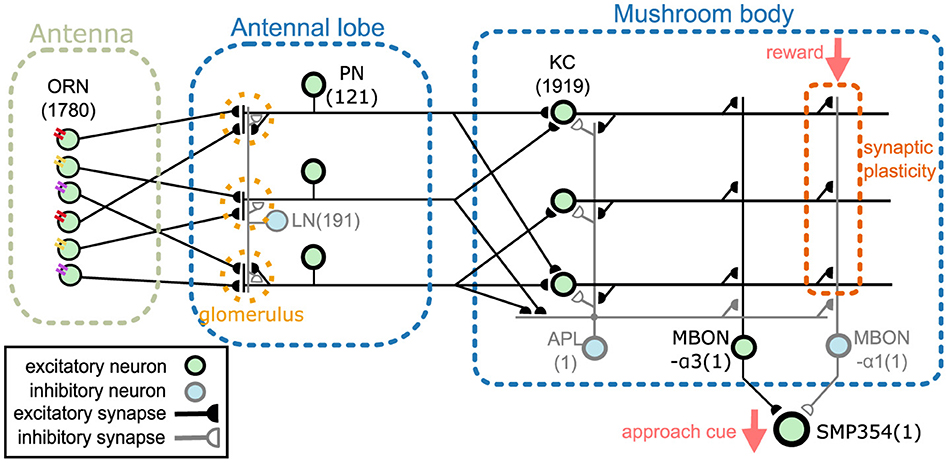
Figure 1. Network overview. The network comprises an antenna, the antennal lobe, and the mushroom body. ORNs, PNs, KCs, and MBON-α3 are excitatory neurons, whereas LNs, APL, and MBON-α1 are inhibitory neurons. SMP354 neuron receives excitatory and inhibitory input from the two MBONs and produces the approach cue. KC > MBON-α1 synapses can express synaptic plasticity, which is driven by the reward signal.
A variety of LN subclasses were reported (Chou et al., 2010; Seki et al., 2010) identified four subclasses, each with different spiking properties. However, the connectome database (HEM, 2020; Scheffer et al., 2020) does not describe which subclass each LN belongs to. Therefore, the connection of LNs was determined based on Seki et al. (2010) where the probabilities that each LN subclass has a connection to a certain glomerulus were shown. In the antennal lobe, glomeruli are neuropils comprising axons and dendrites of PNs, LNs, and ORNs. ORNs and PNs are generally connected to only one glomerulus. We first determined the subclasses to which 191 LNs belong. As the proportion of each subclass is unknown, we set the number of NP2426_class1 to 47 and the remaining to 48 to ensure that the distribution of subclasses was as even as possible. Next, for each LN, we randomly determined whether each LN innervates each glomerulus according to the innervation probabilities shown in Seki et al. (2010). If an ORN/PN and LN innervate the same glomerulus, the ORN/PN was assumed to make a synaptic connection onto the LN, and the synaptic weight w was set to 1. For example, LNs NP1227_class1 connect to glomerulus DA1 with a probability of 75% (Seki et al., 2010). Based on this probability, we determined whether each LN NP1227_class1 connects to glomerulus DA1.
Each ORN expresses one of the olfactory receptors, each of which has different odor selectivity. A previous study (D.Münch and Galizia, 2016) described a correspondence table between glomerulus and olfactory receptor (OR) types. We used this table and the glomerulus type for each ORN listed in the connectome database to determine the OR type for each ORN. When multiple OR types were assigned to a single glomerulus type, one OR was randomly selected.
Odors are first detected by ORNs on the antenna. ORNs express one of the ORs, each possessing different odor selectivity. ORNs extend their axons to the antennal lobe and project to PNs and LNs. As the firing activities of ORNs are the input data, they are not modeled. Figure 2A shows part of the connection structure from ORNs to PNs in the model. The black squares represent the presence of connections. On average, each ORN projects to 1.6 PNs, and each PN receives input from 24.0 ORNs. ORNs and PNs were sorted based on their glomerulus type, the borders of which are represented by blue lines. ORNs generally project to all the PNs in the same glomerulus type (Kazama and Wilson, 2009). This convergent projection is considered (Bhandawat et al., 2007) to enable PNs to produce reliable output by averaging the input from a large number of ORNs, whereas the responses of ORNs to odors are noisy and unreliable (Stocker et al., 1990). LNs receive inputs from a wide range of ORNs and extensively inhibit PNs and LNs. On average, each LN receives input from 1337.4 ORNs and inhibits 90.9 PNs. LNs are considered to contribute to the gain control of the input from ORNs (Olsen and Wilson, 2008) and to the generation of oscillations in the antennal lobe (Tanaka et al., 2009).
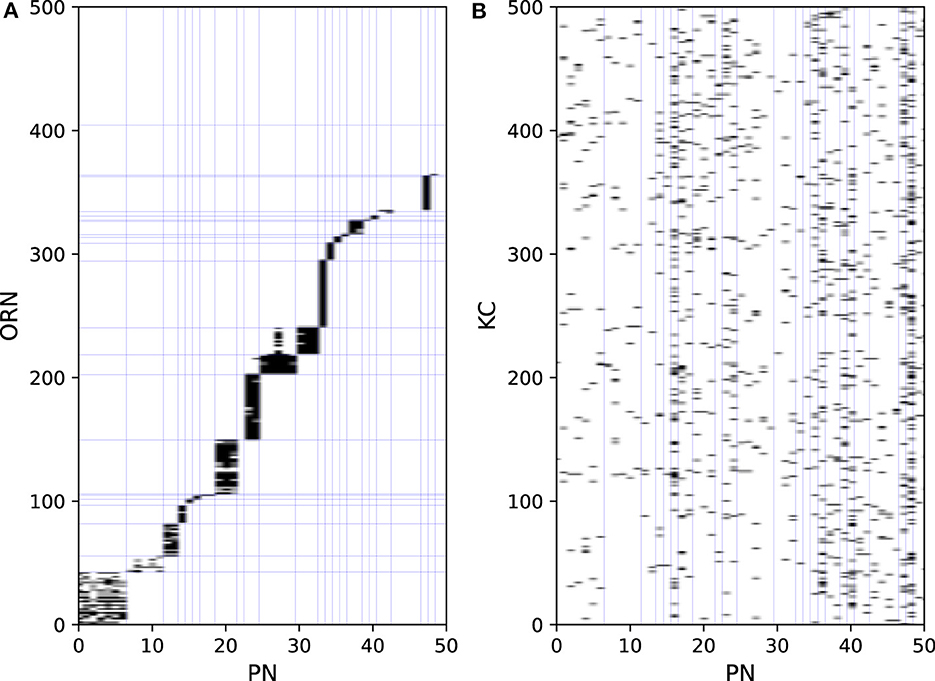
Figure 2. Synaptic connections from ORNs to PNs (A) and PNs to KCs (B).
PNs extend their axons to the entrance of the mushroom body, where they provide excitatory input to KCs. On average, each PN projects to 67.6 KCs, and each KC receives input from 4.2 PNs. Figure 2B shows part of the connection structure from PNs to KCs in the model. In contrast to the connections between ORNs and PNs, there is no regularity in the connections between PNs and KCs, which was confirmed in a previous study (Caron et al., 2013). APL receives input from almost all KCs and PNs and returns inhibitory feedback to KCs and MBONs.
There are 28 MBONs, or 44 including atypical MBONs (Li et al., 2020), at least some of which signal either positive or negative valence (Aso et al., 2014b). While how MBON signals are further processed by the downstream circuits to determine the behavioral output is still largely elusive, the connectome study discovered that postsynaptic neurons of the MBONs typically receive synaptic input from more than one type of MBONs (Li et al., 2020), suggesting that valence signals could be integrated by those neurons. A recent study characterized such a circuit motif experimentally (Aso et al., 2023). A cluster of 8–10 neurons named UpWind Neurons (UpWiNs) directly and indirectly integrates excitatory and inhibitory input from MBON-α3 and MBON-α1, respectively. Direct optogenetic activation of MBON-α3 induces upwind locomotion, which can be interpreted as an olfactory approach behavior (Matheson et al., 2021), while activation of MBON-α1 does not induce such behavior (Aso et al., 2023). Experiments using compartment-specific optogenetic activation of dopaminergic neurons demonstrated that α3 and α1 are an aversive- and appetitive-memory compartment, respectively (Aso and Rubin, 2016). Moreover, optogenetic activation of UpWiNs triggers robust upwind locomotion (Aso et al., 2023). Thus, the UpWiN cluster is one of the sites where signals of opposite memory valence are integrated and translated into olfactory navigation behavior. Since neurons in the UpWiN cluster are heterogeneous in their anatomy and connectivity, in our model, we focused on one of the neurons, SMP354, (bodyId in hemibrain is 390003153), which receives direct synaptic input from both MBON-α3 and MBON-α1. Because there is no specific genetic driver to label this particular neuron, we were unable to use experimentally determined electrophysiological parameters for this neuron. Although our model is simplified in terms of the readout mechanism of the mushroom body signals, we believe that the SMP354 circuit represents one of the common motifs that interpret the population signals of MBONs.
If a reward or punishment is given to a fly with an odor, the fly will learn to approach or avoid that odor thereafter (Tully and Quinn, 1985). Multiple studies (Cohn et al., 2015; Hige et al., 2015; Owald et al., 2015) indicate that this olfactory associative learning is caused by long-term depression of KC>MBON synapses. In the case of the circuit associated with UpWiNs, it has been experimentally demonstrated that induction of plasticity in α1, which mimics appetitive conditioning, depresses olfactory responses of MBON-α1. This in turn potentiates responses of UpWiNs, whose naïve odor responses are typically weak (Aso et al., 2023). In our model, when an odor is given, excitatory signals reach KCs via ORNs and PNs, then KCs generate spikes. Here, each individual odor elicits spikes in small, distinct population of KCs. A reward stimulus given following the odor weakens the weights of KC>MBON-α1 synapses whose presynaptic KCs had been firing within 5 seconds prior to the stimulus. Although the magnitude of the decrease in the synaptic weight after a single learning is not clear, we set the initial value of w to 1 and the weakened value to 0.25. Reward stimuli are transmitted to KC>MBON synapses through dopaminergic neurons innervating the mushroom body (Aso et al., 2014b); however, this pathway was not modeled in this study. Whereas MBON-α1 fires in response to all odors before learning, after learning, it will reduce responsiveness only to the learned odor because the synaptic connections from the KCs representing the learned odors will be selectively weakened. Since MBON-α1 is inhibitory, the activity of SMP354, receiving input from MBON-α1 will be disinhibited and thus fire only in response to the learned odor. This activity of SMP354 represents the output of the network.
We prepared electrophysiological data of each neuron and tuned the PQN models to replicate them. For LNs and KC, data recorded in previous studies (Seki et al., 2010; Inada et al., 2017) were used. The detailed procedures for the data acquisition from PNs and MBONs are described in the Methods section. Owing to the lack of data on APL and SMP354 neurons, only the modeling results are shown. Since we did not have data on MBON-α3, we used the one on MBON-α1. The PQN model was used to model the neurons. The parameter sets of the PQN model are shown in Supplementary Tables S1–S9. Figure 3 illustrates the responses of the somatic membrane potentials in vivo (red) and those of the PQN models on FPGA (blue). The black plots are the step input currents, whose unit in the recording is pA. The FPGA simulation results have no physical unit. Although a variety of LN subclasses were observed (Chou et al., 2010; Seki et al., 2010), we employed four electrophysiologically identified subclasses reported in Seki et al. (2010). They are Krasavietz_class1, Krasavietz_class2, NP1227_class1, and NP2426_class1; we fitted PQN models to each of them. The parameters of the PQN model were automatically determined using a fitting method (Nanami et al., 2017, 2018) based on the differential evolution algorithm (Storn and Price, 1997). Detailed activities of each neuron are shown in Supplementary Figures S1–S7.
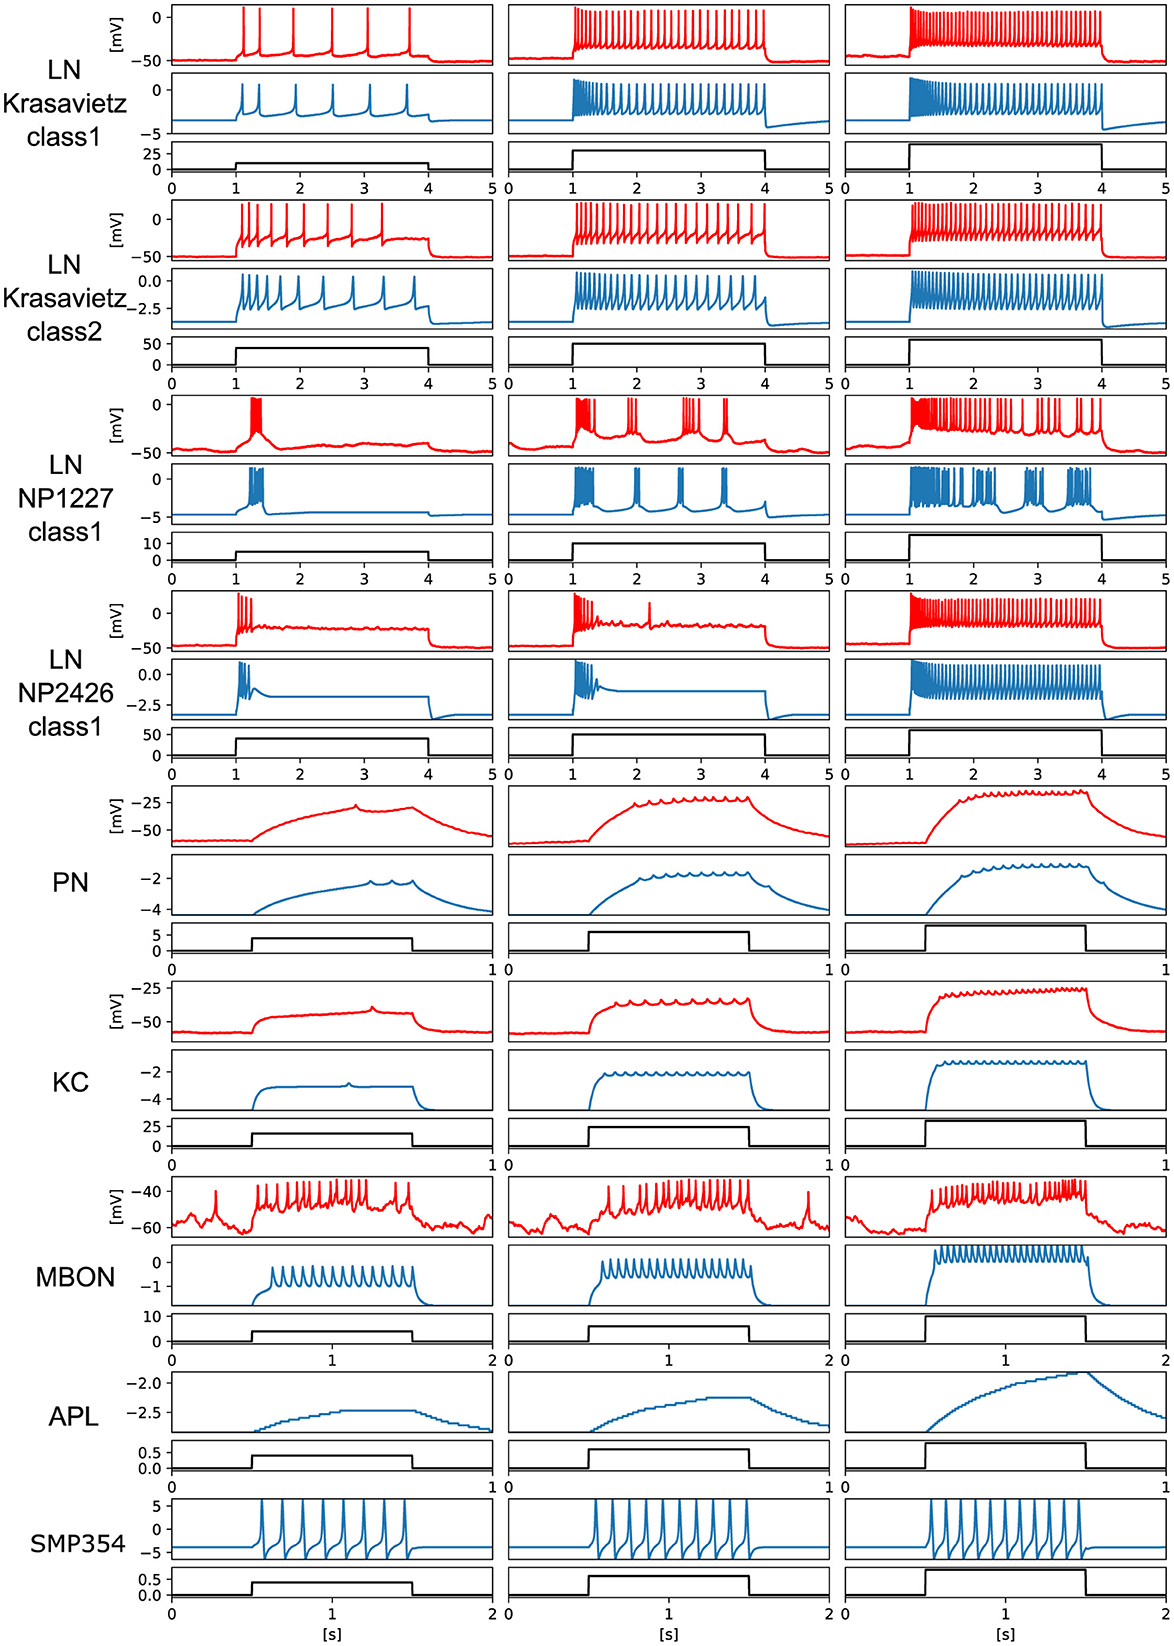
Figure 3. Electrophysiological properties of somatic membrane potentials of the in vivo data (red) and the simulated results of the PQN models in silico (blue) in response to step stimulus inputs (black). We conducted recordings from PNs and MBONs in this study. The data of the KC and four subclasses of the LNs are from previous studies (Seki et al., 2010; Inada et al., 2017). As there is no recorded data of APL and SMP354 neuron, we only show the simulation results.
2.2 Electrophysiological measurements 2.2.1 Recording from PNsWhole-cell patch-clamp recordings from PN somata were performed as previously described (Inada et al., 2017). Briefly, the brain of w;UAS-ReaChR::Citrine(attP40) /+;VT033006-Gal4(attP2)/+ female flies (von Philipsborn et al., 2011; Inagaki et al., 2013), 3 days post eclosion, was removed from the head capsule and fixed on a glass slide with surgical glue (GLUture, Abbott). Part of the perineural sheath covering the antennal lobe was removed to obtain an access to cell bodies. The external saline added on top of the plate was circulated throughout the experiment. A patch pipette was pulled from a thin-wall glass capillary (1.5 mm o.d./ 1.12 mm i.d., TW150F-3, World Precision Instruments). Resistance of the pipette was typically 8–10 MΩ. The internal solution contained (in mM) 140 KOH, 140 aspartic acid, 10 HEPES, 1 EGTA, 4 MgATP, 0.5 Na3GTP, 1 KCl, and 13 biocytin hydrazide (pH ~7.2, osmolarity adjusted to ~265 mOsm). Electrophysiological recordings were made with a Multiclamp 700B amplifier (Molecular Devices) equipped with a CV-7B headstage. Signals were low-pass filtered at 2 kHz and digitized at 10 kHz. Multiple levels of depolarizing currents were injected into the soma of individual PNs to examine the relationship between the input current and the membrane potential or spike output. PNs were identified based on the signals from Citrine as well as biocytin included in the internal solution.
2.2.2 Recording from MBONsIn vivo whole-cell current-clamp recordings from MBON-α1 and optogenetic trainings were performed as previously described (Hige et al., 2015; Aso et al., 2023). Female flies with the genotype of 10xUAS-ChrimsonR-mVenus (attP18)/w; R71C03-LexA (attP40)/LexAop-GFP (attp5); MB043C/+ reared on conventional cornmeal-based food were collected on the day of eclosion, transferred to all-trans-retinal food (0.5 mM) and kept in the dark for 48–72 h until experiments. The patch pipettes were pulled for a resistance of 4–6 MΩ and filled with pipette solution containing (in mM): L-potassium aspartate, 140; HEPES, 10; EGTA, 1.1; CaCl2, 0.1; Mg-ATP, 4; Na-GTP, 0.5 with pH adjusted to 7.3 with KOH (265 mOsm). The preparation was continuously perfused with saline containing (in mM): NaCl, 103; KCl, 3; CaCl2, 1.5; MgCl2, 4; NaHCO3, 26; N-tris (hydroxymethyl) methyl-2-aminoethane-sulfonic acid, 5; NaH2PO4, 1; trehalose, 10; glucose, 10 (pH 7.3 when bubbled with 95% O2 and 5% CO2, 275 mOsm). Whole-cell recordings were made using the Axon MultiClamp 700B amplifier (Molecular Devices). MBON-α1 was visually targeted by the GFP signal with a 60X water-immersion objective attached to an upright microscope. Cells were held at around −60 mV by injecting hyperpolarizing current. Signals were low-pass filtered at 5 kHz and digitized at 10 kHz. Data acquisition and analyses were done by custom scripts in MATLAB (MathWorks). 3-octanol (OCT) and 4-methylcyclohexanol (MCH) were presented to flies with custom odor delivery system after diluting to 1% of the saturated vapors. After recording baseline responses by alternately presenting OCT and MCH five times (duration, 1 s; interval, 30 s), OCT was paired with 625 nm LED photostimulation (pulse duration, 1 s; frequency, 0.5 Hz; power, 17 mW/mm2) for 1 min. MCH was presented without photostimulation for 1 min. 1.5 min later, post-pairing responses to both odors were recorded five times. The pairing resulted in selective depression of OCT responses, which is consistent with a previous study (Aso et al., 2023). The I-V relationship was measured before pairing by injecting 1-s square pulses with incrementing amplitudes (0–10 pA, 2 pA steps).
2.3 ORN input dataThe input data were generated using the DoOR dataset (D.Münch and Galizia, 2016), which comprehensively reports the response properties of ORs of Drosophila. The dataset shows the response intensities of each OR for a wide variety of odorants. Given a certain odor, the firing frequency r of an ORN that expresses a certain OR is given by Equation (1).
r=c0kjrij+rspo, (1)where rij is the response intensity of the ith OR to the jth odorant, and its value ranges from 0 to 1. rspo represents the spontaneous firing frequency, which was set to 8 from the average value examined in de Bruyne et al. (1999). kj is a constant that abstractly refers to the concentration of the jth odorant; its values range from 0 to 1 and are listed in Supplementary Table S10. As ORNs fire at approximately 200 Hz in response to the most favorable odorants (Hallem and Carlson, 2006), parameter c was set to 192, such that the maximum firing frequency r would be 200 when rij and kj were 1. Based on the Poisson process, each ORN generates a spike with probability rdt at every time step, where time step dt is 1 ms. In the input dataset, six odorants were applied sequentially for one second every five seconds. The synaptic currents from ORNs were calculated using the following Equations (2, 3).
dsdt=-βs(x=0) (3)where x represents the spiking information of an ORN. x is 1 when a spike is emitted in the current time step by an ORN and 0 otherwise. ORNs are cholinergic (Kazama and Wilson, 2008), and their β was set to 203.125 as well as the other synapses.
We prepared three types of input data for the in-silico experiments. In the first type of the input data, one of the six odorants, 3-octanol, cis-3-hexenol, cyclohexanone, 2,3-butanedione, 2-hexanol, and ethyl butyrate, was applied in turn for 1 second every 5 seconds. In the second type of data, 3-octanol, was applied for ten seconds every twenty seconds. In the third type of data, the same six odorants as the first type were applied in turn for ten seconds every twenty seconds. In all in-silico experiments, the first type of data was initially given for 300 seconds, during which time the PN's homeostasis was adjusted (details are described in Supplementary Note 1). Subsequently, the first type of data was continuously provided, and experiments on associative learning and the activity of MBON-α1 were conducted. In contrast, in the experiments on the oscillations in the antennal lobe, the second type of data was applied following the 300-second homeostatic period. The third type of data was only used in the experiment to show the variations in oscillations for each odor (Supplementary Note 2).
2.4 PQN modelThe piecewise quadratic neuron (PQN) model (Nanami and Kohno, 2016a,b, 2023; Nanami et al., 2016, 2017, 2018) is a qualitative neuron model designed to replicate a wide variety of neurons in the nervous system and to be efficiently implemented on digital arithmetic circuits. Compared with other qualitative models (FitzHugh, 1961; Nagumo et al., 1962; Hindmarsh and Rose, 1984), the PQN model possesses additional parameters, enabling it to represent more functional forms and reproduce a variety of neurons, each with its unique dynamical structure. In addition, although other qualitative models have cubed variable terms, which consume a vast amount of circuit resources in digital arithmetic circuits, the PQN model uses piecewise functions composed of a squared term to represent comparable dynamics and consumes few circuit resources.
The nervous system of Drosophila primarily comprises unipolar neurons, the soma of which is separated from the rest of the cell by a long and thin membrane. In the patch-clamp recording from the soma, only action potentials with extremely small amplitudes were observed. This is attributed to the fact that the action potentials are generated in the axon and propagated with decay to the cell body (Gouwens and Wilson, 2009). Therefore, we modeled PNs, KCs, and MBONs using two-compartment models; one compartment corresponded to the soma, and the other contained axons and dendrites. In contrast, in the soma of LNs, sufficiently large action potentials were observed (Seki et al., 2010); therefore, they were modeled using single-compartment models. APL is an inhibitory, non-spiking neuron whose axons extend to the whole mushroom body. It was reported (Inada et al., 2017; Amin et al., 2020) that APL performs local inhibition; however, the details are not clear. Therefore, in this study, we modeled APL as a simple non-spiking neuron with a single-compartment.
The equations of the PQN model in the single-compartment version for LNs, APL, and SMP354 are given by Equations (4–16).
dvdt=ϕτ(f(v)-n-q+Ib0+m(I)), (4) dndt=1τ(g(v)-n), (5) dqdt=ϵτ(h(v)-q), (6) f(v)={afn(v−bfn)2+cfn (v<0)afp(v−bfp)2+cfp (v≥0), (7) g(v)={agn(v−bgn)2+cgn (v<rg)agp(v−bgp)2+cgp (v≥rg), (8) h(v)={ahn(v−bhn)2+chn (v<rh)ahp(v−bhp)2+chp (v≥rh), (9) m(I)={kIm0 (I<m0)kII (m0≤I≤m1)kIm1 (I>m1), (10) bfp=afnbfnafp, (11) cfp=afnbfn2+cfn-afpbfp2, (12) bgp=rg-agn(rg-bgn)agp, (13) cgp=agn(rg-bgn)2+cgn-agp(rg-bgp)2, (14) bhp
留言 (0)