
記住我


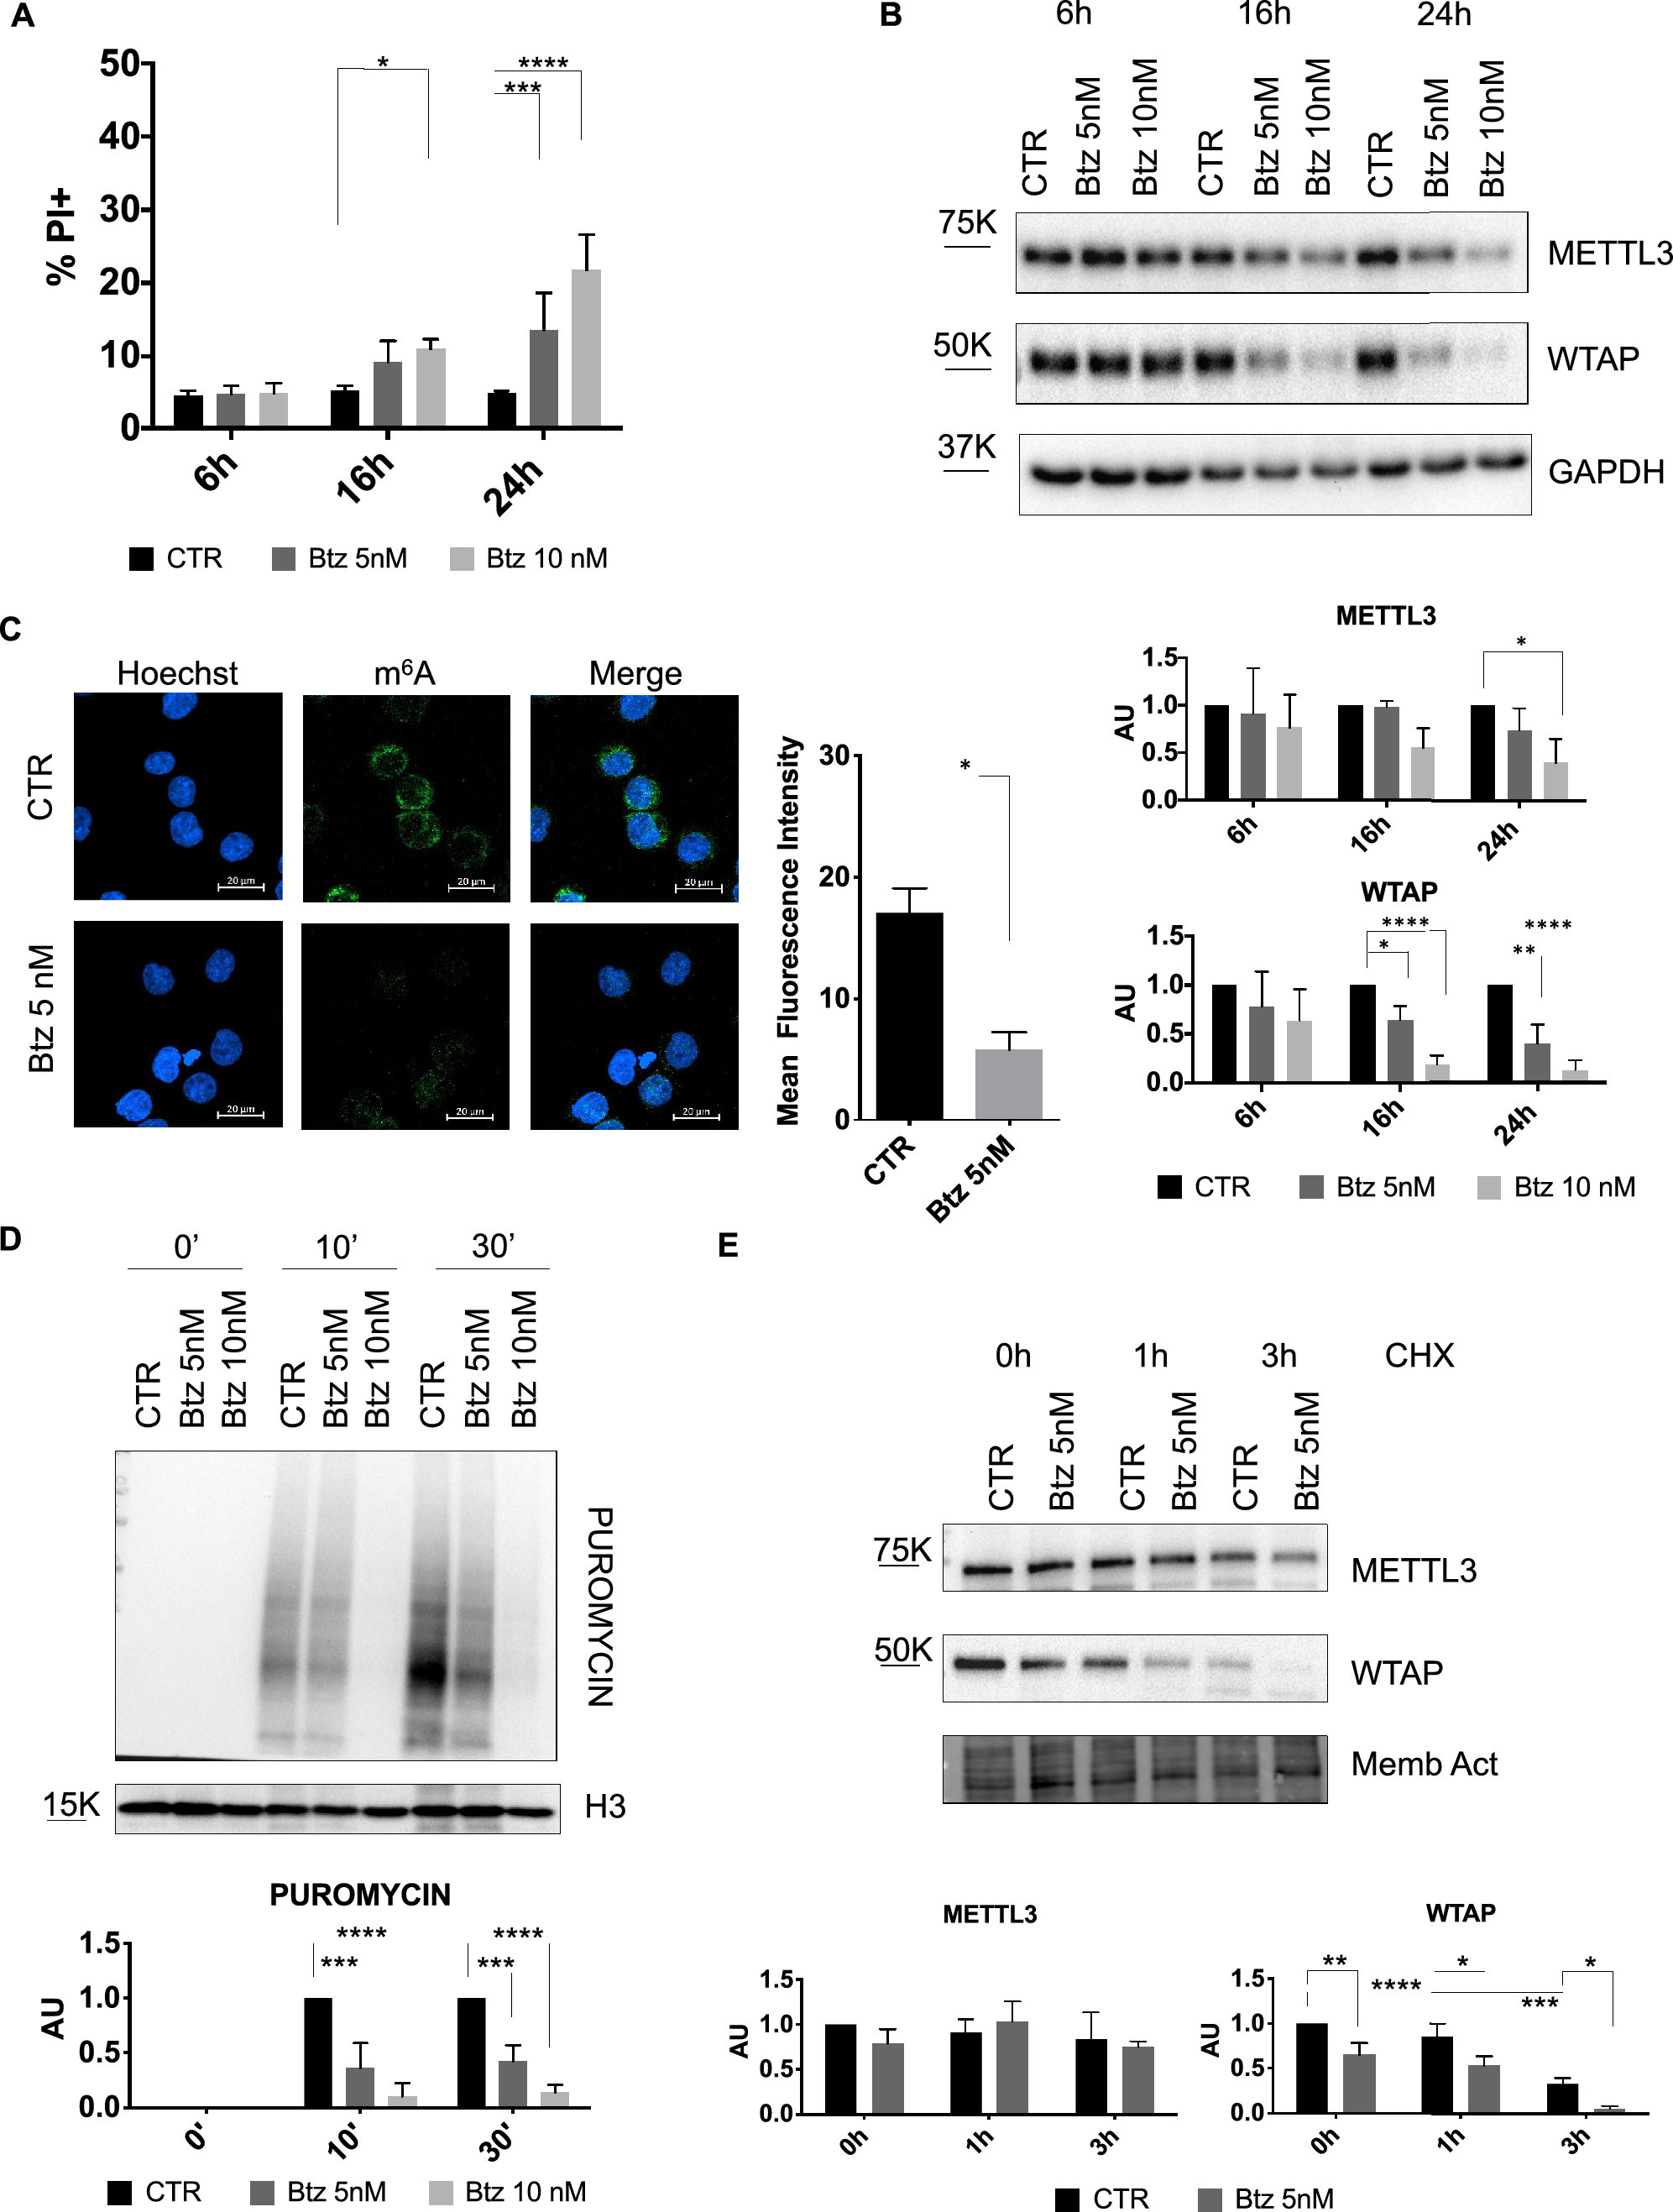


Considering m6A RNA modification’s roles in circRNA biogenesis and function and the involvement of cellular stress in malignant transformation, tumor progression, and drug resistance [36, 49], we decided to investigate the role of cellular stress induced by Btz on the expression m6A regulators. Based on literature data and our analysis of dose–response curves, we decided to use two different doses of Btz at short times [30, 32]. We treated MOLM-13, a FLT3-ITD+ human AML cell line, with 5 nM and 10 nM of Btz for 6 h,16 h and 24 h to induce acute stress. Cytofluorimetric analysis of cell death showed that Btz treatment resulted in low cell death rates at the indicated times and concentrations, with only 25–30% dead cells in the samples treated with the highest dose for 24 h (Fig. 1A). Then, we investigated the expression levels of some proteins involved in m6A RNA modification under acute stress conditions in AML. Specifically, we analyzed the expression of the methyltransferase METTL3 and the cofactor WTAP, which is critical for METTL3 activity. As shown in Fig. 1B, we observed a general downregulation of both proteins, METTL3 and WTAP, upon Btz treatment after 24 h. Interestingly, a strong and significant decrease in WTAP protein expression levels was observed as early as 16 h of treatment with the lowest Btz concentration, 5 nM. We additionally explored the expression levels of the YTHDC1 and FTO proteins. The former plays a crucial role in leukemogenesis and the maintenance of myeloid cell state, while the latter is implicated in various drug resistance mechanisms [50,51,52]. Similarly to WTAP and METTL3, Btz treatment induced a significant strong downregulation of YTHDC1 and a modest decrease of FTO protein expression levels, as depicted in Supplementary Fig. 1A. To understand whether this regulation was transcriptional or post-transcriptional, we further evaluated METTL3 and WTAP mRNA levels by RT-qPCR. As shown in Supplementary Fig. 1B, the reduction in protein levels did not correspond to a decrease in their mRNA, suggesting post-transcriptional regulation of METTL3, WTAP, YTHDC1, and FTO upon Btz treatment. Since the decrease in protein levels of m6A regulators, we investigated the effect of Btz-induced stress on overall m6A modification levels. To address this question, we treated the MOLM-13 cell line with 5 nM of Btz for 16 h and analyzed the amount of m6A through immunofluorescence with an anti-m6A antibody, quantifying the fluorescence intensity. The results illustrated in Fig. 1C showed reduced fluorescence intensity in the Btz-treated cells, indicating a decrease in RNA methylation level.
Fig. 1
A Percentage of cell death detected by propidium iodide (PI) after 6 h, 16 h and 24 h of treatment with Btz 5 nM and 10 nM (n = 4). *P ≤ 0.05; ***P ≤ 0.0005; ****P ≤ 0.00005; statistical analysis was performed by Two-Way ANOVA. B Representative western blot of METTL3 and WTAP and relative quantification after 6 h,16 h and 24 h of treatment with Btz 5 nM and 10 nM (n = 4). *P ≤ 0.05; **P ≤ 0.005; ****P ≤ 0.00005; statistical analysis was performed by Two-Way ANOVA. C MOLM-13 cells were treated with 5 nM of Btz for 16 h, labeled with Hoechst (cell nuclei) and with anti-m6Ab labeled with Alexa Fluor 488 (m6A modification). Scale bars, 20 μm. On the right, graph of mean fluorescence quantification (n = 2). ***P ≤ 0.0005; statistical analysis was performed by T-Test. D Detection by western blot analysis of puromycin incorporation after 0′, 10′ and 30′ in control cells and in cells treated with Btz 5 nM for 16 h. On the bottom is presented the quantification relative to the control for each time point (n = 3). E Representative western blot analysis of MOLM-13 cells treated with 5 nM of Btz for 16 h and subsequently with CHX for additional 0 h (CHX -), 1 h and 3 h. On the bottom, relative quantification of METTL3 and WTAP protein levels, normalized on total protein measured by stain-free BioRad method (n = 3). *P ≤ 0.05; **P ≤ 0.005; ***P ≤ 0.0005; ****P ≤ 0.00005; statistical analysis was performed by Two-Way ANOVA
Btz treatment induces inhibition of global translation and WTAP degradationAccording to literature data, intrinsic and extrinsic conditions like ER stress, hypoxia, oxidative stress, and proteasome inhibition lead to phosphorylation of eIF2α, resulting in the inhibition of global protein synthesis [53]. For this reason, we wondered whether the reduced quantity of the m6A regulators was due to a decrease in global protein synthesis. We employed the SUnSET method, using an antipuromycin antibody to detect changes in protein synthesis [54]. Specifically, control cells and those treated with 5 nM and 10 nM of Btz were exposed to puromycin for 0, 10 and 30 min, followed by the analysis of newly synthesized polypeptides by western blotting. As shown in Fig. 1D, we observed a significant drop in puromycin incorporation upon Btz treatment, particularly evident with the highest concentration compared to control cells, indicating a global reduction of protein synthesis. This finding aligns with the decline in protein levels of the m6A regulators after 24 h treatment with Btz 10 nM. To understand whether the decrease in these proteins is dependent only on translation inhibition or also on protein destabilization, we conducted a Cycloheximide (CHX) chase assay, commonly used to measure the steady-state protein stability. After 16 h of treatment with 5 nM of Btz, the dose and time in which METTL3 protein expression levels did not decrease, while WTAP started to decrease significantly, we exposed cells to CHX for 1 and 3 h. Intriguingly, after CHX treatment WTAP protein decreased significantly already after 1 h, almost disappearing after 3 h, faster upon Btz treatment, while METTL3 did not. These data suggest that WTAP has a very short half-life, and the treatment with Btz 5 nM strongly destabilizes this protein (Fig. 1E). Thus, protein degradation enhances WTAP diminution, not excluding the contribution of inhibition of protein synthesis.
Btz treatment induces the integrated stress response (ISR)As previously mentioned, several cellular stresses can phosphorylate eIF2α, impairing global translation efficiency and activating the Integrated Stress Response (ISR). Given the significant decrease in global protein synthesis, we investigated whether Btz treatment induced ISR by assessing eIF2α phosphorylation levels. Figure 2A illustrates that Btz treatment increased the phosphorylated form of eIF2α, particularly after 16 h , indicating IRS induction by the Btz doses used. Moreover, we observed an increase of BiP protein, one of the main ER chaperones, upon Btz treatment, indicating the presence of ER stress likely generated by the misfolded protein accumulation due to proteasome inhibition. As described in the introduction, under ER stress conditions, the oxidative folding of proteins, i.e. the formation of disulfide bonds, can occur in a dysregulated manner, leading to ROS accumulation and oxidative stress. Therefore, we investigated whether treatment with Btz could induce oxidative stress. We measured the amount of ROS by cytofluorimetric analysis 3 h and 6 h after Btz treatment. As shown in Fig. 2B, we observed an accumulation of ROS after 3 h and 6 h with the highest concentration of Btz, 10 nM. Furthermore, we found increased expression of heme oxygenase-1 (HMOX-1) mRNA, which is activated during the antioxidant response. To evaluate the contribution of oxidative stress to the Btz-induced down-regulation of METTL3 and WTAP, we treated cells with N-acetylcysteine (NAC), a commonly used pharmacological antioxidant and cytoprotectant. We administrated NAC to MOLM-13 cells, one day in advance of Btz treatment. After 16 h of Btz treatment, samples treated with NAC recovered protein expression levels, particularly significant for WTAP, suggesting that Btz-mediated protein decrease may be due to oxidative stress (Fig. 2C). Moreover, in the same experimental conditions, we performed RT-qPCR analysis of HMOX-1, which showed expression levels similar to the control samples as reported in Fig. 2D.
Fig. 2
A Representative western blot analysis of BiP, P-eIF2α and eIF2α in MOLM-13 cells treated with 5 nM and 10 nM of Btz for 6, 16 and 24 h, with relative quantification (n = 3). B Cytofluorimetric detection of ROS after 3 h and 6 h of Btz treatment at the final concentration of 5 nM and 10 nM by using oxidized DCF-DA (on the left panel), (n = 3). On the right RT-qPCR analysis of HMOX-1 after 6 h of 5 nM and 10 nM of Btz (n = 4). C Representative western blot of METTL3 and WTAP after 16 h with 5 nM of Btz treatment, in presence or not of NAC and relative quantification (n = 3). D RT-qPCR analysis of HMOX-1 in the same previous described experimental condition (n = 3).*P ≤ 0.05; **P ≤ 0.005; ***P ≤ 0.0005; statistical analysis was performed by Two-Way ANOVA
Btz-resistant clones are able to control oxidative stressNext, we generated MOLM-13 Btz-resistant clones for functional studies. We exposed the MOLM-13 cell line to doses of Btz increasing every 4 weeks, changing the medium every 4 days. After three months of treatment, we seeded the cells in 96 wells in serial dilution, and we isolated the single resistant clones (subclones). In total, we isolated 3 different MOLM-13 Btz-resistant clones (MR), on which we performed functional assays. We first confirmed the resistance of our clones to Btz by treating them with 5 nM and 10 nM concentrations for longer than 72 h and similarly we treated the parental MOLM-13 cell line. After 72 h of treatment, we performed a cytofluorimetric analysis of cell death upon propidium iodide uptake. As shown in Fig. 3A, after 72 h of treatment with 5 nM of Btz, there was no cell death in the MR cell lines. We observed 50% cell death with 10 nM Btz, which still indicates resistance when comparing these results with those obtained with the parental MOLM-13 cell line, which resulted in 100% cell death upon treatment with both concentrations. Among the MR clones, MOLM-13 Btz resistant 1 (MR-1) showed the best resistance to the treatment, so we selected this one for further functional studies. As Btz treatment in MOLM-13 cells induced down-regulation of METTL3 and WTAP, we investigated their expression in the MR-1 cells under the same experimental conditions, Btz 5 nM and 10 nM for 6, 16 and 24 h. Additionally, we also assessed YTHDC1 and FTO protein expression levels. As represented in Fig. 3B and in Supplementary Figure S2A, the MR-1 cells no longer showed downregulation of the m6A regulators upon Btz treatment compared to control samples, nor did we detect any significant deregulation of METTL3, WTAP, YTHDC1 and FTO mRNA levels (Supplementary Figure S2B). As expected, we observed no changes in m6A modification levels in MR-1 cells treated with Btz 5 nM for 16 h (Fig. 3C). Moreover, unlike the parental MOLM-13 cell line, there was no overall decrease in global translation in MR-1 cells, as illustrated in Fig. 3D. Considering the induction of stress resulting in ISR activation observed previously, we investigated the Btz-induced stress response in the MR-1 clone. We analyzed phosphorylation of eIF2α protein, which showed a slight, statistically non-significant, increase, while the BiP protein expression level remained constant in a dose and time-dependent manner (Fig. 4A). In order to evaluate Btz-induced oxidative stress in Btz-resistant cells, we analyzed the amount of ROS in MR-1 cells treated with 5 nM and 10 nM Btz for 3 and 6 h. As shown in Fig. 4B, Btz treatment did not increase ROS levels in the MR-1 cells in all the experimental conditions, unlike previously observed in the parental MOLM-13 cells. Accordingly, the MR-1 cells activated the antioxidant response after 6 h of stress induced by the highest concentration of Btz, as evidenced by increased levels of HMOX-1 mRNA, albeit at lower levels than that induced in the MOLM-13 cell line (Fig. 4B). As expected, no changes were observed upon administration of NAC to MR-1 cells treated with Btz (Fig. 4C).
Fig. 3
A Cytofluorimetric analysis of cell death detected by propidium iodide (PI) exclusion assay in MS and MR cells treated with Btz 5 nM and 10 nM for 72 h (n = 4). B Representative western blot of METTL3 and WTAP with relative quantification in MR-1 cells, treated with 5 nM and 10 nM of Btz for 6, 16 and 24 h (n = 4). C MR-1 cells were treated with 5 nM of Btz for 16 h, labeled with Hoechst (cell nuclei) and with anti-m6Ab labeled with Alexa Fluor 488 (m6A modification). On the bottom, is reported the graph of mean fluorescence quantification. Scale bars, 20 μm. (n = 2). D Detection by western blot analysis of puromycin incorporation after 0’, 10’ and 30’ in MR-1 cells control and treated with Btz 5 nM for 16 h. On the bottom is presented the quantification relative to the control for each time point (n = 3). ****P ≤ 0.00005; statistical analysis was performed by Two-Way ANOVA
Fig. 4
A Representative western blot analysis of BiP, P-eIF2α and eIF2α in MR-1 cells treated with 5 nM and 10 nM of Btz for 6, 16 and 24 h (n = 3). B ROS detection after 3 h and 6 h of Btz treatment at the final concentration of 5 nM and 10 nM in MOLM-13 and MR-1 cells, by cytofluorimetry. On the bottom, RT-qPCR analysis of HMOX-1 in the same samples treated with Btz for 6 h, as described above (n = 3). C Representative western blot of METTL3 and WTAP after 16 h with 5 nM of Btz treatment, in presence or not of NAC and relative quantification (n = 3). D Representative western blot analysis of MR-1 cells treated with 5 nM of Btz for 16 h and subsequently with CHX for additional 0 h (CHX -), 1 h and 3 h; on the bottom, relative quantification of METTL3 and WTAP protein levels (n = 2). *P ≤ 0.05; **P ≤ 0.005; ***P ≤ 0.0005; statistical analysis was performed by Two-Way ANOVA
Interestingly, we treated MR-1 cells with 5 nM of Btz for 16 h with and without CHX and we did not observe a significant reduction in WTAP protein levels. This suggests that in MR-1 cells, WTAP indeed has a longer half-life compared to parental MOLM-13 cells (Fig. 4D) and this may play a crucial role in the cellular stress response. Altogether, these data suggest that Btz treatment induced a certain degree of stress, but Btz-resistant cells are nonetheless capable of managing it.
Btz treatment induces the methylation and expression of a subset of m6A-modified circRNAsAs mentioned, among our aims there was the identification of m6A-modified circRNAs differentially expressed upon proteotoxic stress. Once we assessed that Btz alters m6A levels, we performed m6A-Immunoprecipitation (m6A-IP) on RNA extracted from MOLM-13 cells treated with 5 nM of Btz for 16 h. In detail, total RNA was isolated, treated with RNaseR to remove all the linear RNA and most of the ribosomal RNA before proceeding with m6A-IP. Input and m6A-immunoprecipitated RNAs from CTR- and Btz-treated cells were then analyzed by RNA-seq and circRNAs expression values are available on GEO dataset (GSE262829). To select m6A circRNA deregulated between CTR and Btz-treated MOLM-13 cells, we employed unsupervised clustering analysis on normalized RNA-seq enrichment of detected m6A circRNAs (Fig. 5A and Supplementary Table 1). Although the global m6A RNA level is decreased, we identified a signature of circRNAs that showed an increase in m6A methylation after Btz treatment. Hierarchical clustering enabled to identify a set of 126 m6A circRNA that exhibited higher expression in the m6A-IP Btz-treated samples compared to the m6A-IP untreated samples. RT-qPCR validation was executed on four circRNA selected from this set using divergent primers. As shown in Fig. 5B, circZNF609, circHIPK3, circRNF220 and circAFF1 exhibited hyper-methylation following Btz treatment, compared to the control samples. We then investigated how their expression, along with their linear counterparts, changed in MOLM-13 parental cells and MR-1 cells upon Btz treatment. We treated MOLM-13 and MR-1 cells with 5 nM Btz for 16 h and assessed the expression of the selected circRNAs and their linear transcripts using RT-qPCR. As shown in Fig. 6A,B, we observed a significant upregulation of the four selected and hypermethylated m6A-modified circRNAs following Btz treatment. Interestingly, the upregulation of circZNF609, circRNF220 and circHIPK3 in response to Btz treatment was attenuated in MR-1 cells under the same experimental conditions, as was the case for circAFF1, although not to a statistically significant extent. These data suggest that Btz treatment increased both methylation levels and expression of the selected circRNAs. Regarding their linear counterparts, we observed a significant but less pronounced increase in RNF220, AFF1, and HIPK3 mRNA expression, while ZNF609 showed no variation. To investigate the impact of oxidative stress on circRNA expression in response to Btz, we treated MOLM-13 cells with Btz 5 nM with or without NAC. As shown in Fig. 6C, circRNAs expression increased in Btz-treated samples, but not in those pre-treated with NAC. This suggests that the selected circRNAs, hyper-methylated and overexpressed upon Btz treatment, are dependent on oxidative stress and may play a role in modulating Btz-induced stress.
Fig. 5
A Unsupervised clustering heatmap showing the z-score cpm enrichment of circRNAs identified by m6A-IP-RNAseq in MOLM-13 cells treated with Bortezomib vs control untreated cells. The circRNAs experimentally validated were highlighted on the left side of the heatmap. Color legend: pink = Bortezomib treated samples; light green = control samples. B RT-qPCR analysis of circZNF609, circRNF220, circHIPK3 and circAFF1 in control and Btz-treated samples after m6A-IP (n = 4). *P ≤ 0.05; **P ≤ 0.005; ***P ≤ 0.0005; statistical analysis was performed by Two-Way ANOVA
Fig. 6
A RT-qPCR analysis of circZNF609, circRNF220, circAFF1 and circHIPK3 in control and Btz-treated samples in MS and MR-1 cells (n = 3). B RT-qPCR analysis ZNF609, RNF220, AFF1 and HIPK3 in control and Btz-treated samples in MS and MR-1 cells (n = 3). C RT-qPCR analysis of circZNF609, circRNF220, circAFF1, circHIPK3 and circSATB1 in control and Btz-treated samples in MOLM-13 treated with water (control) or NAC (n = 3). Each untreated cell line is set at 1.0. *P ≤ 0.05; **P ≤ 0.005; ***P ≤ 0.0005; statistical analysis was performed by Two-Way ANOVA
circHIPK3 alleviates oxidative and ER stressAmong the four validated circRNAs, circHIPK3 certainly has captured our interest since its antioxidant role is well-known in literature [55]. Therefore, we silenced circHIPK3 using shRNA and we analyzed, in a time course, whether our circRNA was silenced without influencing the expression of the linear counterpart. Supplementary Fig. 3A demonstrates the stable silencing of circHIPK3. Silencing did not affect cell death and proliferation, as also indicated by the cell cycle analysis performed 72 h post-seeding (Supplementary Fig. 3B). Subsequently, we investigated the response to oxidative and ER stress. We observed a significant increase in reactive oxygen species 24 h after shcircHIPK3 cells seeding, suggesting a possible role of circHIPK3 in alleviating oxidative stress also in acute myeloid leukemia (Fig. 7A). However, as shown in Fig. 7B, steady-state ROS levels in the circHIPK3-silenced cells were not sufficient to activate HMOX-1, suggesting a mild level of stress. Regarding basal ER stress, BiP expression levels were not increased, but we observed an increase in the spliced form of X-box binding protein 1 (XBP1s). Under ER stress conditions, the UPR sensor IRE1α splices XBP1 mRNA generating the spliced form XBP1s. XBP1s is a transcription factor, which migrates to the nucleus and activates UPR target genes encoding ER chaperones, folding enzymes, and ERAD to attenuate ER stress [56]. Upon ER stress, the UPR triggers a series of events that influence the structure and function of cellular organelles, including the Golgi apparatus. Consistent with this, we found increased dimension of the Golgi apparatus in the circHIPK3-silenced cells, analyzed by immunofluorescence upon staining for the Golgi marker GM130 (Fig. 7C). Alterations in XBP1s expression and Golgi size suggest perturbation of the secretory pathway. Thus, we evaluated the expression levels of a secretory protein in circHIPK3-silenced cells compared to control. Based on literature, retinoic acid (RA) administration is not able to induce a complete differentiation (as in Acute Promyelocytic Leukemia, APL) in AML cells, although it causes signs of differentiation and activates the secretory pathway [30]. Thus, we measured by flow cytometry the expression of a plasma membrane protein, the myeloid-monocytic lineage differentiation maker CD11b, upon treatment of shSCR and shcircHIPK3 MOLM-13 cells with 10–6 RA for 72 h. CD11b levels increased in MOLM-13, shSCR and shcircHIPK3 RA-treated samples compared to the respective control samples (CTR). Interestingly, shcircHIPK3 cells displayed a significantly lower level of CD11b compared to MOLM-13 and shSCR cells (Supplementary Fig. 3D), after RA treatment, indicating alterations in the secretory pathway in the absence of circHIPK3.
Fig. 7
A shSCR and shcircHIPK3 cells were plated and after 24 h cytofluorimetric detection of ROS was performed by using oxidized DCF-DA (n = 3). B RT-qPCR analysis of HMOX-1, hBiP and XBP1s in shSCR and shcircHIPK3 after 24 h of plating (n = 3). C shSCR and shcircHIPK3 cells were plated and, after 24 h, were labeled with Hoechst (cell nuclei) and with anti-GM130 labeled with Alexa Fluor 555. On the right, is reported the graph of Golgi Area (µm2) and mean fluorescence quantification. Scale bars, 20 μm. (n = 4). D Representative western blot of FLT3 and BiP in Reducing (R, upper panel) and Non-Reducing (NR, lower panel) conditions, of shSCR and shcircHIPK3 cells after 16 h of 300 ng/mL Tm treatment (n = 3). *P ≤ 0.05; **P ≤ 0.005; statistical analysis was performed by Two-Way ANOVA
To further investigate this aspect, we decided to treat shSCR and shcircHIPK3 cells with the N-glycosylation inhibitor Tunicamycin (Tm), a well-known ER inducer. We tested three different concentrations of Tm for 72 h and observed increased sensitivity of circHIPK3-silenced cells to the treatment compared to control cells (shSCR) (Supplementary Fig. 4A). We chose the intermediate concentration of Tm (300 ng/mL) to observe the potential accumulation of misfolded proteins. As shown in Fig. 7D, circHIPK3-silenced cells treated for 16 h with Tm (300 ng/mL) exhibited a significant increase in total BiP levels (Fig. 7D reducing gel), and a considerable accumulation of FLT3 and BiP high molecular weight aggregates in comparison to control samples treated with Tm (Fig. 7D non-reducing gel and Supplementary Fig. 4B). Although not significant, a mild increase in BiP aggregates in the non-reducing western blot conditions was observed in the untreated shcircHIPK3 sample, confirming a slight increase in ER stress and accumulation of unfolded proteins already at the steady state. As mentioned above FLT3-ITD is a misfolded protein retained in the ER and BiP is the main ER chaperone that forms complexes with misfolded proteins that accumulate in the ER; thus, the presence of high molecular weight aggregates of these proteins indicates an impairment of ER folding capacity. These data confirm the protective role of circHIPK3 in alleviating oxidative and ER stress in AML cells.
留言 (0)