
記住我
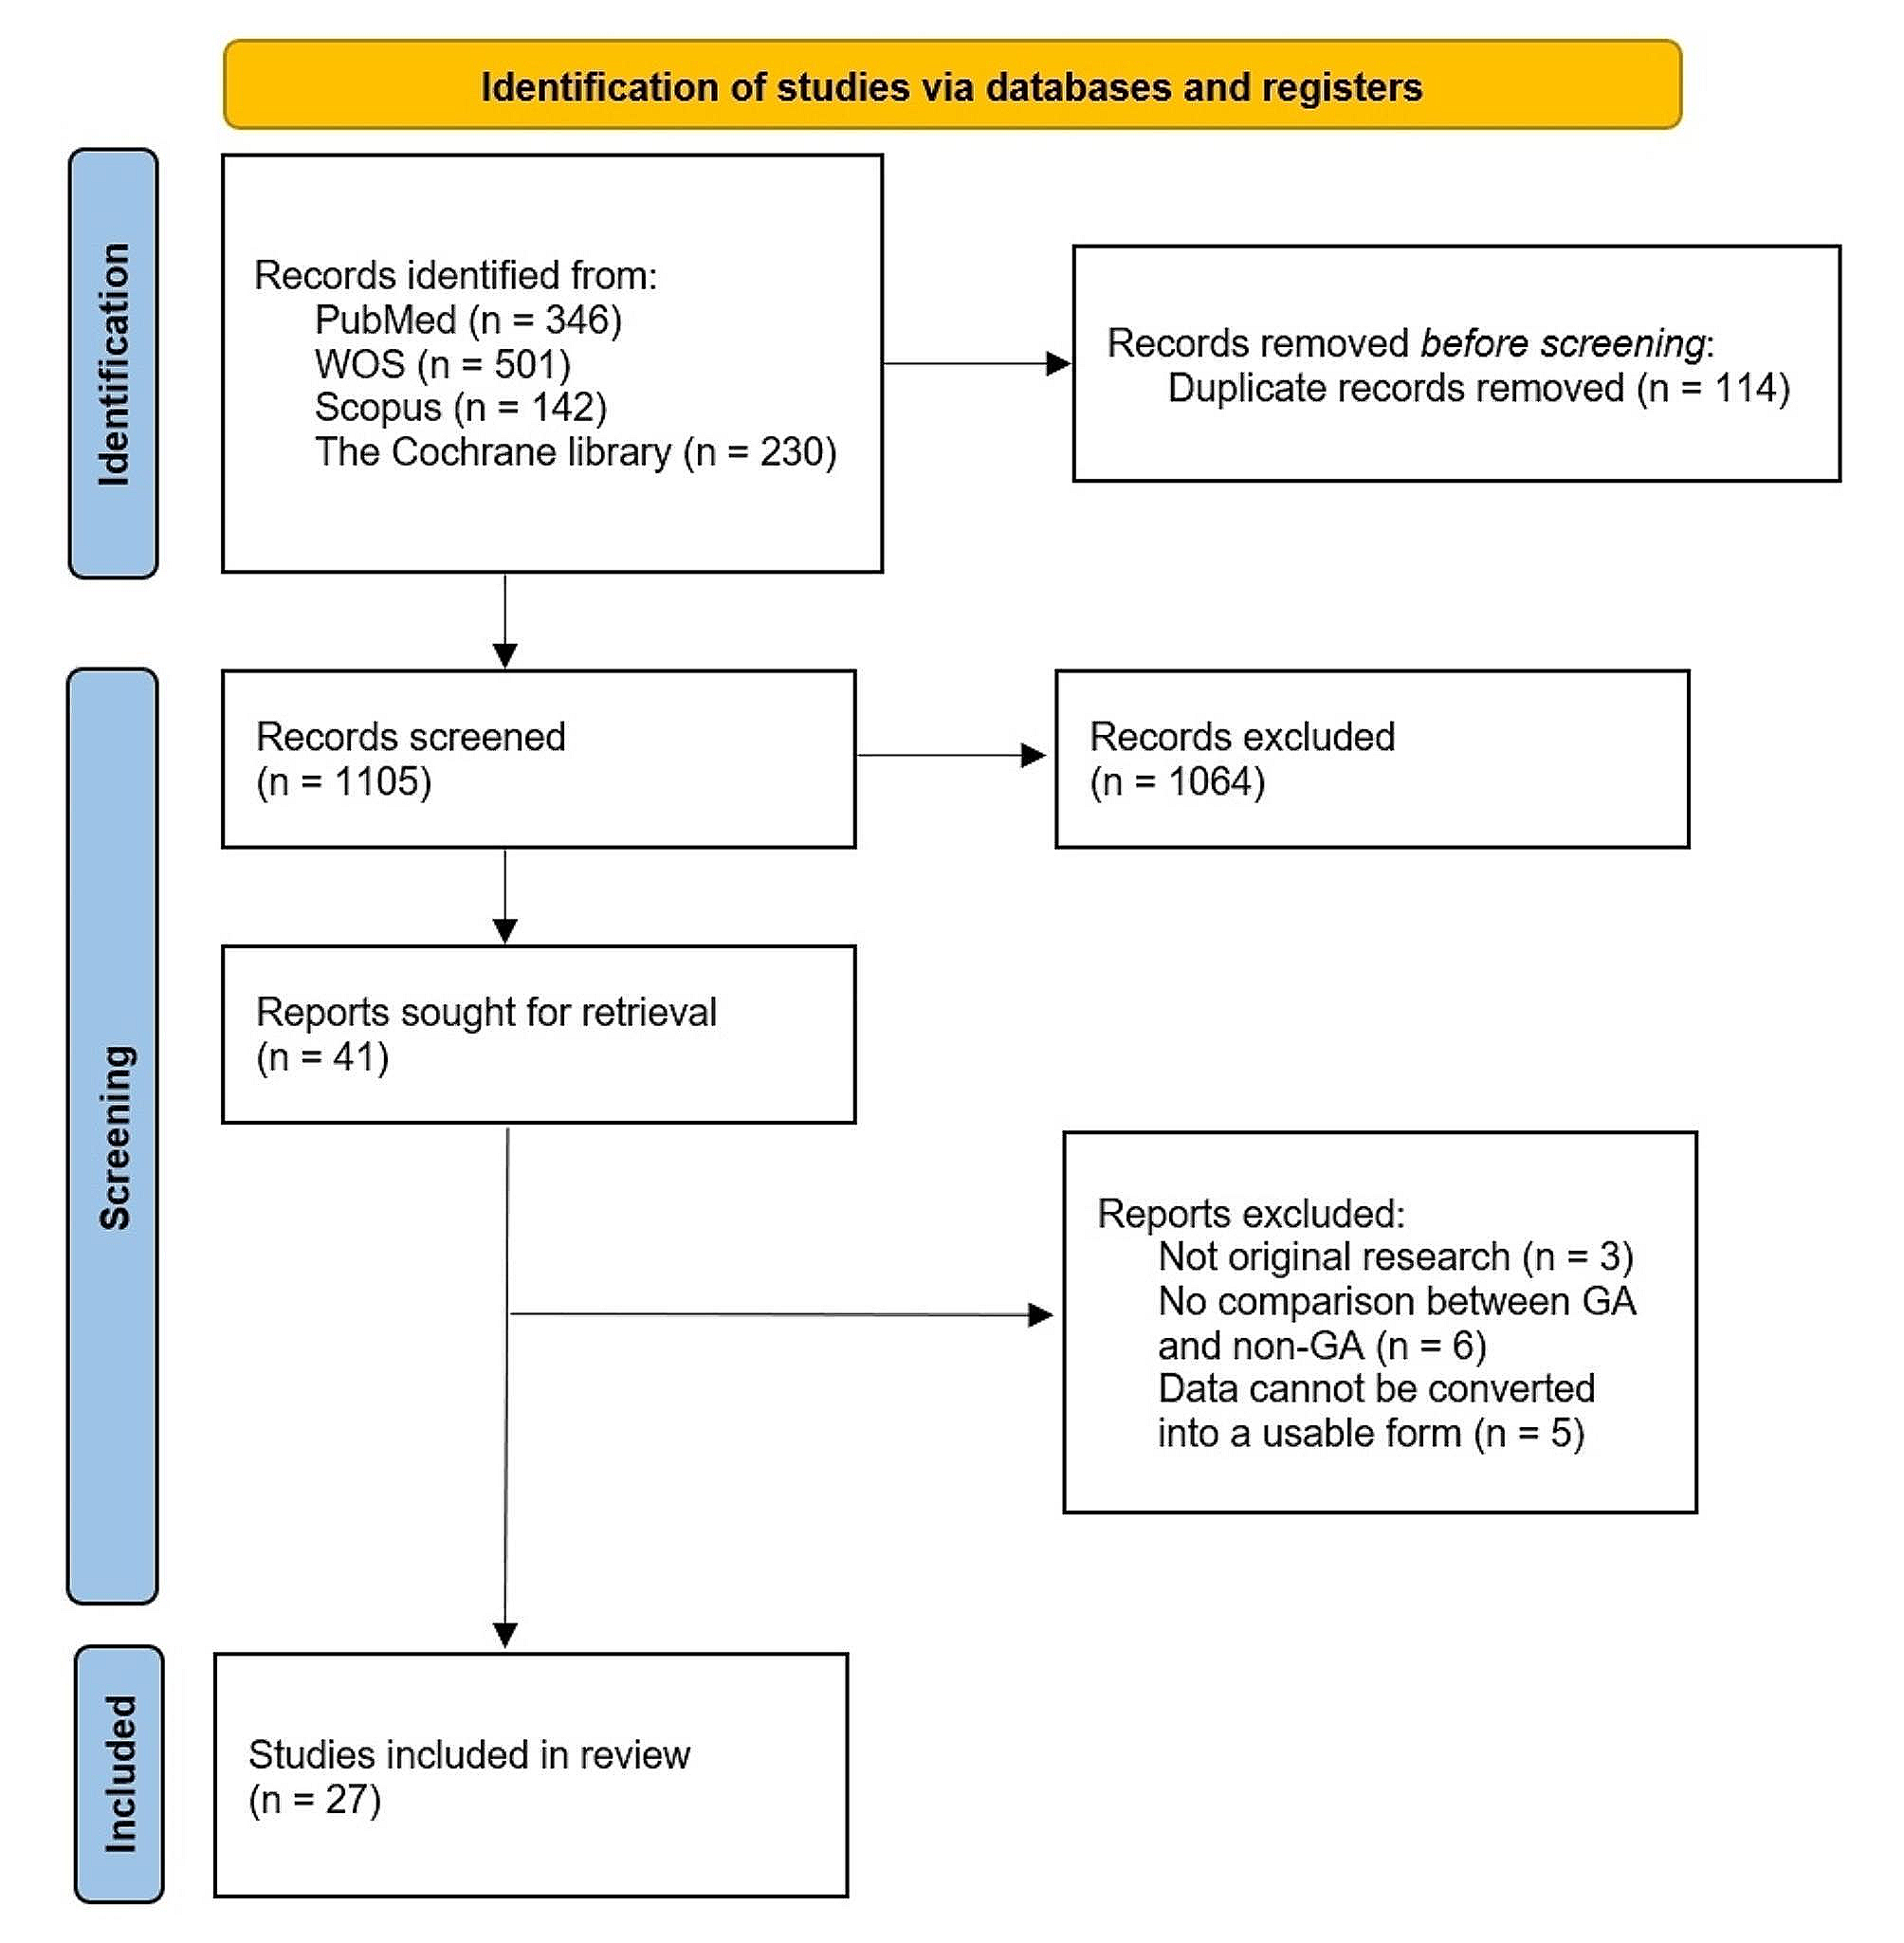

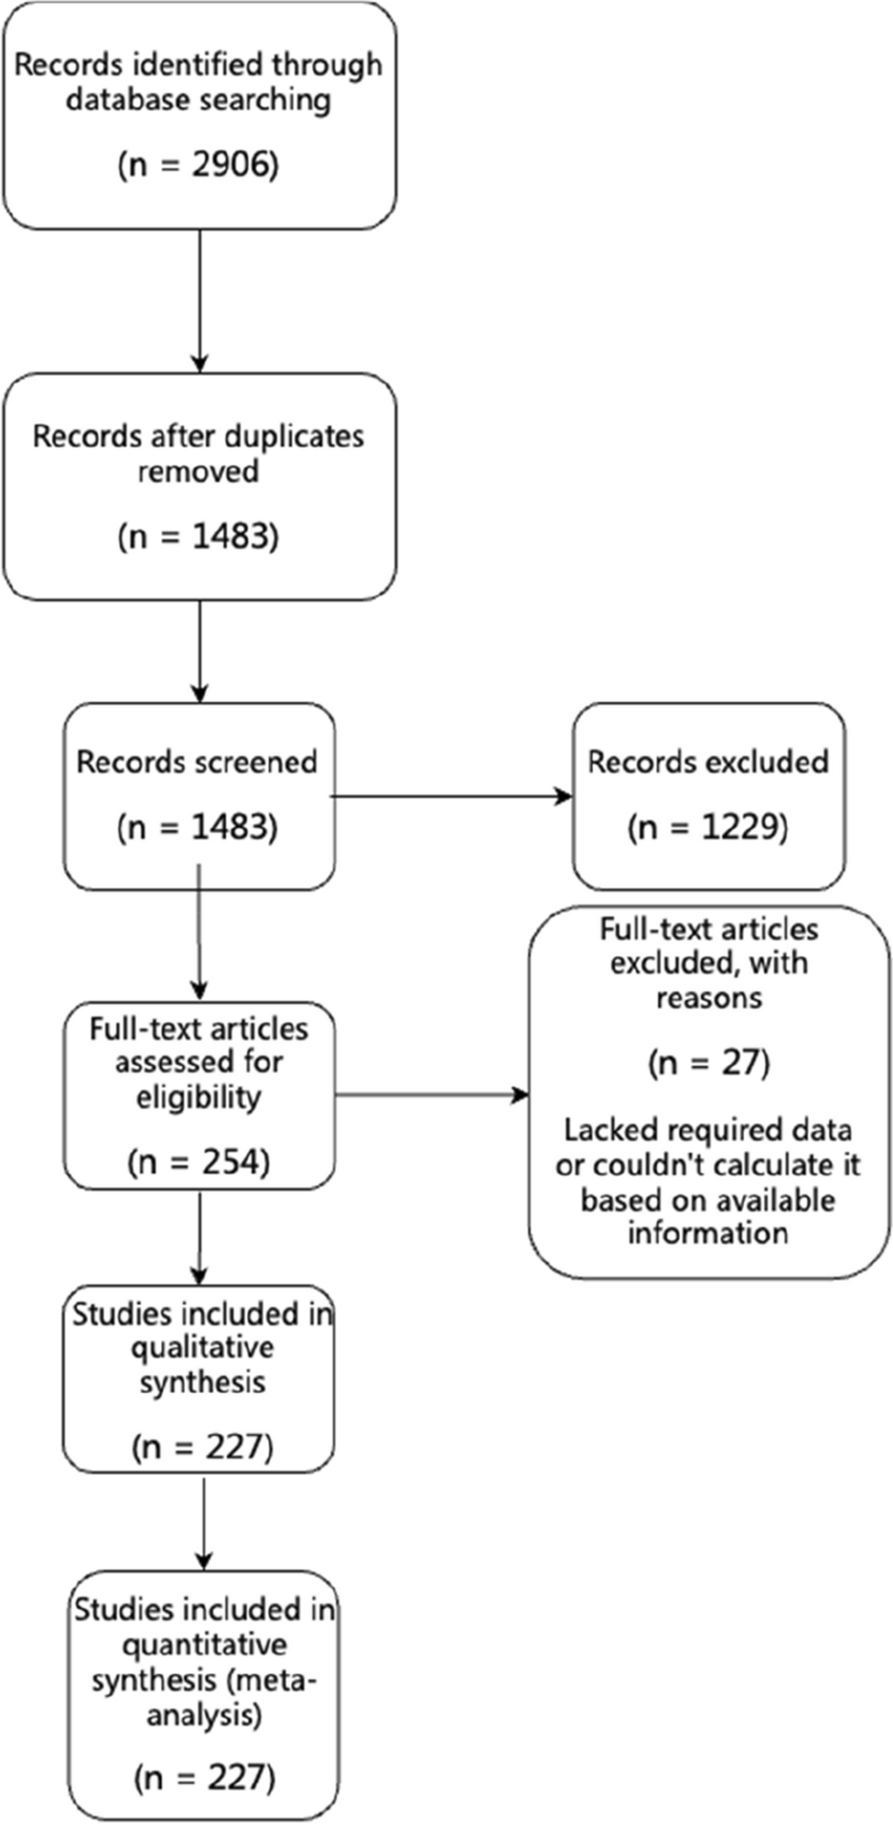


As described in Fig. 1, a total of 760 studies were identified initially after the online searching by title, keywords, or abstract. One hundred fifty-eight duplicate records, 7 animal researches, 71 review or meta–analysis and 2 vitro experiment were removed. And then 513 items were excluded after reviewing the title and abstract. A number of 9 items were retrieved in full-text. Three trials were excluded by full-text reviewing, one of them was a retrospective cohort study and two of them reported inappropriate inclusion criteria. Finally, 6 studies were found eligible for the consequent analysis (Fig. 1).
Fig. 1
Flow diagram of the literature search strategy
Study characteristicsThe main characteristics of these included studies were summarized in Table 2. These randomized controlled trials were published from 2008 to 2021, recruited a total of 859 patients (ages ranged from 1 months to 12 years) were recruited. Among these, 254(29.6%) were girls and 605 (70.4%) were boys. 428 children received DEX-midazolam and 431 patients received the other sedatives, including 82 with chloral hydrate, 136 with DEX, 20 with midazolam-propofol, 93 with dexmedetomidine-(chloral hydrate), 60 with dexmedetomidine-propofol, and 40 by midazolam. The dosages and routes of sedatives were varied, as presented in Table 2. DEX was administered intranasally (1–3 µg/kg) or intravenously (0.5–0.7 µg/(kg·h)). Midazolam was delivered orally (0.3 mg/kg), intravenously (0.05-0.1 mg/kg), intranasally(0.3 mg/kg) or buccally (0.1-0.2 mg/kg). Chloral hydrate 50 mg/kg was orally administered. Propofol was delivered intravenously (67–300 µg/(kg·min)). The procedural sedation was assisted to complete the computed tomography (CT), magnetic resonance imaging (MRI), Auditory Brainstem Response (ABR) test, and fiberoptic bronchoscopy.
Table 2 Basic characteristics of 6 included studiesRisk of bias assessmentWe evaluated included studies [14, 16,17,18,19,20] according to the Cochrane risk-of-bias tool to assess risk of bias, including random sequence generation, allocation concealment, blinding of participants and personnel, blinding of outcome assessment, attrition bias, reporting bias, and other bias. All studies reported the method of random sequence generation, and three of them described an adequate allocation concealment scheme in detail. Four trials mentioned the blinding procedure of participants and personnel and the blinding procedure of outcome assessment. Three of them were high-quality trials with low risk of bias in all items. One study was moderate-quality study and 2 studies were accessed as being low quality. The overall quality of included studies was moderate. The more detail of quality assessment was shown in Fig. 2.
Fig. 2
Summary risk assessment of literature bias
Primary outcomesSuccess rate of sedationAll six studies with 859 patients were analyzed about the sedation success rate. The I2 was equal to 51% (higher than 50%), demonstrating that statistical heterogeneity was existed among the studies. The random effects model was chosen for meta-analysis. The results of success rate of sedation in these included RCTs showed that sedation with dexmedetomidine-midazolam group by intranasal, intravenous, oral, or buccal routes had a statistically higher success rates than other sedatives groups (OR 2.92; 95% CI: 1.39–6.13, P = 0.005, I2 = 51%; Fig. 3A). In the sensitivity analysis, we excluded study of Ji YY 2020[15] and found that the value of I2 decreased to 0%, indicating that this trial had highly heterogeneity. After analyzing the full text carefully, it was found that the heterogeneity was mainly derived from clinical heterogeneity. The children included in the study of Ji YY 2020[15] were ASA physical status I to III, while other included studies were ASA grades I or II. Subgroup analysis still showed that the using of dexmedetomidine-midazolam was associated with higher success rate of sedation compared to other sedatives(OR 3.31; 95% CI: 2.13–5.13, P<0.00001, I2 = 0%; Fig. 3B).
Fig. 3
Efficacy of dexmedetomidine-midazolam vs. other sedatives sedation in children. (A) Success rate of sedation; (B) the sensitivity analysis of success rate of sedation
Secondary outcomesOnset time of sedationThe onset time of sedation was reported in four studies. There was statistical heterogeneity among the studies (P<0.00001, I2 = 97%; Fig. 4A), so the random effect model was used for meta-analysis (Fig. 4A). The results showed that there was no statistically significant difference in the onset time of sedation in ASA I-III children given dexmedetomidine-midazolam compared with those receiving other sedatives. Subgroup analysis showed that there was no statistical heterogeneity in ASA I-II children among the studies (P = 0.24, I2 = 30%; Fig. 4B), so the fixed effects model was used for meta-analysis. Dexmedetomidine-midazolam showed significantly quicker onset time than the other sedatives in subgroup analysis (WMD=−3.08; 95% CI: −4.66 to − 1.49, P = 0.0001, I2 = 30%;Fig. 4B).
Fig. 4
Efficacy of dexmedetomidine-midazolam vs. other sedatives sedation in children. (A) Onset time of sedation; (B) the subgroup analysis of onset time of sedation; (C) the recovery time of sedation
Recovery time of sedationTwo studies reported the recovery time of sedation. Due to no statistical heterogeneity between them (P = 0.76, I2 = 0%; Fig. 4C), the fixed effects model was adopted for meta-analysis. The result revealed that the difference of recovery time of sedation between dexmedetomidine-midazolam group and other sedatives group was not significant (WMD = − 0.27, 95% CI: − 0.93 to − 0.39, P = 0.42; Fig. 4C).
Occurrence of adverse eventsAdverse reactions were reported in all included trials. The fixed effects model was utilized for meta-analysis because of no statistical heterogeneity among the studies (P = 0.11, I2 = 45%; Fig. 5A). The results indicated that there was no significant statistical difference in the occurrence of adverse reactions between dexmedetomidine-midazolam sedation and other sedatives (OR 0.70; 95% CI: 0.48–1.02, P = 0.06, I2 = 45%; Fig. 5A). Subgroup analysis showed there was no significant statistical difference in the incidence of bradycardia between dexmedetomidine-midazolam group and control group (OR = 0.73; 95% CI: 0.33–1.63, P = 0.44, I2 = 12%; Fig. 5B). Three studies reported incidence of hypotension. As shown in Fig. 5C, the incidence of hypotension in dexmedetomidine-midazolam group was similar to other sedatives group, and the difference was not statistically significant (OR = 0.83; 95% CI: 0.24–2.89, P = 0.77, I2 = 73%; Fig. 5C). In the sensitivity analysis, we excluded study of Ji YY 2020[15] with high heterogeneity and found that the value of I2 decreased to 0%. However, there was still no remained significant difference in the incidence of hypotension between two groups (OR = 1.52; 95% CI: 0.74–3.14, P = 0.25, I2 = 0%). Five trials reported the occurrence of nausea and vomiting. A fixed effects model was chosen for meta-analysis for no statistical heterogeneity among the studies (P = 0.84, I2 = 0%; Fig. 5D). According to the results, DEX combined with midazolam showed a lower incidence rate of nausea and vomiting than other sedatives (OR = 0.23, 95% CI: 0.07–0.68, P = 0.008; Fig. 5D).
Fig. 5
Safety of dexmedetomidine-midazolam vs. other sedatives sedation in children. (A) The occurrence of adverse reactions; (B) incidence of bradycardia; (C) incidence of hypotension; (D) incidence of nausea and vomiting
Publication bias and trial sequential analysisThe funnel plot (Fig. 6) exhibits asymmetrical distribution of study results, skewed towards the right side. This suggests a potential publication bias in the included articles, possibly indicating an overestimation of success rate of sedation in smaller studies. The results of the TSA analysis are shown in Fig. 7, the horizontal dashed line represents the traditional boundary for statistical significance. The red curve indicates the futility boundary. The cumulative z-curve represents the trial data. The results indicate that Z-curve crossed both the traditional threshold and the TSA threshold, but the cumulative information size did not reach the expected value. However, due to a certain degree of heterogeneity and publication bias among the included studies, it indicates that there is some uncertainty in the reliability of the current conclusions. Further verification and refinement of the analysis results will require more large-sample, high-quality studies in the future.
Fig. 6
Funnel plot for the longitudinal observational studies on the success rate of sedation
Fig. 7
Line graph showing trial sequential analysis for the success rate of sedation in included randomized controlled trials. RIS = the required information size
留言 (0)