
記住我


This retrospective observational study was conducted in compliance with the Declaration of Helsinki, and was approved by the Institutional Review Bord of Kagoshima University Hospital. The requirement for obtaining informed consent was waived owing to the retrospective nature of the study; however, the content of the study was publicly disclosed on the Kagoshima University Hospital homepage, enabling the participants or their designated representatives to opt out of participation.
PatientsWe identified 173 consecutive patients diagnosed with pancreatic head cancer who underwent NAT prior to intended PD at Kagoshima University Hospital, between January 1, 2015 and December 31, 2022. The analysis set comprised 136 patients after excluding cases corresponding to absence of pre-NAT computed tomography (CT) images (n = 5), preoperative ductal stent placement (n = 5), pancreatic enzyme replacement therapy (PERT) (n = 24), or variance in clinical course (n = 3). All clinical data were obtained from the electronic medical records of Kagoshima University Hospital and its affiliated institutions.
Evaluation and definition of pancreatic ductal occlusionPancreatic ducts were evaluated for occlusion (Fig. 1A, B) or non-occlusion (Fig. 1C, D) by a radiologist (TA, KT) and the principal investigator (YH) using pre-NAT CT images. Magnetic resonance cholangiopancreatography images were referenced when available.
Fig. 1
Representative images of cases with and without pancreatic ductal occlusion. A and B CT (A) and MRCP images (B) of a 69-year-old man with pancreatic ductal occlusion showing pancreatic cancer (arrows) and a dilated main pancreatic duct (arrowhead). C and D, CT (C) and MRCP images (D) of a 73-year-old man without pancreatic ductal occlusion showing pancreatic cancer (arrows) and an undilated main pancreatic duct (arrowhead). CT computed tomography, MRCP magnetic resonance cholangiopancreatography
Pancreatic ductal occlusion was defined as tumor obstruction of both the main and accessory ducts and a dilated upstream main pancreatic duct (MPD) ≥ 3 mm, which was set as the cutoff referring to a previous report [22]. The MPD was measured on cross-sectional CT images of the presumed transection line of the pancreas near the portal vein.
Neoadjuvant treatment and adjuvant chemotherapyThe NAT regimens in this study were as follows: (i) gemcitabine plus tegafur/gimeracil/oteracil (S-1) therapy (GS therapy) (n = 43) [23]; (ii) nab-paclitaxel plus gemcitabine therapy (GN therapy) (n = 50) [24]; (iii) chemoradiotherapy (CRT) with or without additional GS or GN therapy (CRT) (n = 35); and (iv) other treatments (n = 8). CRT included external-beam radiation with concurrent S-1 administration. Other regimens included a modified combination therapy of folinic acid, fluorouracil, irinotecan, and oxaliplatin (mFOLFIRINOX) (n = 1) [25]; any two chemotherapy regimens from S-1 monotherapy, GS, GN, and mFOLFIRINOX therapy (n = 4); S-1 plus proton therapy (n = 2); and radiation-alone therapy (n = 1). The content, intensity, and cycles of NAT were established in accordance with standard protocols, but were adjusted when necessary, by the attending physician based on the patient's condition and treatment efficacy.
In this study, adjuvant chemotherapy involved a 6-month regimen of S-1 monotherapy as the standard protocol [26]. Patients who experienced adverse reactions to S-1 then received gemcitabine monotherapy (n = 6) [26] or GN therapy (n = 1). Twenty patients did not receive adjuvant chemotherapy.
Clinicopathological dataThe following data were collected: age, sex, resectability (based on the National Comprehensive Cancer Network guidelines version 2. 2021), NAT regimen, completion of NAT and PD, and the interval (days) from the initiation of NAT to surgery. In addition, we collected data on complications and determined from a history of treatment or preoperative blood biochemical examination findings (diabetes: hemoglobin A1c ≥ 6.5%; chronic kidney disease: estimated glomerular filtration rate < 60 mL/min/1.73 m2), pre- and post-NAT carbohydrate antigen 19–9 (CA 19–9) levels, the provision of preoperative biliary drainage, hematologic adverse events after NAT (≥ grade 3 based on Common Terminology Criteria for Adverse Event version 5.0), NAT treatment effect (based on Response Evaluation Criteria in Solid Tumors version 1.1), tumor-node-metastasis stage (based on the Union for International Cancer Control 8th edition), pathological tumor size, histological type and grade, Evans’ criteria [27], resection margin, operation time, operative blood loss, postoperative hospital stay, postoperative complications (Clavien–Dindo classification ≥ grade IIIa; POPF ≥ grade B [2]; DGE ≥ grade B [3]; and PPH ≥ grade B [4]), and provision of adjuvant chemotherapy and postoperative PERT.
Nutritional assessmentBody mass index (BMI) was obtained at pre- and post-NAT assessments. Albumin concentration (g/dL), lymphocyte count (/mm3), and C-reactive protein (CRP) (mg/dL) were obtained at pre- and post-NAT blood biochemical assessments. Pre-NAT BMI and blood biochemical data were obtained 18.0 days (interquartile range [IQR] 2.0–26.0 days) and 24.0 days (IQR 17.0–33.0 days) before NAT initiation, respectively. Post-NAT BMI and blood biochemical data were obtained 2.0 days (IQR 1.0–3.0 days) and 18.0 days (IQR 13.0–27.0 days) before PD, respectively.
Onodera’s PNI (10 × albumin g/dL + 0.005 × lymphocyte /mm3) [8] and GPS (GPS score = 2: both CRP > 1.0 mg/dL and albumin < 3.5 g/dL; GPS score = 1: CRP > 1.0 mg/dL or albumin < 3.5 g/dL; GPS score = 0: neither CRP > 1.0 mg/dL nor albumin < 3.5 g/dL) [9] were evaluated as described previously, using pre- and post-NAT blood biochemical data.
Image analysisPre-NAT CT images were obtained 32.0 days (IQR 21.0–42.0 days) before NAT initiation, and post-NAT CT images were obtained 24.0 days (IQR 14.0–41.0 days) before PD. Pancreatic morphology was evaluated using pre-NAT cross-sectional CT images. The MPD (mm) and pancreas (mm) were measured on the presumed transection line of the pancreas near the portal vein. Pancreatic parenchyma (mm) was calculated as follows:
Pancreatic parenchyma (mm) = size of the pancreas (mm) – size of the MPD (mm).
In addition, the ratio of the MPD to parenchymal thickness was calculated as follows [28]:
Duct–parenchymal ratio = size of the MPD (mm)/size of the pancreas (mm).
To evaluate muscle mass, L3-level cross-sectional CT images obtained pre- and post-NAT were used. The cross-sectional area of the bilateral psoas muscles (cm2) was measured by manual tracing, and the PMI was calculated as follows [10]:
PMI = Area of bilateral psoas muscle/height2 (cm2/m2).
To evaluate adipose tissue content, Dicom images corresponding to the L3-level cross-sectional CT images obtained pre- and post-NAT were analyzed automatically using SYNAPSE VINCENT software (Fujifilm Medical Co., Ltd., Tokyo, Japan). Tissue HU thresholds were set as follows: −190 to −30 HU for SAT and −150 to −50 HU for VAT [29]. SAT (cm2) and VAT (cm2) were divided by the square of the height to calculate the SAT index (SATI) and VAT index (VATI), respectively, as follows:
SATI = SAT/height2 (cm2/m2).
VATI = VAT/height2 (cm2/m2).
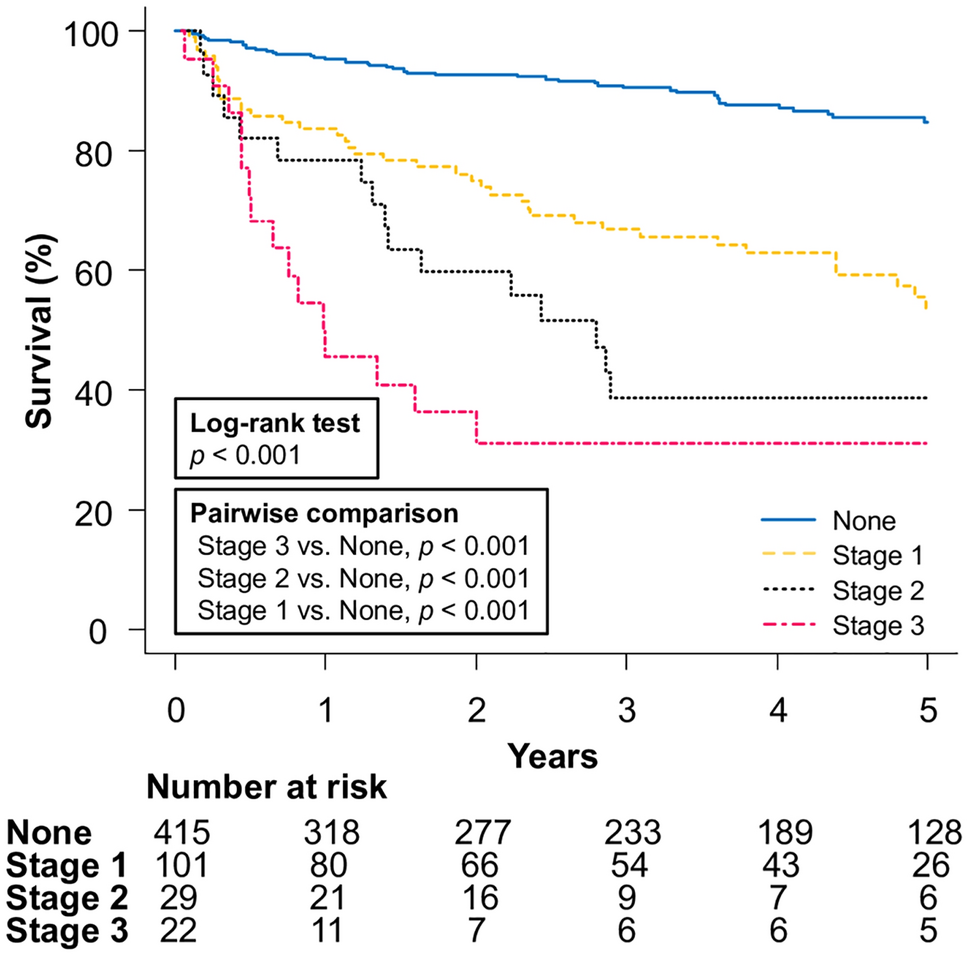
Statistical analysesData are presented as percentage or median and IQR values. Differences between groups were evaluated using the χ2 test, Fisher’s exact test, or Mann–Whitney U test. A two-sided p < 0.05 was regarded as statistically significant. Relationships between pancreatic morphology and nutritional and anthropometric indices were analyzed with Spearman’s rank correlation coefficient (rs). The Kaplan–Meier method was used to evaluate the 3-year survival and recurrence-free survival (RFS) rates after PD, and comparisons between groups were performed using the log-rank test. Univariate and multivariate analyses were performed using the Cox proportional-hazard model to identify potential prognostic factors influencing overall survival (OS) and RFS after PD. In the multivariate model, age, sex, and pancreatic ductal occlusion were selected as the clinically relevant variables, while resectability, pathological TNM stage and tumor size were selected as risk adjusting variables clinically influencing the survival analysis of this study. Stata version 18 (Stata Corp LLC, College Station, TX, USA) was used for all analyses.
留言 (0)