
記住我


Vision, the primary human sense, processes 80% of the information collected from the external environment. The intricate functions of the retina play a pivotal role in vision, integrating various information to facilitate comprehension of the external world. Unfortunately, 253 million people globally are deprived of this extraordinary sensory experience due to blindness, according to the World Blind Union. Various eye conditions, such as corneal injuries, retinitis pigmentosa, age-related macular degeneration (AMD), and diabetic retinopathy, frequently lead to vision impairment and even total blindness. These conditions present significant challenges for effective treatment using current medical technology, making vision restoration a distant goal.
Currently, the quest for vision restoration through artificial vision technology has become a hot research topic (Towle et al., 2021). A comprehensive understanding of the complex neural mechanisms regulating color vision is essential for developing advanced and efficient artificial vision systems. As technology evolves, the research and implementation of artificial visual prostheses are exceeding natural visual limitations, providing unprecedented opportunities for visual restoration for the visually impaired.
Color vision holds a central role in human perception of external stimuli, offering precise object recognition and evoking profound emotional experiences (Valberg and Seim, 2008). However, the neural mechanism of color vision is complex, involving synergistic processes from the retina to the cerebral cortex (as shown in Figure 1). While physiological experiments can verify the process of vision generation, fully describing color vision perception remains challenging due to the complexity of neural mechanisms. A deeper understanding of this system requires not only meticulous experimental tools but also interdisciplinary research methods to reveal the basic principles of color perception (Pennartz et al., 2023).
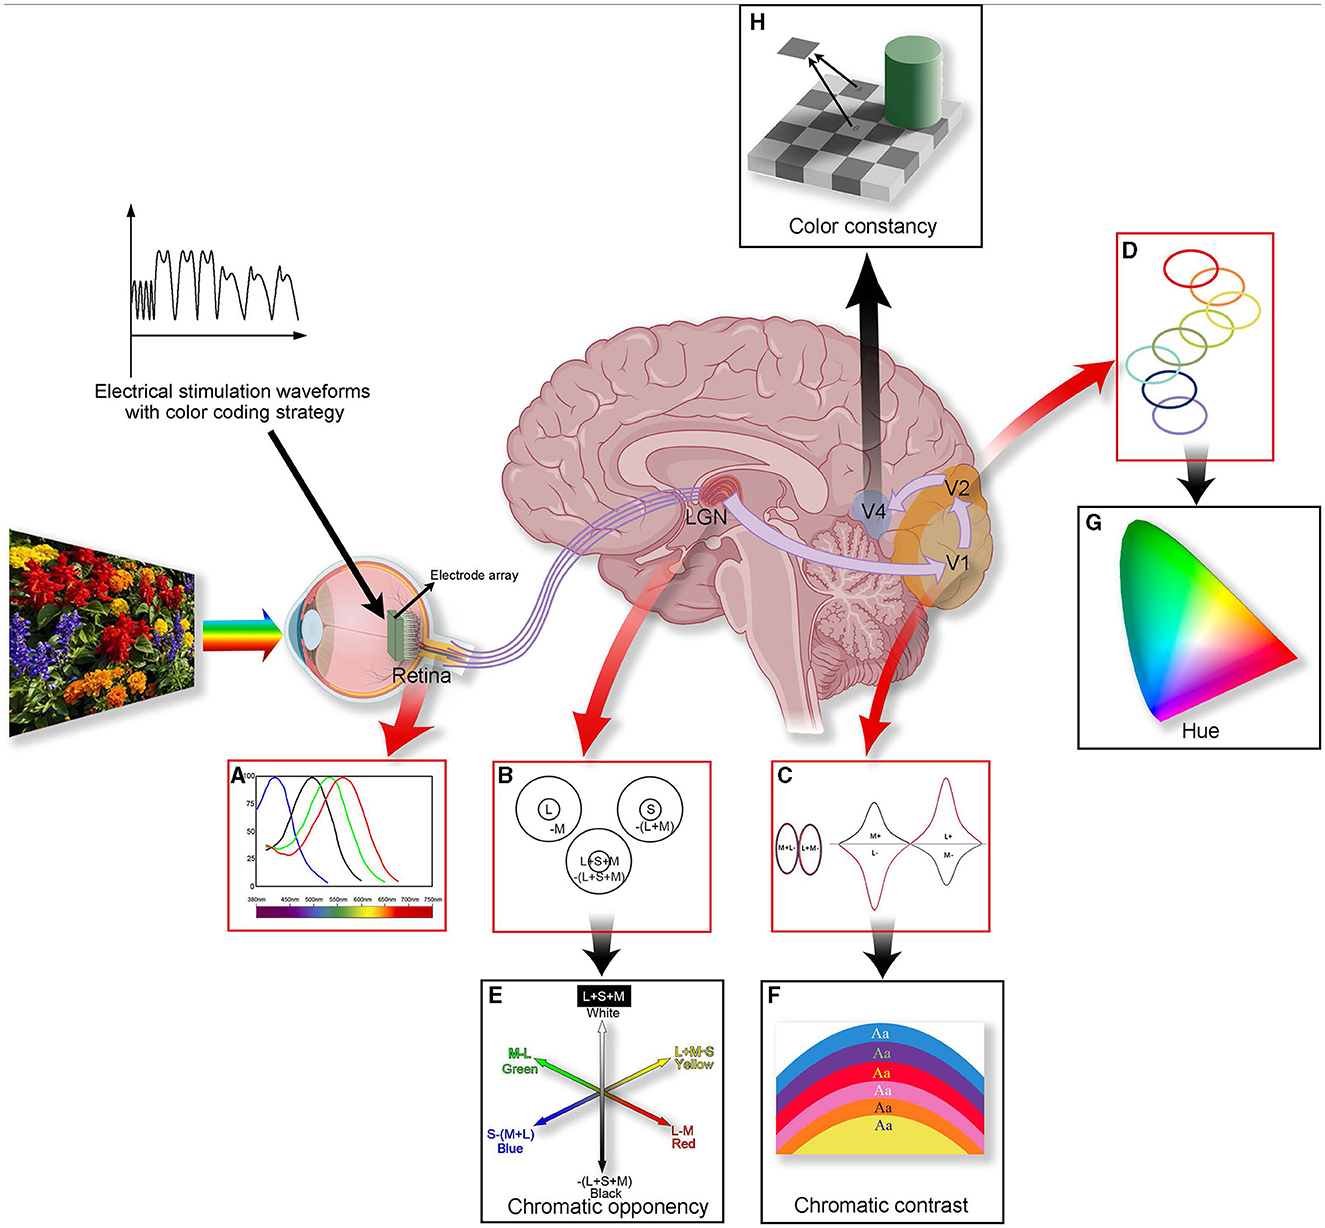
Figure 1. A summary of color processing in the color visual system. The figure illustrates the anatomy (the middle figure), physiology (A–D), and perception (E–H) of color vision. Three types of visual cone cells (L, M, and S) capture information about different light frequencies based on their relative light absorption (A). Cells within the LGN compare the cone signals (B). Some cells' receptive fields are excited by L cone cells and are suppressed by M cone cells (forming “red-green” cells); others are excited by S cones and suppressed by (L + M) cones (forming “blue-yellow” cells), forming the basis for chromatic opponency (E). In V1, specialized “double-opponent” cells compare cone ratios in specific visual spaces with those in adjacent areas (C), probably constructed from LGN color cells, and they perform color contrast calculations (F). The color signal then proceeds to V2, where specific hues are represented in color bands spanning the thin stripes of V2 (D), potentially contributing to our perception of hue (G). In V4, more cells will be associated with color constancy (H). Processing color information involves multiple layers and is a complex process. Introducing coding strategies into artificial vision may lead to achieving controlled artificial color vision for the blind in the future.
It is widely accepted that color vision exploration starts with photoreceptors that perceive the primary colors, red, green, and blue, forming the foundational hues of the color world (Figure 1A). By using unique coding strategies, retinal ganglion cells (RGCs) transmit color information to the brain's higher structures. The retina and lateral geniculate nucleus (LGN) facilitate efficient color discrimination using complex transmission and opponent processes in the external environment (Figures 1B, E). The visual cortex in the brain is crucial for processing and integrating color information. Here, contrast (Figures 1C, F), hue (Figures 1D, G), and complex color vision information are deeply processed (such as color constancy, e.g., Figure 1H), forming our comprehensive perception of colors. The sophistication and efficiency of this system enable rapid and accurate human responses to rapidly changing environments.
For people suffering from visual impairment, traditional aids, such as canes, guide dogs, and braille, offer some assistance, but they do not fully replicate the rich informational experience offered by natural vision. Consequently, the development of visual aids, including wearable and implantable devices, especially artificial visual prostheses, has attracted significant interest. These advanced technological innovations aim to restore natural visual perception by emulating and replacing the impaired visual system, thereby providing an opportunity for individuals who have lost their sight to regain visual experiences (Guenther et al., 2012; Martino et al., 2013; Wang and Kuriyan, 2020; Lin et al., 2021).
Artificial visual prostheses are created by implanting electrodes or similar devices into the retina, optic nerve, LGN, or visual cortex. These devices capture external information and stimulate the retina with electrical signals to technically replicate natural vision functionality. Encouraging results have enabled some blind patients to regain limited visual perception (Hornig et al., 2017); however, contemporary artificial aids are significantly limited. Typically, they offer low-resolution, dichotic (black/white) vision, failing to provide realistic, natural visual experiences (Towle et al., 2021; Wu et al., 2023). Research in artificial visual technologies requires not only hardware and software innovations but also a deep understanding of color vision principles and mechanisms. This multidisciplinary challenge encompasses engineering, neuroscience, and computer science, aiming to accurately simulate the intricate process of color vision.
This paper aims to explore the neural mechanisms of color vision, ranging from basic visual cells to advanced brain information processing, to elucidate human color perception and understanding. In addition, We will analyze the contributions of artificial visual prostheses and their potential applications in color vision and suggest some new concepts for future artificial color vision technology. Current artificial vision devices restore some visual functions, but none specifically address controlled color vision restoration. This review aims to clarify the complex mechanism of color vision and establish a scientific foundation for developing artificial color vision technology. Ultimately, we hope to inspire researchers to create a controlled artificial color vision device. In this era of challenges and opportunities, we strive to advance artificial vision through our understanding of color vision mechanisms and innovative research in artificial color vision prostheses, thereby providing hope to those who seeking sight restoration.
2 Neural mechanisms of color vision 2.1 Trichromatic cones—The basis for the production of color visionThe study of color vision mechanisms has been vital in vision science for a long time. Artists have recognized for centuries that mixing three colors can yield a multitude of hues. Three primary colors act like orthogonal bases in linear space: none can be created by combining the other two, yet together, they can generate every color in the spectrum. Inspired by artists' color mixing, Young (1802) first proposed the trichromatic theory in the early nineteenth century. Maxwell (1857); Von Helmholtz (2013) later expanded upon this. This theory posits that human color perception relies on three primary color-receptive fibers: red, green, and blue. The theory's strength lies in explaining color mixing. It states that any color can be achieved by varying proportions of red, green, and blue. Color perception results from the simultaneous stimulation of three different light-sensitive fibers in particular ratios.
However, the trichromatic theory cannot completely explain all color phenomena. This includes negative afterimages and color blindness mechanisms. Current understanding shows that individuals with normal color vision possess three retina cone cells termed L, M, and S. These cones contain different photo-pigments sensitive to various wavelengths. Their absorption peaks correspond to 560, 530, and 425 nm, respectively (Figure 2) (Nathans, 1999). Organisms with a single class of photoreceptors cannot perceive color. This is because photoreceptor activation depends on both wavelength and stimulus intensity, even if there is a peak in the absorption spectrum.
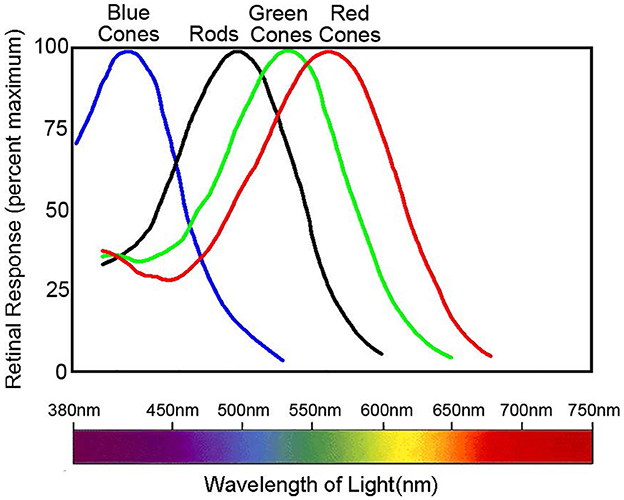
Figure 2. Normalized spectral sensitivity of retinal rod and cone cells. Data sourced from Nathans (1999). The peak absorption of the spectra by the three classes of cones, L, M, and S, is 560, 530, and 425 nm, respectively, whereas the peak absorption of the rods is around 500 nm. The figure illustrates the normalized spectral absorption peaks of the four cells. However, in fact, rods will only respond in very dark environments and depolarize in normal light intensity.
Missing or anomalous cones can result in color blindness (Sharpe et al., 1999). The absence of a single type of cone can result in an inability to distinguish colors, which is easily understood. For instance, individuals with protanopia lack L-type cones, preventing them from perceiving red light, resulting in a tendency to see colors as shades of blue or gold. Individuals with protanomaly have all three types of cones present, but the L cones exhibit reduced sensitivity to red light. Red may appear as dark gray, and colors containing red may appear less bright. Colorblind glasses enhance color perception for individuals with mild forms of anomalous trichromacy. These glasses enhance color contrast, enabling individuals with color vision deficiencies to perceive color differences more distinctly. While there is currently no cure for most causes of color blindness, ongoing research is investigating gene therapy as a potential treatment for some severe cases (El Moussawi et al., 2021).
Indeed, L, M, and S cone cells are not evenly distributed across the visual field, as is desired for a screen display. Notably, in the retinas of primates and the majority of mammals, the density of S cones is significantly lower than that of L and M cones (Martin and Grünert, 1999). The distribution of S cones, constituting 5–10% of all cones, is well-defined (Curcio et al., 1991; Martin and Grünert, 1999; Hofer et al., 2005). The distribution of L and M cones, on the other hand, appears random. Additionally, individual differences exist in the ratio of L to M cones, which ranges from roughly 1:1 to 1:17 (Hofer et al., 2005). This was due to chromatic aberration. L cones detect both energy and wavelength contrast, while S cones are only dedicated to wavelength contrast. Chromatic aberration causes short-wavelength images to be out of focus when longer-wavelength images are in focus on the photoreceptor mosaic. This phenomenon enhances the dominance of the L cone system in energy contrast detection. Consequently, many mammals possess more L cones than S cones to enhance spatial resolution via the achromatic contrast detected by L cones (Gouras, 1995). Interestingly, the relative proportions of cones scarcely affect color vision. This implies that the brain utilizes adaptive and synthetic mechanisms to interpret color information from the signals provided by cones (Neitz et al., 2002; Jacobs et al., 2007).
For more technical details on the synaptic physiology and anatomy related to photoreceptors, one may read some excellent reviews in this field (Schmitz, 2009; Mercer and Thoreson, 2011; Regus-Leidig and Brandstätter, 2012).
2.2 Retinal ganglion cells—Visual encoding strategiesThe retina first encodes visual information integrally and then projects it to the LGN for further processing (Figure 3). In the outer plexiform layer, cones and rods use glutamate as a neurotransmitter that affects bipolar and horizontal cells. Bipolar neurons receive signals from photoreceptors and transmit them to RGCs. Horizontal cells and amacrine cells modulate the transmission of information from photoreceptors to bipolar cells and from bipolar cells to RGCs, respectively. RGCs process and integrate this information, then transmit electrical signals via neural axons to relay cells in the LGN. The encoding of information by RGCs represents the most crucial link in this process.
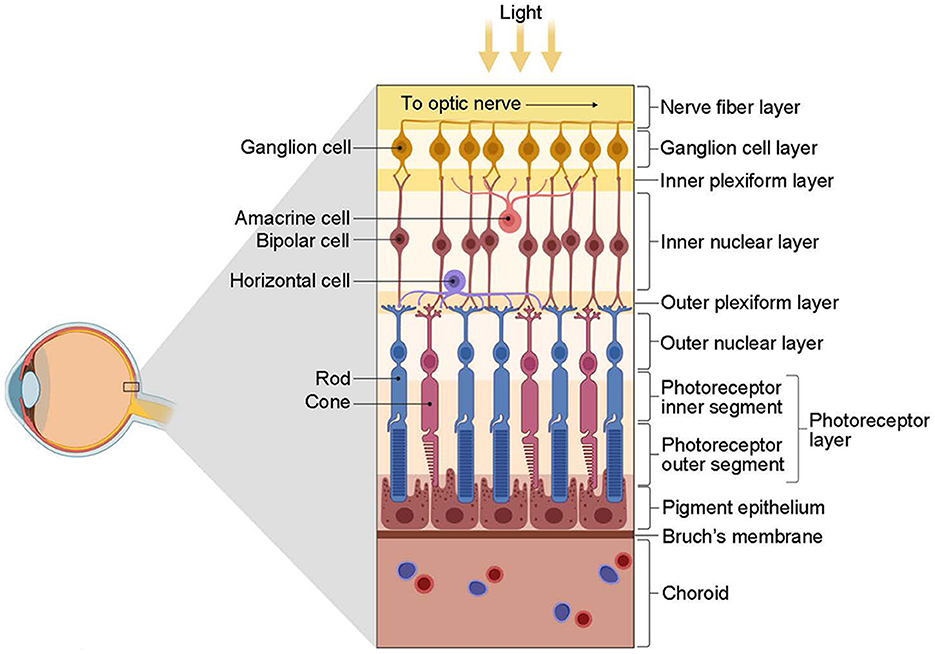
Figure 3. The structure of the retina (from Kim, 2020). The retina is primarily composed of three layers of neurons. The first contact with light is the ganglion cells, followed by the bipolar cells and, finally, the photoreceptors, including the cones and rods. However, photoreceptors are the first to respond to light. Interconnecting these three types of cells is two types of interneurons, namely, horizontal cells and amacrine cells. These cells have distinct roles and functions: photoreceptors receive light stimulation and convert it into electrical energy, eliciting nerve impulses; bipolar cells facilitate information transmission between photoreceptors and RGCs predominantly; horizontal cells and amacrine cells regulate the transmission of information from photoreceptors to bipolar cells and from bipolar cells to RGCs, respectively; RGCs are accountable for processing and integrating information, conveying electrical signals via nerve axons to the relay cells of the LGN, eventually reaching the visual cortex to engender vision. Created with BioRender.com.
In 1926, Adrian and Zotterman (1926) discovered a positive correlation between the firing rate of sensory neurons in a frog and the pressure of touch stimuli. Subsequently, similar changes in firing rate were observed in the retina. For instance, when the stimulus brightness changed, the firing rate of tortoise RGCs also changed positively (Thiel et al., 2006). This correlation was similarly noted in rabbit RGCs (Risner et al., 2010). These findings suggest that frequency coding is a method by which the retina encodes visual information. However, later studies revealed that frequency coding alone is inadequate for processing visual information. It fails to explain the visual system's response to complex stimuli, such as primates' rapid recognition of faces and facial features. The cortex takes ~100 ms to respond to these stimuli after reception by temporal lobe neurons (Crouzet et al., 2010). However, visual information must pass through at least 10 synaptic transmissions from photoreceptors to these neurons. This implies that each processing stage cannot exceed 10 ms. Within these 10 ms, most neurons can only generate a maximum of one action potential (Thorpe et al., 2001). Consequently, neurons cannot rely on the time difference between two action potentials to determine the instantaneous firing rate, which rules out frequency coding alone.
Besides frequency, RGCs encode time series features in their action potentials. A key aspect is the response delay of RGCs. Research indicates that stimulus intensity modulates the response delay of RGCs. Specifically, higher brightness or contrast results in a shorter response delay (Levick, 1973; Risner et al., 2010). Additionally, researchers discovered that the delay in the first action potential from RGCs encodes the spatial information in the stimulus image rapidly, as shown in Figure 4 (Gollisch and Meister, 2008). Considering this response delay, the recognition accuracy for various brightness and color stimuli significantly improved in experiments (Fernández et al., 2000; Greschner et al., 2006). Moreover, the duration of stimulation also affects neuronal response delay (Xiao et al., 2014). Beyond response delay, RGC activity includes other temporal features, such as the time difference between action potentials, which is crucial for encoding visual information (Rullen and Thorpe, 2001).

Figure 4. Visual stimulation is encoded by the response latency of retinal ganglion cells (Gollisch and Meister, 2008). (A) A photograph of a swimming salamander larva is projected onto the salamander retina. The ellipse in the upper right corner illustrates the receptive field of a salamander ganglion cell. During each stimulation trial, the image is slightly shifted based on the grid of dots. This allows for recording the responses of the depicted ganglion cell to all pixels in the photograph. (B) The firing activities of the depicted ganglion cell are illustrated, with each dot representing a spike at receptive field locations along the column, indicated by the arrows in (A). (C) A visual image is reconstructed using a gray-scale plot based on the spike latency in each trial. (D) Corresponding gray-scale plot of the spike counts.
In addition to time-scale features, the synchronous response correlation of RGCs may encode color and other visual information. For instance, in frogs, the synchronous oscillatory activity of RGCs strongly correlates with visual processing in escape responses (Ishikane et al., 2005). This synchronous activity among visual neurons depends on specific features of visual stimuli. Although this activity is important for integrating sensory information, its exact importance and purpose have not been completely comprehended. Another example involves chickens' retinas, where single neurons show a positive correlation with light intensity (Chen et al., 2004). This correlation strengthens with red or green light but weakens with yellow or white light. This suggests that the collective activity of RGCs might play a role in processing and encoding color information. This specifically influences the processing of red and green light information. Researchers discovered that the correlation among bullfrog RGC populations can distinguish grid, horizontal raster, and vertical raster stimuli (Jing et al., 2010). This is notable because individual neuron firing patterns do not significantly vary among these three stimulus types. The receptive fields of adjacent RGCs are also adjacent. Thus, the correlated firing of neuron populations might encode more detailed spatial information (Pillow et al., 2008). The interaction within the higher levels of neuron populations results in group encoding complexity that surpasses the encoding capability of a single neuron.
RGCs employ various methods to encode visual information. This diversity equips the nervous system with effective tools to adapt to complex visual information. This is reflected in several key aspects: first of all, more efficient information transmission; despite being few in number, retinal RGCs deal with highly diverse visual information. Multiple coding methods enable these cells to transmit visual information efficiently, ensuring vital information reaches the posterior visual center effectively. Secondly, we consider adaptation to different stimulus conditions; various stimuli may necessitate different coding methods. RGCs can flexibly switch coding modes to adapt to diverse visual stimuli such as brightness, color, and movement, enabling them to more comprehensively encode visual scenes. Thirdly, this activity reflects biological information processing diversity; various coding methods offer diverse information-processing approaches. For instance, frequency coding, time characteristic coding, and correlation coding provide information from different perspectives during transmission, enhancing the nervous system's flexibility in processing visual information. Finally, using multiple encoding methods simultaneously can greatly enhance the accuracy of stimulus recognition. When considering factors such as firing rate, response delay, and group activity among neurons, retinal RGCs achieve more precise recognition of visual stimuli, leading to refined and comprehensive information processing. These flexible coding strategies guarantee the retina's accuracy and efficiency in transmitting visual information despite a limited number of nerve cells.
2.3 Retina and lateral geniculate nucleus—Color opponencyFollowing light excitation, rods and cones are responsible for modifying the release of glutamate vesicles at synaptic terminals. This changes the membrane potential of subsequent cells, including bipolar cells. In vertebrates, the opponency starts at the first synapse. Here, horizontal cells control the reciprocal inhibition of photoreceptors, enabling two-way information exchange. Opponency is a neural computational rule; it involves comparing a neuron's activity to a stimulus parameter, leading to inhibited neuronal activity. Hering (1878) originally proposed this model. He posited that color perception arises from opposite color mechanisms and that our visual system contains opposing color channels such as red/green, blue/yellow, and black/white. Hurvich and Jameson (1955, 1957) have made more improvements to the color opponency concept in the contemporary period, demonstrating that the perception of red can be counterbalanced by green and yellow. Color opponency serves as an effective mechanism for eliminating redundancies from overlapping the spectral sensitivities of various photoreceptor cells and reducing spectral redundancies in natural images (Buchsbaum and Gottschalk, 1983; Lee et al., 2002). This opposite feedback mechanism is prevalent throughout the visual system. The brain encodes and simplifies visual information by comparing visual signals through subtraction or proportional analysis.
In the outer plexiform layer, glutamate released by cone pedicles depolarizes horizontal cells. The horizontal cells then provide negative feedback to the originating cone and surrounding cones (Figure 5) (Burkhardt et al., 1988; Twig et al., 2003; Thoreson et al., 2008). This interaction among cone cells and horizontal cells leads to color opponency at the visual system's first synapse. As a single photoreceptor cannot differentiate wavelength shifts from intensity changes, the opponent process occurs between at least two types of photoreceptors with different spectral sensitivities (Krauskopf et al., 1982). Horizontal cells typically have a wide receptive field, attributed to their large dendrites and strong intercellular coupling. Consequently, the horizontal cells' negative feedback to cones forms a broad opponent receptive field. This field surrounds a small, excited central region in the cone while inhibiting the surrounding region. This integrated, central-peripheral-receptive field information is relayed to bipolar cells and, ultimately, to RGCs. As previously mentioned, this mechanism operates by subtracting the average light level, as detected by horizontal cells across a broad area, from the light response of a central cone. This process efficiently removes spatially redundant brightness and color information, enhancing signal transmission efficiency (Kamermans et al., 2001; Jackman et al., 2011; Chapot et al., 2017).
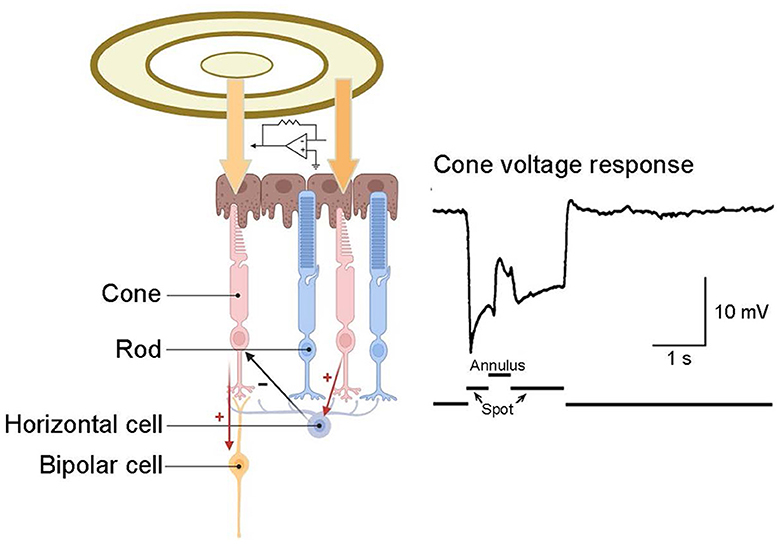
Figure 5. Inhibitory feedback from horizontal cells to cones. A recording from a turtle cone reveals that illuminating this cone with a small spot of light elicits a hyperpolarizing response. The subsequent application of an annulus to illuminate the surrounding receptive field induces hyperpolarization in the surrounding cones, leading to hyperpolarization in their postsynaptic horizontal cells. This alteration in inhibitory feedback from horizontal cells to the central cone elicits a depolarizing response in that cone. Cone response adapted from Burkhardt et al. (1988).
The parvocellular pathway is primarily composed of midget RGCs. Functional evaluations reveal that their sensitivity to luminance contrast is lower compared to parasol RGCs, and most exhibit distinct chromatic opponency (Wiesel and Hubel, 1966). Typically, midget cells display red-green opponency, while parasol RGCs lack chromatic sensitivity, and bi-stratified ganglion cells link with S cone ON and L-M cone OFF pathways. Recent research suggests that certain OFF midget cells receive signals from short wavelength (blue)-sensitive cones (Tsukamoto and Omi, 2015; Wool et al., 2019). Electron microscopy reconstructions propose that a small fraction of midget ganglion cells may possess blue OFF and yellow ON receptive fields. Besides color discrimination, midget RGCs contribute to pattern recognition, texture discrimination, and stereoscopic depth perception (Schiller, 2010).
These complex signals undergo initial processing by bipolar cells, and this is then followed by further processing by various RGCs (Sernagor et al., 2001). Most RGCs transmit signals to the LGN via axons, and LGN cells relay these signals to the visual cortex through their axons. Under most neurophysiological experimental conditions, the conversion of visual signals between RGCs and LGN neurons is minimal and is typically considered a linear projection (Usrey et al., 1999). For instance, parasol RGCs project to magnocellular (M cells) neurons, while midget RGCs connect to small parvocellular (P cells) neurons. Additionally, small, bi-stratified RGCs and those with less defined characteristics, and these project to koniocellular (K cells) neurons (Hendry and Reid, 2000; Hashemi-Nezhad et al., 2008; Roy et al., 2009).
The color sensitivity of the three types of cells in the LGN varies based on cone opponency (De Valois et al., 2000). When a specific type of cone cell is activated, it triggers cone opponent cells to discharge at a frequency above a certain threshold. Conversely, the activation of another type of cone cell results in a reduced discharge frequency. Most neurons in the M cell layer are responsive to changes in luminance. Luminance is a combination of L and M cone signals and lacks color selectivity. Neurons in the P cell layer primarily focus on the difference between L and M cone signals (“L-M”), whereas neurons in the K cell layer respond to differences between S cone signals and the sum of L and M cone signals [“S-(L+M)”] (Hendry and Yoshioka, 1994). These three types of LGN neurons exhibit sensitivity to color changes in directions that closely align with the psychophysically defined “cardinal directions” of red-green, blue-yellow, and black-white in color space (MacLeod and Boynton, 1979; Krauskopf et al., 1982; Derrington et al., 1984). The combined activation and suppression of these opposing channels shape our perception of different colors. Cone opponent cells perform calculations that are essential for distinguishing between wavelength and intensity, serving as fundamental components in color vision (Devalois and Devalois, 1993).
Subsequently, each LGN projects to a specific region in the primary visual cortex (V1). Currently, the role of the LGN in processing color signals remains unclear. Our focus here is on cone opponent cells in both the retina and the LGN. When a specific type of cone cell is activated, it triggers cone opponent cells to discharge at a frequency above a certain threshold. Conversely, activation of a different type of cone cell results in a reduced discharge frequency. Various types of cone opponent cells exist, including red-green (L-M) cells, which compare L-type and M-type cone activations and blue-yellow (S-(L+M)) cells by comparing S-type cone activation with a combination of L and M cones (Dacey and Lee, 1994; Field et al., 2007). The combined activation and suppression of these opposing channels shape our perception of different colors. Cells activated by L cones are often termed “red-on” cells, while those activated by M cones are called “green-on” cells, and so on. Cone opponent cells perform calculations that are essential for distinguishing between wavelength and intensity, serving as fundamental components in color vision (Devalois and Devalois, 1993).
2.4 Visual cortex—Processing contrast, hue, and higher-order color information 2.4.1 V1: chromatic contrastAfter forming synapses in the LGN, visual information proceeds ventrally to the V1 in the occipital lobe. Within V1, diverse neurons specialize in processing various aspects of visual information. For instance, some neurons are responsive to color, orientation, motion direction, edge, and spatial frequency. Electrophysiological recordings often show local potential responses indicating red-green sensitivity in both the supra- and subcortical regions of V1. In layers II and III of V1, up to 64% of the cells are color-selective (Friedman et al., 2003). Studies employing magnetic resonance imaging (MRI) to analyze the human V1 have shown strong responses to red-green and yellow-blue tests (Engel et al., 1997). All these findings further support the role of the V1 region in color encoding.
Historically, it was believed that color, motion, and shape were processed in parallel by distinct modules within the visual cortex. This concept of modularity originated with Hering and was further developed by Hurvich and Jameson (1957). Krauskopf and colleagues later adopted this modular approach in their study of the fundamental directions of color space (Krauskopf et al., 1982). Unlike the spatial band-pass contrast sensitivity of luminance patterns, the red-green isoluminance pattern's contrast sensitivity is low-pass. This supports the modular view (Mullen, 1985). Zeki (1973, 1978a,b) later emphasized this modular view in his functional studies of the visual cortex's striations. In Zeki's studies, he highlighted that different striate areas in the macaque cortex specialize in various visual features. For example, cortex V5 predominantly comprises neurons responsible for direction selectivity, while region V4 is rich in neurons responsive to color.
Livingstone and Hubel's (1984, 1987, 1988) work on areas V1 and V2 also supports modularity, linking it to the parallel processing of color and shape in the LGN. In addition, Livingstone and Huble identified double-opponent cells in layers II and III of region V1, which is crucial for color perception. These cells are termed “double opponent” due to their opposite integration of antagonistic wavelength information from different cones and spatial information from various receptive fields. These cells have concentric receptive fields, activated or inhibited by central red light and surrounding green light, as shown in Figure 6. They respond more intensely to color boundaries and patterns than to extensive color areas (Livingstone and Hubel, 1984; Thorell et al., 1984; Johnson et al., 2001, 2008). Contrast is a key aspect of color perception, which likely relies on the signals from double-opponent cells. Psychophysical masking and adaptation experiments conducted in isoluminance mode indicate that double-opponent cells play a crucial role in the spatial frequency tuning of color channels (Bradley et al., 1988; Switkes et al., 1988; Losada and Mullen, 1994; Vimal, 1997; Beaudot and Mullen, 2005).
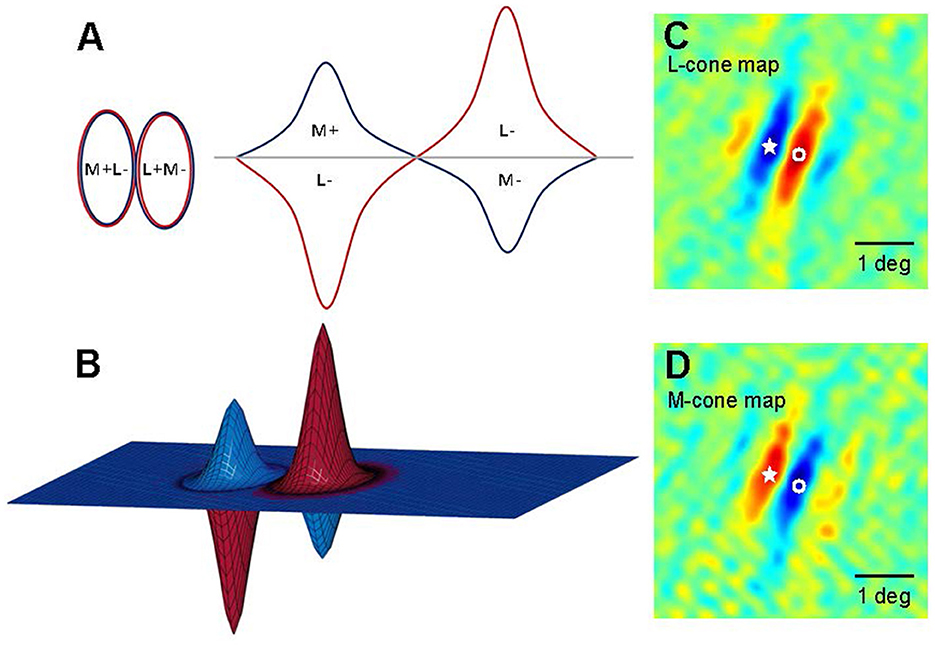
Figure 6. Models of double-opponent V1 neurons. (A) A schematic representation of receptive fields is depicted for a 2D plane of L-M opponent cells, exhibiting side-by-side spatial antagonistic regions and opponent cone weights. Weights above the horizontal plane indicate “ON” states, wherein an increase in light elicits an increase in response; conversely, weights below the horizontal plane signify “OFF” states, where a decrease in light leads to a decrease in response. The left panel illustrates the organization of the 2D receptive field, while the right panel presents a hypothetical spatial sensitivity profile. (B) A 3D schematic of the aforementioned receptive field model. (C, D) Two-dimensional maps (derived from subspace reverse correlation) depict the sensitivity of this cell to L (A) and M (B) cone isolation patterns (Johnson et al., 2008). Pseudo-color mapping indicates excitation to increases in red and excitation to decreases in blue. Fixation points within the visual field are denoted by stars and open circles to facilitate comparisons between L cone and M cone maps. At the star locations, L cone maps exhibit decreasing excitatory responses, whereas M cone maps show increasing excitatory responses; conversely, at locations labeled with open circles, the pattern is reversed.
The modular view suggests that while color vision functions may be less adept at processing shape, shape vision functions predominantly depend on luminance signals. However, psychophysical studies challenge this modular model by demonstrating similar thresholds in orientation discrimination for both color and luminance stimuli (Webster et al., 1990; Beaudot and Mullen, 2005). Similarly, the contour integration performance from local elements, whether of color or brightness, is comparable (McIlhagga and Mullen, 1996; Rentzeperis and Kiper, 2010). Additionally, recent experiments assessing changes in the orientation and color of two stripes have been inconclusive regarding the separability of color and orientation (Bimler et al., 2013). These lines of evidence suggest a potential interaction between color and spatial orientation mechanisms in the early stages of visual processing.
2.4.2 V2: hueAs early as 1984, Hubel discovered color-sensitive cytochrome oxidase (CO) blobs in area V1. Initially identified due to their affinity for cytochrome oxidase staining, the cells in these spots encode color information and project to the CO region of V2. This suggests a high concentration of color-selective neurons in the V2 cortical layers. Researchers estimate that over half of V2 neurons are color-sensitive, with a minority being selective for size and direction. There is no significant variance in the distribution of color-selective cells across different CO areas, nor a negative correlation between color selectivity and other attributes.
In V2, color-selective cells tend to be more concentrated in the thin stripes (Lu and Roe, 2008). Functional magnetic resonance imaging (fMRI) has also demonstrated clearer functional differentiation within these thin stripes (Conway et al., 2007). Individual neurons in V2 carry considerably less color information compared to those in V1. Despite this, there is no significant difference in color coding between V1 and V2 (Kiper et al., 1997; Solomon and Lennie, 2005).
By using optical imaging techniques, Xiao et al. (2003) discovered an intriguing phenomenon. They employed a sensitive camera to detect changes in tissue optical density indicative of activity in the V2 area. Responses to colors, including red, orange, yellow, greenish-yellow, green, cyan, blue, and purple, were measured. These colors were presented as isoluminance color-and-gray gratings. Altering the order of these gratings showed that the peak activity location in the V2 cortex also shifted sequentially for each color (shown in Figure 7). The area most responsive to red was adjacent to that for orange, followed by yellow, green, etc., creating a trend in peak activity locations corresponding to spectral frequency. This suggests a potential role of V2 in hue processing, though a definitive conclusion is yet to be drawn.
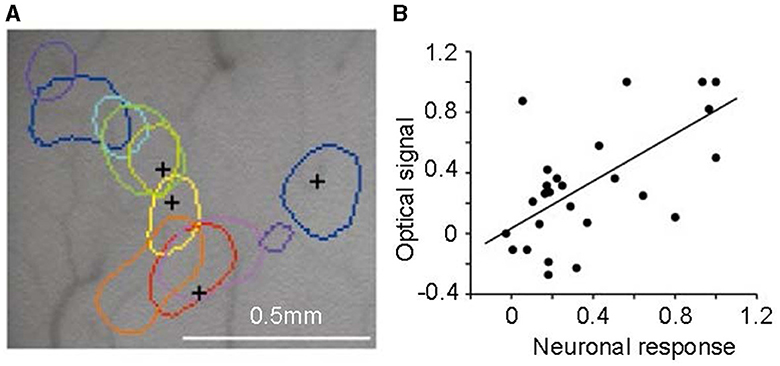
Figure 7. Color-specific band in the second cortical visual area (V2). (A) Regions corresponding to peak activity in response to different colored stimuli, each tested independently, are delineated on the surface image of the brain. (B) The correlation between neuronal responses recorded by multi-unit electrodes and optical signals in V2 color bands reveals a significant correlation between the two signal types. Adapted from Xiao et al. (2003).
These findings lead to the question, What is the true meaning of the neural representation of color? Currently, researchers focus on describing the patterns of brain activity in vision. One benefit is the potential development of artificial vision and brain stimulation devices to restore color vision in individuals with impaired visual systems.
2.4.3 V4: color constancyColor constancy is a key feature of the V4 region. Color constancy means that although the wavelength composition of light reflected by an object changes under different lighting conditions, the perception is that the object maintains a constant color.
For instance, an apple remains red both in light and in shadow. Color and brightness constancy is also found in V1 and V2 (Conway, 2001; MacEvoy and Paradiso, 2001; Shapley and Hawken, 2002), and the effects are especially prominent in V4 (Zeki, 1983). Studies have shown that background lighting alters the tuning of V4 neurons (Kusunoki et al., 2006). The cells adjust their color-tuning function in response to changes in the chromaticity of the illuminant. This adjustment corresponds with psychophysical perception (Schein and Desimone, 1990). Consistent with these findings, damage to V4 affects color constancy perception, although color discrimination remains intact (Heywood et al., 1992; Vaina, 1994). A recent fMRI study revealed a gradient in the visual hierarchy, from V1 to V4α, progressively encoding surface color rather than illumination (Bannert and Bartels, 2018). This finding offers a principled characterization of color constancy mechanisms across the visual hierarchy and shows complementary roles in the early and late processing stages.
3 Artificial visionExploring color vision mechanisms offers profound insights. Integrating these into artificial color vision device research is expected to drive scientific and technological breakthroughs in simulating human visual perception. With an understanding of the principles and mechanisms of color vision, the next step is exploring their simulation and optimization in artificial vision.
3.1 Implantable visual-assistive devicesArtificial vision represents a technology crafted to partially re-instate visual functionality in individuals who are blind or possess severely impaired vision. Artificial vision research started in 1929 with German neurosurgeon Otfrid Forester, who first electrically stimulated an exposed occipital lobe in a patient (Foerster, 1929). In the 1980s, William Dobelle achieved some success with the design of the first cortical implant (Hornig et al., 2017). This development laid the physiological foundation for creating visual prostheses to restore vision.
In the past three decades, artificial vision devices that electrically stimulate surviving visual neurons have become a promising treatment for restoring vision in the blind. Based on their location of implantation, artificial visual devices are categorized into retinal prostheses, optic nerve prostheses, LGN prostheses, and visual cortex prostheses (VCPs). Typically, images of the surrounding environment are captured utilizing specialized eyeglasses or camera devices. Subsequently, these images undergo conversion into electronic signals, which are then conveyed either directly to the retina or the visual center through electrical stimulation or to the retinal sensory nerves via micro-photodiode arrays embedded within the eye. Eventually, the electrical stimulation signals are transmitted to the visual cortex of the brain, eliciting visual perception.
Most visual prostheses are primarily designed to address retinitis pigmentosa (RP) and age-related macular degeneration, the two leading causes of blindness. However, as research progresses, visual prostheses may also become a treatment option for other eye diseases, such as glaucoma and eye trauma. Generally, if the nerve pathways behind the RGCs remain intact, patients can use all types of artificial visual devices. However, damage to the optic nerve disrupts the transmission of visual signals to the visual cortex, rendering retinal and optic nerve prostheses unsuitable. In such cases, a VCP is preferable. Retinal implants and visual cortex implants are the preferred sites for visual prostheses due to their location at both extremes of the visual pathway, making them more surgically accessible compared to deeper brain structures, such as the optic nerve and LGN.
Optic nerve implants have demonstrated the ability to induce phosphene by longitudinally implanting electrodes into the optic nerve (Veraart et al., 1998). However, their resolution falls short compared to that of retinal prostheses and VCP. Furthermore, the positioning of the implant on the optic nerve at the rear of the eye introduces unpredictability in the localization of phosphene (Chai et al., 2008). In contrast to implants that do not rely on an intact optic nerve and retina, VCPs are directly placed within the early optic cortex. Despite the expansive area of the optic cortex resulting in a relatively high resolution of the stimulating electrode, predicting the mapping of phosphene within the visual cortex remains equally challenging (Niketeghad and Pouratian, 2019). Electrical stimulation in the visual cortex can also predispose to epilepsy.
Based on the location of implantation, retinal implants are classified into three types: epi-retinal, subretinal, and supra-choroidal. The epi-retinal implant, which is placed in the front of the retina, has its electrical stimulator in contact with the ganglion cell layer, directly stimulating these cells to elicit a cortical response. The subretinal implant, positioned beneath the retina, features an electrical stimulator that contacts the photosensitive layer. The supra-choroidal implant is situated between the sclera and the choroid. Both subretinal and supra-choroidal implants aim to replace degenerated photoreceptors and stimulate the remaining bipolar cells in the retina (Stingl et al., 2017).
Technologically speaking, these devices transmit to the patient's retina by converting light signals into electrical signals. Several devices have been implanted in human patients, including Second Sight's Epiretinal Argus II (da Cruz et al., 2013), EpiRet's EpiRet III (Roessler et al., 2009), the Alpha IMS/AMS of Retina Implant AG (Stingl et al., 2013; Daschner et al., 2018), Australia Bionic Vision's supra-choroidal device (Ayton et al., 2014), Pixium Vision's IRIS II (Hornig et al., 2017), and the more recent subretinal PRIMA (Palanker et al., 2020).
While clinical results indicate patient progress in light detection, object classification, and large letter recognition, the visual resolution of these devices remains limited, making even simple object recognition challenging (Ayton et al., 2020). Essential capabilities such as facial recognition and color judgment are not yet achievable with these devices.
Snellen acuity is a common measure of visual acuity, where 20/20 denotes normal vision, and 20/200 indicates legal blindness. In clinical trials, the highest reported visual acuity for various devices so far is 20/1,260 from Argus II (Humayun et al., 2012), 20/546 from Alpha AMS (Daschner et al., 2018), 20/460 from PRIMA (Palanker et al., 2020), and 20/4,242 from Australian Bionic Vision (Ayton et al., 2014). As shown in Table 1, the visual effects generated by all artificial vision devices are still relatively low. The visual acuity and color discrimination abilities of these devices fall within the legally defined ranges of blindness.
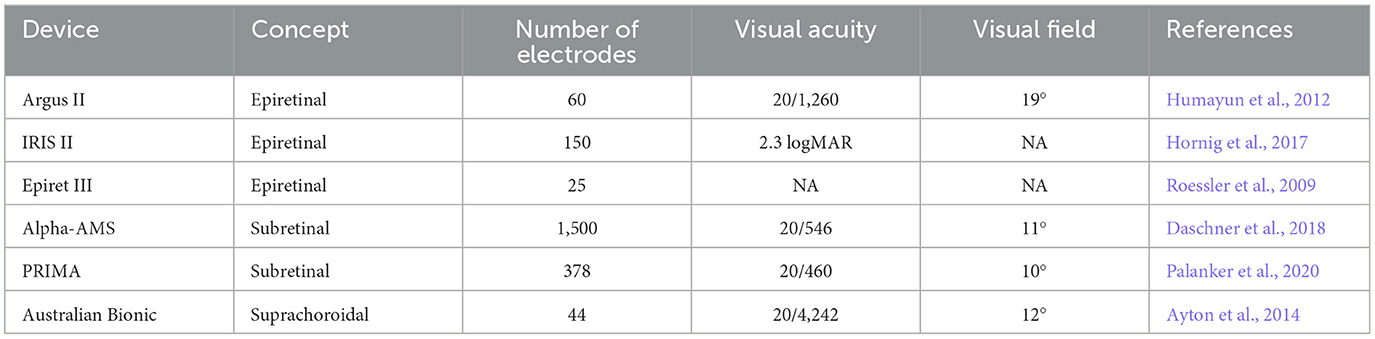
Table 1. Comparison of various artificial vision aid devices and techniques.
There are a total of 1.5 million RGCs in the human retina, with the largest soma having a diameter of about 30 um. Researchers have been studying how to make a smaller electrode. However, there are several technical limitations to using higher-density electrode arrays. For example, the impedance of electrodes increases when their size is reduced. High-impedance electrodes require higher voltage stimulation drivers, which consume more power. Many materials do not have suitable electrochemical properties to elicit neural activity within the safe charge injection limit.
The minimum accuracy is not only limited by the size of the electrode but also by limited temporal precision and the unselective activation of different visual pathways. For example, high-frequency repetitive stimulation to retinal cells can lead to loss of responses. In fact, we can easily make electrodes that are close to the size of retinal cells. However, such electrical stimulation does not allow cells and electrodes to respond one-to-one. Further studies on the spatial resolution, temporal resolution, and the selective activation of retinal cells are needed to make a color visual prosthesis with the appropriate resolution.
Additionally, the visual features produced by most artificial vision devices are black-and-white array blocks (Wu et al., 2023), with very few experiments resulting in color phosphene for subjects (Stanga et al., 2012). Although certain research endeavors have achieved colored phosphene by adjusting the stimulus parameters (Schmidt et al., 1996; Paknahad et al., 2021; Yue et al., 2021), as of now, there is no implantable artificial vision device (globally) capable of generating controlled artificial color vision. Therefore, how to design a controllable artificial color device has been a very important issue for researchers all over the world.
More reviews of artificial visual-assistive technology are available (Hornig et al., 2017; Fernandez, 2018; Wang and Kuriyan, 2020; Lin et al., 2021; Borda and Ghezzi, 2022).
3.2 Non-implantable visual-assistive devicesSensory substitution holds promise for visual rehabilitation among the visually impaired and blind (Maidenbaum et al., 2014). A sensory substitution device (SSD) is designed to convey visual information to the visually impaired by systematically translating visual data into one of their remaining senses. Typically, visual information is transformed into auditory or tactile sensations. For instance, visual data may be translated into voice (Auvray et al., 2007), music (Abboud et al., 2014), vibration (Song et al., 2024), electrical stimulation (Kajimoto et al., 2002; Nau et al., 2012), or a combination thereof. These sensory inputs are intricately coded to convey visual details to the blind individual, including color perception, distance estimation, and object recognition.
Sensory substitution typically relies on simpler sensing devices, such as computer vision or ultrasonic sensors, to acquire visual data. This offers the advantages of affordability, the absence of surgical risk and complications, and greater acceptance among the blind. However, the visual information provided is subject to the limitations of processing algorithms, resulting in reduced visual content and increased difficulty for patients to learn and operate. The device tends to be large in size with limited portability. More seriously, this approach takes possession of the remaining senses of the blind individual and does not necessarily improve vision, thereby heightening the risk in tasks such as navigation and wayfinding. In summary, the advancement of SSDs hinges largely on future advancements in computer vision, device integration, and sensor co-ordination.
Conversely, implantable visual aids typically offer improved vision and object recognition capabilities. Visual perception facilitated by electrical stimulation is easier to acquire later in life. The setup and operation are straightforward. Moreover, the devices are portable and not easy to find. However, due to the necessity of surgical implantation, patients are exposed to surgical risks and complications, and the higher cost leads to reduced patient acceptance. However, supra-choroidal prostheses are anticipated to propel research in the near future due to their minimally invasive nature, making them a viable clinical option. While cortical visual prostheses and some retinal prostheses remain largely experimental and uncerta
留言 (0)