
記住我


There were 57 patients with dust mite allergy (grade 1 or higher), including 28 patients (13 males, 15 females) without treatment, with a mean age of 7.5 years (range 5–13), 11 patients diagnosed with rhinitis, 3 patients with asthma and 14 patients with rhinitis mixed with other allergic disease (asthma/conjunctivitis/psoriasis/cough variant asthma). Nineteen patients had just entered the maintenance period (10 males, 9 females), with a mean age of 8.5 years (range 5–13) and a median treatment time of 23 weeks (16–36); 7 of these patients had rhinitis, and 12 patients had rhinitis mixed with other allergic disease. Finally, 10 patients (6 males, 4 females) had been treated with AIT at the highest dose for more than 1 year, with a mean age of 11.2 years (range 9–15) and a median treatment time of 95 weeks (84–142); 2 of these patients had rhinitis, 3 had asthma and 5 had rhinitis mixed with other allergic disease. The sIgE degrees of Derp1 and Derp2 are shown in Table 1. These patients were enrolled to investigate the differences in N-glycan expression between patients treated without AIT or with AIT to achieve allergic tolerance. The whole process is shown in the outline diagram (Fig. 1).
Table 1 Clinical characteristics of allergy patients under studyFig. 1
The outline diagram of the whole process to investigate the different N-glycan expression levels between patients treated without AIT and those treated with AIT
Alteration of serum N-glycans between each AIT-treated group and the untreated group of patientsSerum N-glycans were analyzed in allergic patients without and with AIT treatment, and 84 N-glycans were identified in all groups (Fig. 2 and Table 2). The proposed glycan structures were reported based on previous articles [34, 35]. The levels of 21 N-glycans were significantly changed between the 19 patients who had just entered the maintenance phase and the 28 patients without treatment: H5N2, H4N3, H6N2, H3N4F1, H7N2, H5N3F1, H8N2, H9N2, H4N4F1L1, H5N4L1, H5N5F1, H4N6F1, H10N2, H5N4F1L1, H4N5F1L1, H5N5E1Ac1, H5N5E1Ac2, H5N4F1L2 and H5N5LIE1 (m/z 1257.22, 1298.24, 1419.23, 1484.53, 1581.24, 1621.54, 1743.25, 1905.22, 1919.67, 1936.24, 2012.31, 2053.80, 2067.68, 2082.29, 2123.75, 2227.81, 2269.35, 2355.26 and 2458.31) were significantly decreased, and H5N4F1E2 and H7N6F1L2E2 (2447.34 and 3724.31) were significantly increased (p < 0.05) (Fig. 3a). There were 30 significantly changed N-glycans between the 10 patients who were treated in the maintenance phase for more than 1 year and considered allergic tolerant and the patients without treatment. The levels of H6N4L1, H5N4F1E1, H5N5L1, H6N4E1, H5N5E1, H5N5F1L1, H6N5F2, H4N6F1L1, H6N5E1, H4N6F1E1, H5N4F1L1E1, H5N5F2L1, H5N4F1E2, H6N5F1E1, H5N5E2, H5N5F1E2, H6N5E2, H6N5F1L1E1, H6N5F1E2, H6N5E3, H6N5F1L1E2, H6N5F1E3 and H7N6F1L2E2 (m/z 2098.71, 2128.28, 2140.30, 2144.75, 2185.30, 2285.31, 2320.60, 2326.83, 2347.31, 2372.30, 2401.33, 2431.86, 2447.34, 2493.30, 2504.32, 2650.37, 2666.39, 2766.37, 2813.41, 2986.44, 3086.42, 3132.43 and 3724.31) were significantly elevated, and the levels of H5N2, H3N4F1, H5N3F1, H4N4F1L1, H4N5F1L1, H5N5E1Ac2 and H5N4F1L2 (m/z 1257.22, 1484.53, 1621.54, 1919.67, 2123.75, 2269.35 and 2355.26) were significantly reduced (Fig. 3b).
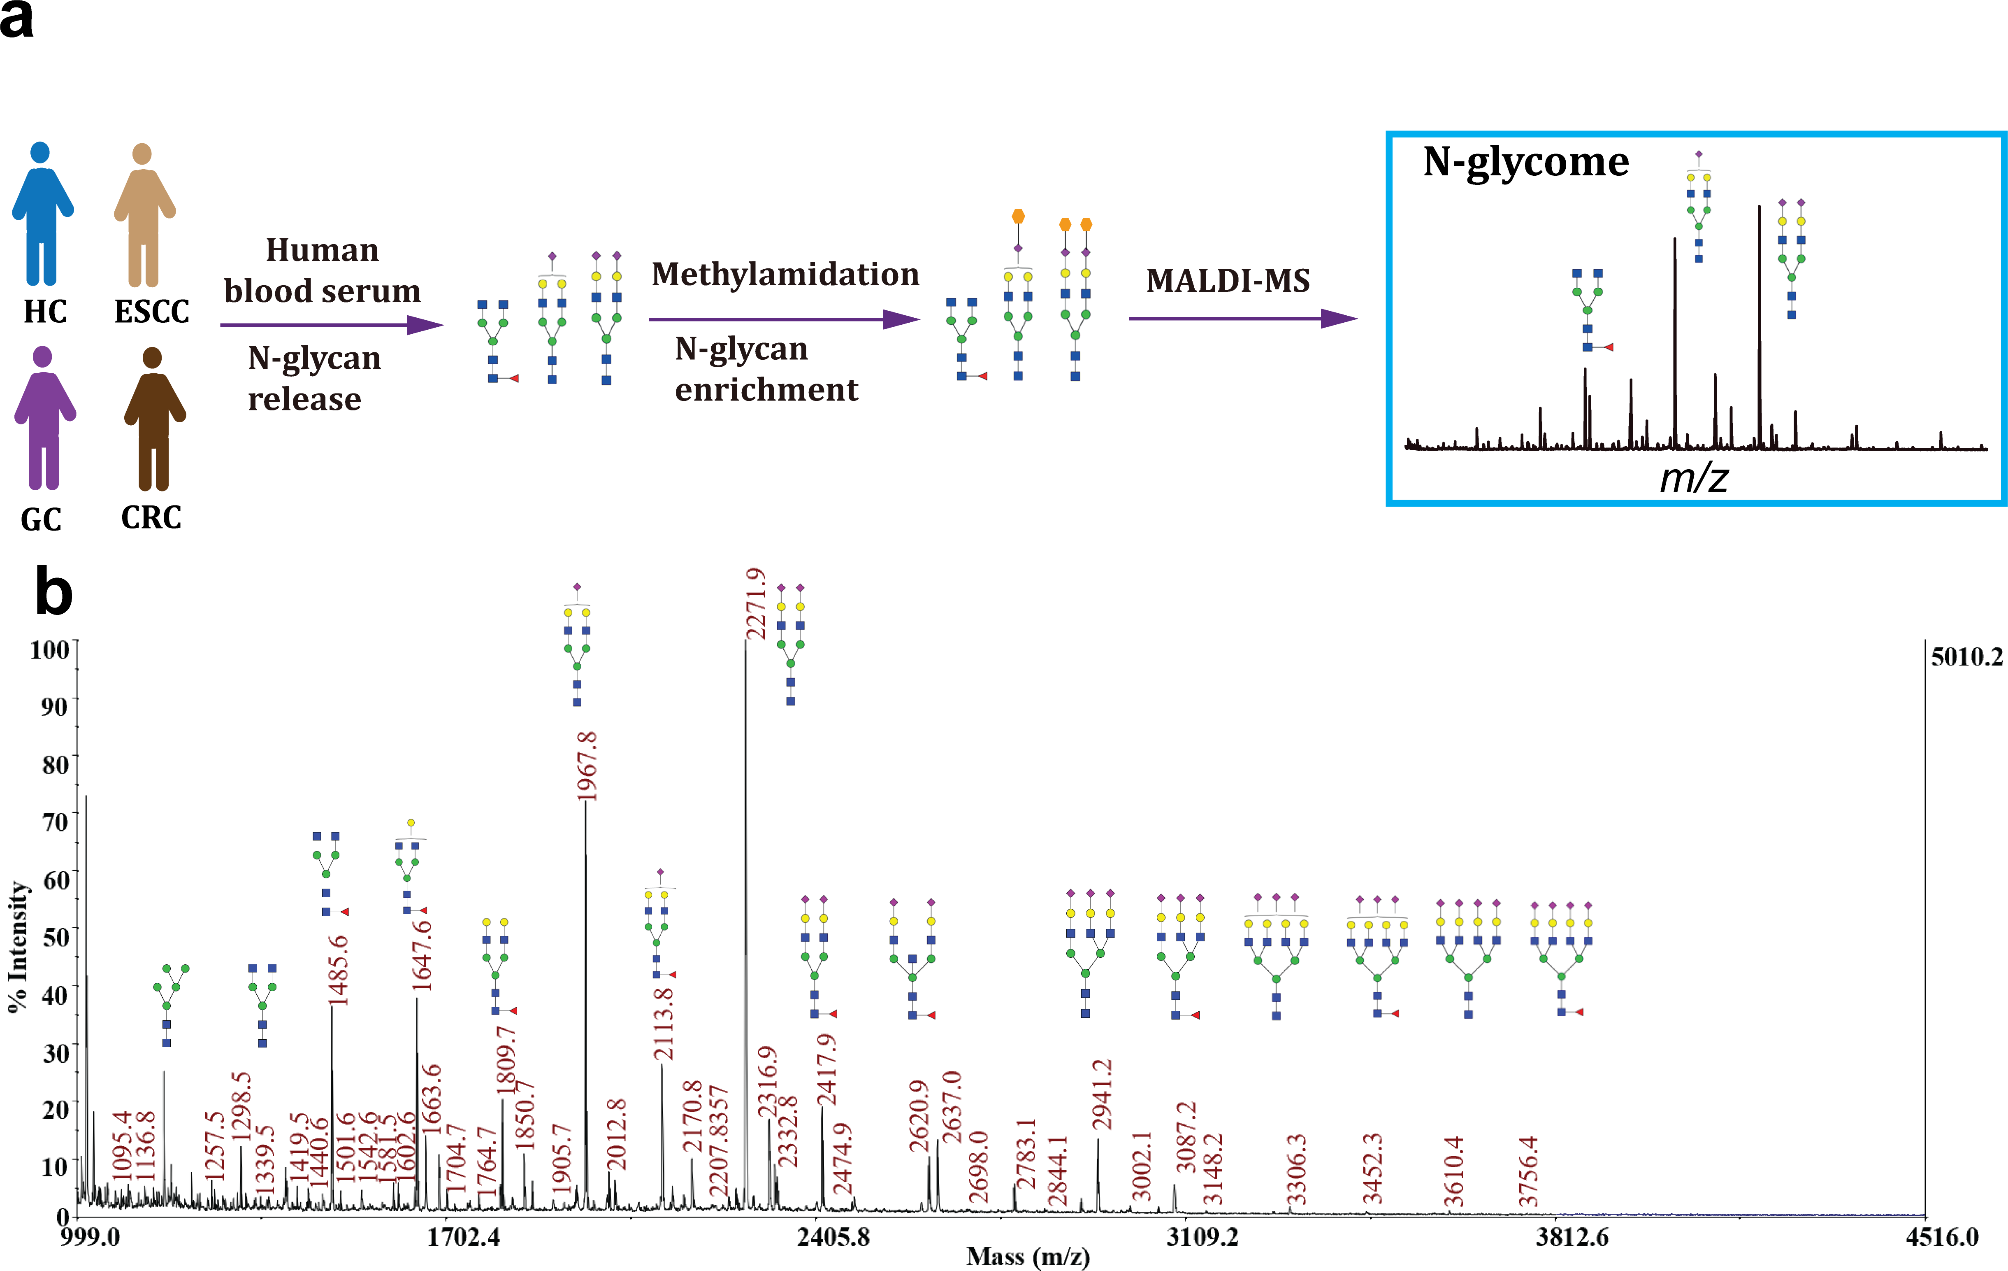
Fig. 2
Typical MALDI-TOF–MS spectra of allergic patients. The m/z range of the upper spectra is from 1000–2500. The m/z range of the lower spectra was 2500–4000, and the peak intensities were amplified tenfold to clearly show the peak. N-acetylglucosamine (GlcNAc): blue square; mannose (Man): green circle; galactose (Gal): yellow circle; sialic acid (NeuAc): purple lozenge; fucose (Fuc): red triangle. All cartoons described the possible structure matching the composition (other structure possibilities are not excluded)
Table 2 Relative intensities of proposed N-glycan structures in patients with or without AITFig. 3
Comparison of statistically significant relative intensities between the allergic patients treated without AIT and the allergic patients treated with AIT who had just entered the maintenance phase (a) and the allergic patients treated with AIT who had been in the maintenance phase over 1 year (b). The 84 most intense peaks were compared, and only statistically significant peaks are shown (*p < 0.01; **p < 0.05; *** p < 0.001; multiple testing correction was conducted: **** p < 0.05/84). The levels of nine N-glycans were changed constantly at two time points after AIT. The relative intensities of the nine N-glycans (c); Heatmap made by logging the relative intensities of these nine N-glycan chains in 57 patients with a base of 10 (d). Without AIT: patients were not treated with AIT; Time 1 after treatment: patients were treated with AIT and had just entered the maintenance phase; Time 2 after treatment: patients were treated with AIT and had been in the maintenance phase for 1 year. All cartoons described the possible structure matching the composition (other structure possibilities are not excluded)
Compared to those patients without treatment, the levels of nine N-glycans in the AIT-treated patients changed consistently with increasing treatment time (Fig. 3c). The levels of H5N2, H3N4F1, H5N3F1, H4N4F1L1, H4N5F1L1, H5N5E1Ac2 and H5N4F1L2 (m/z 1257.22, 1484.53, 1621.54, 1919.67, 2123.75, 2269.35 and 2355.26) were significantly decreased after AIT treatment, and the levels of H5N4F1E2 and H7N6F1L2E2 (m/z 2447.34 and 3724.31) were significantly increased. The expression of these 9 glycans in all patients is shown in a heatmap (log10 of the relative intensity). These consistent changes indicated that these glycans might play important roles during AIT treatment (Fig. 3d).
Levels of nine glycans were changed between allergic and allergic-tolerant patientsThe groups at time 1 and time 2 after treatment were evaluated for VAS scores before and after AIT treatment. After AIT treatment, the VAS score at time 1 after treatment was significantly decreased (z = −3.634, p < 0.0001), and the mean VAS score of this group changed from 4.63 (25%–75%, 2–7) to 1.32 (25%–75%, 1–2) before and after AIT treatment. The VAS score at time 2 after treatment was also significantly decreased (z = −2.388, p < 0.05), and the mean VAS score of this group changed from 2.5 (25%–75%, 1.75–4) to 0.7 (25%–75%, 0–2) before and after AIT treatment. Both groups were considered to improve after treatment. According to previous research, inflammation indicators started to change after 6 months and consistently indicated tolerance after treatment for at least 1 year [9]. Therefore, we defined the patients in the time 2 treatment group as allergic-tolerant patients who were treated with AIT for more than 80 weeks. Multiple testing correction was conducted to recognize more significant differences in glycans. After correction, there were no significantly changed N-glycans between time 1 after treatment and the untreated group, and there were 9 significantly changed N-glycans between time 2 after treatment and the untreated group. The levels of H4N5F1L1and H5N5E1Ac2 (m/z 2123.75 and 2269.35) were significantly decreased in patients with allergic tolerance, and the levels of H5N5L1, H6N4E1, H4N6F1E1, H5N4F1E2, H6N5F1E1, H5N5F1E2, H6N5F1E2 (m/z 2140.30, 2144.75, 2372.30, 2447.34, 2493.30, 2650.37, and 2813.41) were significantly increased (Fig. 3b, ****: p < 0.05/84).
Serum-derived glycans became more complex after AIT treatmentAfter classifying the N-glycans, the levels of 2 types of derived glycans were significantly changed in the serum of patients who had just entered the maintenance phase. The level of high mannose was significantly decreased, and the level of a2,6 sialic acid glycan was significantly elevated (Fig. 4A–J). Additionally, the levels of four types of derived N-glycans were significantly changed in the serum of patients in the maintenance phase of treatment for more than one year. The level of biantennary glycans was significantly reduced (Fig. 4D), and the levels of triantennary, tetra-antennary and multibranched glycans were significantly elevated (Fig. 4E–M). As the duration of treatment increased, the levels of high mannose and biantennary glycans decreased, and the levels of triantennary, tetra-antennary and multibranched complex glycans as well as a2,6 sialic acid increased, indicating a trend of simple to complex glycan forms in serum after AIT treatment (Fig. 4, supplemental material 2).
Fig. 4
Relative abundance of different derived glycosylation traits in the three groups. Box and whisker plots of high-mannose glycans (a), hybrid glycans (b), bisecting glycans (c), biantennary glycans (d), triantennary glycans (e), tetra-antennary glycans (f), fucosylation glycans (g), α2,3 sialic acid glycans (h), α2,6 sialic acid glycans (i), Lewis glycans (k), complex glycans (l), and multibranched glycans (m). The difference between traits was compared using an unpaired Student's t test. The p value was considered significant if it was below 0.05. *p < 0.05; **p < 0.01; ***p < 0.001. “ns.” indicates no significant difference, p > 0.05. Without: patients were not treated with AIT; Time 1: patients were treated with AIT and had just entered the maintenance phase; Time 2: patients were treated with AIT and had been in the maintenance phase for 1 year
留言 (0)