
記住我
Accidental falls, defined as “inadvertently coming to rest on the ground, floor or other lower level, excluding intentional change in position to rest in furniture, wall or other objects,”1 are among the leading hospitals’ adverse events, with incidence ranging from 2 to 20 events per 1.000 days/patients (depending on the setting of care).2–7 Accidental falls mainly concern fragile patients, especially those affected by dementia8: approximately a third of patients older than 65 years falls at least once a year and the 10% of the events causes significant injuries.9 Different factors, like age, sex, comorbidities, physical/psychological impairment, and drugs, tend to increase the risk of in-hospital factors.10
Approximately 78% of in-hospital falls as classified as predictable—being due to individual factors that need to be assessed at the clinical evaluation,11 while the remaining 14% are classified as accidentals (e.g., slipping on wet floors), and 8% as unpredictable in strict sense—being due to sudden individual factors (e.g., loss of consciousness). Indeed, a comprehensive assessment of the patient’s conditions is a key factor to prevent in-hospital falls that are to a large extent related to physical (e.g., degree of patient’ autonomy in the daily life activities), neurocognitive, biometabolical, emodynamical, and social factors.12–15 DEPendence and Clinical-Social Fragility indexes (DEP-CSF indexes) are commonly used to assess the fall risk, being able to evaluate risk factors like the caring complexity (Index of Caring Complexity), the functional dependence in daily life activities (Barthel index) and the need a more comprehensive discharge plan (Blaylock Risk Assessment Screening Score [BRASS]).16–18 Albeit—as just said—there are different DEP-CSF indexes based on different risk factors, there is no tool based on the combined assessment of multiple risk factors but for the Conley scale, which has six items and flags fall risk when more of an item is found.19 This tool is relatively easy to use; however, its sensitivity is 60% to 69% and specificity 41% to 61%, with positive predictive value of 2.7%.20–22 As such, many authors advise against the use of this only tool for a comprehensive assessment.14,16
The primary objective of this study was to assess the predictive power of 3 DEP-CSF indexes in identifying the in-hospital falls, and the secondary objective was to evaluate the association between DEP-CSF indexes and in-hospital falls risk.
MATERIALS AND METHODS Study DesignA monocentric case-control study was conducted at Fondazione Policlinico Universitario A. Gemelli IRCCS (Rome, Italy), by retrieving data of in-hospital patients from the electronic health records. The data referred to January 1, 2021, to July 30, 2021. The study was approved by the local ethics committee on April 7, 2022 (prot. 12720/22 ID: 4859).
Study PopulationsCases are defined as in-hospital falls as flagged by the incident reporting system of the hospital. An equal number of controls were considered, defined as in-hospital patients experiencing no falls in the same period. The 2 groups were homogeneous in terms of age (older than 18 y), education, kind of hospital admission (planned/unplanned), diagnosis at the admission, and type of discharge.
Samples SizeAs no similar study has been published in the literature, we assumed a dz (effect size) value of 0.5. Applying the Student t test with P values <0.05, it was estimated that at least 108 cases had to be analyzed.
Dependence and Clinical-Social Fragility Indexes Index of Caring Complexity16: it reflects the caring complexity. The scores range from 7 to 28, with critical values between 12 and 19 indicating high risk and between 7 and 11 very high risk; Barthel index17: it reflects daily life activities. The scores range from 0 (completely dependent on caregivers) to 100; BRASS18: it reflects recommendations regarding discharge planning. The scores going from 0 to 40 with values between 11 and 19 indicating high risk and between 20 and 40 very high risk. EndpointsThe primary objective of this study was to assess the predictive power of 3 DEP-CSF indexes in identifying the in-hospital falls, and the secondary objective was to evaluate the association between DEP-CSF indexes and in-hospital falls risk.
Statistical AnalysisSoftware Stata/IC v. 16.1 was used for statistical analysis. Shapiro-Wilk test was used as a test of normality. Variables of interest in the cases and in the controls were compared using Student t test and Mann-Whitney test. P values ≤0.05 were adopted as threshold for statistical significance. Accuracy and cutoff values were evaluated through receiver operating characteristics (ROC) curves. Finally, odds ratios (ORs) were calculated using χ2 tests to express the association between in-hospital falls and DEP-CSF indexes.
RESULTS Cases and ControlsOne hundred eight cases and 108 controls were included by applying the eligibility criteria. The 53.7% of the total study population was of male sex and the leading age group was the 71 to 80 (36.5% of the cases) followed by the 51 to 60 (17.5%). Main diagnosis at the admission was SARS-CoV-2 infection (25.9%) and most of the patients were discharged (75%) while the 8.3% of them died during the hospital stay. Other general characteristics are summarized in Table 1.
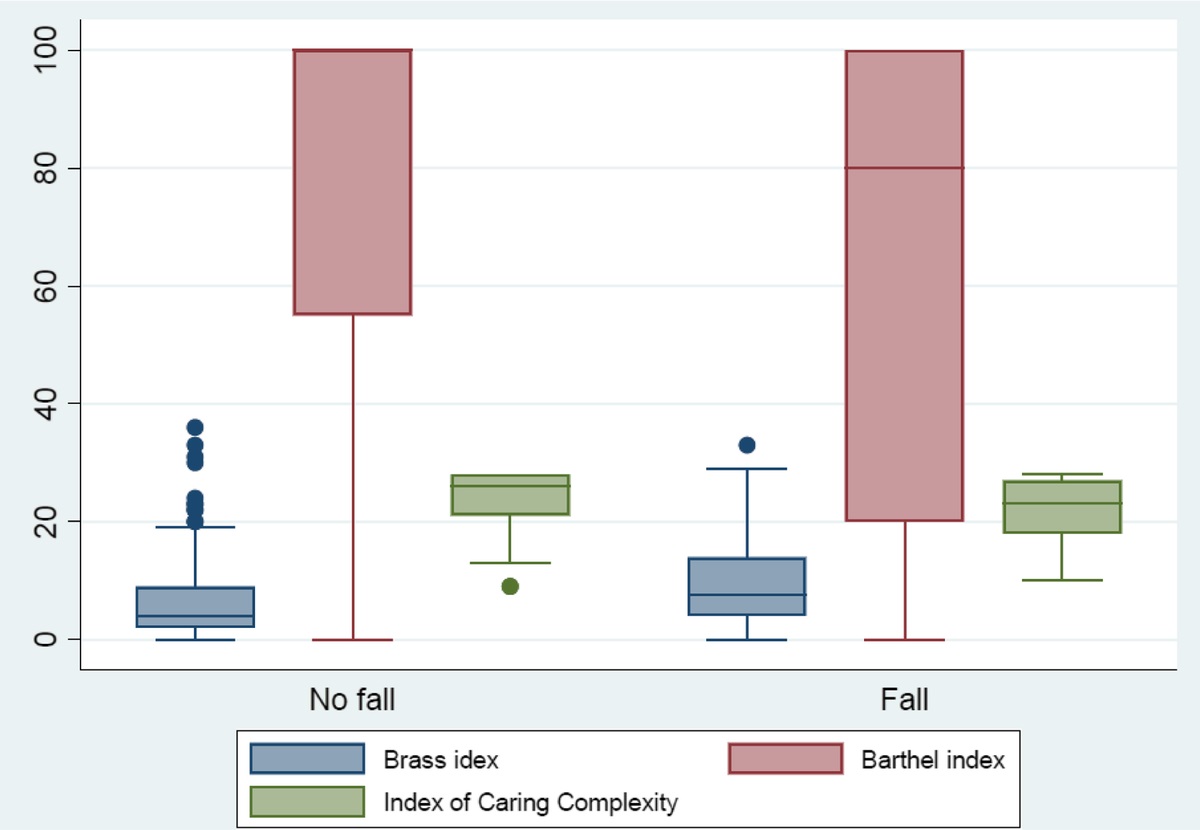
TABLE 1 - General Characteristics Fall No Fall Total Fall No Fall Total n % n % n % Mean SD Mean SD Mean SD Case-control groups 108 50 108 50 216 100 Sex Male 69 63.9 47 43.5 116 53.7 Female 39 36.1 61 56.5 100 46.6 Age 69.0 13.4 66.7 17.4 67.8 15.6 Education Elementary school 7 6.5 9 8.3 16 7.4 Middle school 21 19.4 21 19.4 42 19.4 High school 21 19.4 25 23.1 46 21.3 University 14 13.0 16 14.1 30 13.9 No education 3 2.8 3 2.8 6 2.8 N/A 42 38.9 34 31.5 76 35.2 Hospital admission Planned 54 50 54 50 108 50 Unplanned 54 50 54 50 108 50 Diagnosis at the admission Cancer 42 38.9 42 38.9 84 38.9 No cancer 66 61.1 66 61.1 132 61.1 Discharge Discharge 92 85.2 92 85.2 184 85.2 Transfer to a public hospital 4 3.7 6 5.6 10 4.6 Transfer to private hospital 2 1.85 2 1.85 4 1.85 Death 10 9.3 8 7.4 18 8.3 Hospital stay 31.7 44.8 9.6 10.5 20.7 34.3Statistically significant differences between the mean (SD) scores at the hospital admission and discharge were found when Index of Caring Complexity was evaluated (Fig. 1): at the admission 22.0 (±5.4) in cases of in-hospital falls versus 24.0 (±4.9) in controls (P = 0.004); at discharge 21.5 (±4.8) in cases versus 23.3 (±5.3) in controls (P = 0.014). The BRASS mean (SD) values at the admission and at the discharge were also significantly higher in cases of in-hospital falls: at the admission 10.2 (±7.7) in cases versus 7.0 (±8.0) in controls (P = 0.003); at the discharge 10.0 (±6.4) versus 6.7 (±7.5) (P = 0.001). Finally, Barthel index mean (SD) scores also presented statistically significant differences: at the admission 60.3 (±40.6) in cases versus 76.0 (±34.8) in controls (P = 0.003); at discharge 51.3 (±34.9) versus 73.3 (±35.2) (P = 0.000).
 FIGURE 1:
 Dependence clinical-social fragility index and type fall/no fall groups: differences between the means.
Significant differences between mean (SD) scores in the cases of planned admission versus unplanned admission (Fig. 2): for Index of Caring Complexity at the admission 20.9 (±5.3) versus 25.1 (±4.3) (P = 0.000) and at discharge 20.8 (±5.7) versus 24.0 (±3.8) (P = 0.000); for BRASS at the admission 11.4 (±9.0) versus 5.8 (±5.6) (P = 0.000) and at discharge 10.7 (±8.0) versus 6.0 (±5.2) (P = 0.000); using Barthel index at the admission 53.6 (±39.5) versus 82.7 (±31.4) (P = 0.000) and at discharge 47.5 (±35.8) versus 77.0 (±32.4) (P = 0.000) (Table 2).
 FIGURE 2:
 Dependence clinical-social fragility index and type of hospital admission: differences between the means.
TABLE 2 - Statistically Significant Differences Between the Means of the Groups (Dep-CSF Indexes, and Fall/No Fall, Planned/Unplanned Hospital Admission) Group n Mean SD 95% CI P Barthel No fall (control) 108 76.0 34.8 69.3–82.6 0.003 Fall (case) 108 60.3 40.6 52.6–68.1 BRASS No fall (control) 108 7.0 8.0 5.4–8.5 0.003 Fall (case) 108 10.2 7.7 8.7–11.6 IDA No fall (control) 108 24.0 4.9 23.1–25.0 0.004 Fall (case) 108 22.0 5.4 21.0–23.0 Barthel Planned 108 82.7 31.4 76.7–88.7 0.000 Unplanned 108 53.6 39.5 46.0–61.1 BRASS Planned 108 5.8 5.6 4.7–6.8 0.000 Unplanned 108 11.4 9.0 9.6–13.1 IDA Planned 108 25.1 4.3 24.3–25.9 0.000 Unplanned 108 20.9 5.3 19.9–21.9The mean (SD) values using Conley Index showed statistically significant differences between cases of in-hospital falls 2.4 (±2.6) and controls 1.3 (±1.9) (P = 0.001). If median (interquartile values) values were considered, the differences were still significant: 2 (4) versus 0 (1.5) (P = 0.001) (Table 3). Of 108 cases, 59 were correctly identified as at risk (sensitivity = 54.6%) while 81 of the 108 controls were correctly identified as not at risk (specificity = 75%) (Table 4).
TABLE 3 - Relationship Between Conley Scale and Fall/No Fall Group Obs Mean SE SD 95% CI p50 IQR P No fall (control) 108 1.3 0.18 1.9 0.92–1.7 0.001 Fall (case) 108 2.4 0.24 2.6 1.9–2.9 No fall (control) 108 0 1.5 0.001 Fall (case) 108 2 4IQR, interquartile range; p50, 50th percentile.
PPV/NPV, positive and negative predicted values; Se, sensitivity; Sp, specificity.
Odds ratios were as follows: for Barthel index 2.37 (95% CI, 1.28–4.39, P = 0.003); for Index of Caring Complexity 1.45 (95% CI, 0.72–2.91, P = 0. 255); for BRASS index 1.95 (95% CI, 1.03–3.70, P = 0.026).
Predictive performance was computed based on 108 falls from 214 subjects. With BRASS index, the area under the curve (AUC) was 0.667 (95% CI, 0.595–0.740), thus indicating a moderate predictive power of the scale. With IDA’s index, the AUC was 0.628 (95% CI, 0.555–0.702), thus indicating a moderate predictive power of the scale. Finally, with Barthel index, the AUC was 0.624 (95% CI, 0.554–0.694), thus indicating a moderate predictive power of the scale (Fig. 3).
 FIGURE 3:
 Predictive fall performance with ROC.
The ORs end ROC curve are reported in Table 5.
TABLE 5 - Predictive Performance Dep-CSF Index Obs ROC Area OR 95% CI P Barthel 216 2.37 1.28–4.39 0.003 0.62 0.55–0.69 0.001 BRASS 216 1.95 1.03–3.70 0.026 0.67 0.59–0.74 0.001 IDA 216 1.45 0.72–2.91 0.255 0.63 0.55–0.70 0.001The best cutoff was for BRASS 5 (64.8%), for Index of Caring Complexity 26 (60.20%), and for Barthel index 60 (59.70%) (Table 6).
TABLE 6 - Predictive Performance: Best Cutoff Barthel BRASS IDA CP SE SP CC CP SE SP CC CP SE SP CC 0 100.0% 0.0% 50.00% 0 100.0% 0.0% 50.0% 9 100.0% 0.0% 50.00% 5 85.2% 4.6% 55.10% 3 91.7% 32.4% 62.0% 10 100.0% 1.9% 49.10% 15 80.6% 6.5% 56.50% 5 74.1% 55.6% 64.8% 12 96.3% 1.9% 50.90% 25 74.1% 16.7% 54.60% 7 55.6% 67.6% 61.6% 14 90.7% 4.6% 52.30% 35 66.7% 19.4% 56.90% 9 45.4% 74.1% 59.7% 16 85.2% 7.4% 53.70% 45 59.3% 23.2% 58.80% 11 37.0% 76.9% 56.9% 18 75.9% 11.1% 56.50% 55 56.5% 24.1% 59.70% 15 24.1% 84.3% 54.2% 19 74.1% 19.
留言 (0)