
記住我


Studies conducted during the ICU stay, as well as those extending from the ICU admission through to the post-discharge period, will be eligible for inclusion.
ParticipantsAdults (aged > 18 years) admitted to the ICU were included in the study. Gender, ethnicity, and nationality of participants will not be further restricted.
Type of studyOnly RCTs providing comparisons of preventative strategies and other strategies or standard treatment for adult patients in ICUs with full-text publications will be included.
InterventionAny non-pharmacological interventions to prevent PICS in critically ill patients. The potential interventions may encompass, but are not limited to the following:
ComparatorsThese are different types of non-pharmacological interventions or a control group; a control group is defined as a waiting list, usual/standard care, or a control condition that provided a brief educational leaflet.
Outcome measuresStudies must have assessed depression symptoms, anxiety symptoms, PTSD, cognitive status, sleep quality, pain, physical functioning, or quality of life, with detailed data available. Additionally, the evaluation of primary outcomes must use a comprehensive and specific scale, including but not limited to the following:
Primary outcomes 1.Depression: Hospital Anxiety and Depression Scales [31] and Hamilton Depression Rating Scale [32]
2.Anxiety: Hospital Anxiety and Depression Scales [31]
3.PTSD: The Impact of Event Scale-Revised [33] and the Davidson Trauma Scale [34]
4.Cognitive: The Confusion Assessment Method for the ICU [35] and Montreal Cognitive Assessment [36]
5.Sleep: Richards Campbell Sleep Questionnaire [37] and Pittsburgh Sleep Quality Index [38]
6.Pain: Numeric rating scale [39] and visual analog scale [40]
7.Physical functioning: The occurrence rate of ICU-acquired weakness and the evaluation through Medical Research Council scale scores [41] and activities of daily living [42, 43]
8.Quality of life: Medical Outcomes Study 36-item short-form health survey [44] and European Quality of Life-5 Dimensions questionnaire [45]
Secondary outcomes 1.Any harms associated with the prevention intervention
2.Participant satisfaction
Search strategy“Critical care,” “intensive care units,” “syndrome,” “symptom assessment,” “depression symptom,” “depression,” “anxiety,” “anxiety symptom,” “mental health,” “Posttraumatic Stress Disorder,” “cognitive dysfunction,” “delirium,” “sleep,” “sleep wake disorder,””sleep quality,””pain,””intensive care unit acquired weakness,” and “physical functioning” will be utilized as MeSH phrases or keywords. The following electronic databases will be search from inception to June 25, 2023: PubMed, Embase, CINAHL, Cochrane Central Register of Controlled Trials, Web of Science, PsycINFO, SinoMED, CNKI, and Wangfang. Example searches of PubMed can be found in Table 1. Moreover, we will perform thorough reverse citation searches on all included studies and pertinent reviews to find any previously missed references. Additionally, to find recent articles that have mentioned the pertinent literature, we will do forward reference searching on Google Scholar. Finally, we will try to contact the authors of those studies for more information if the full text of certain sources is unavailable.
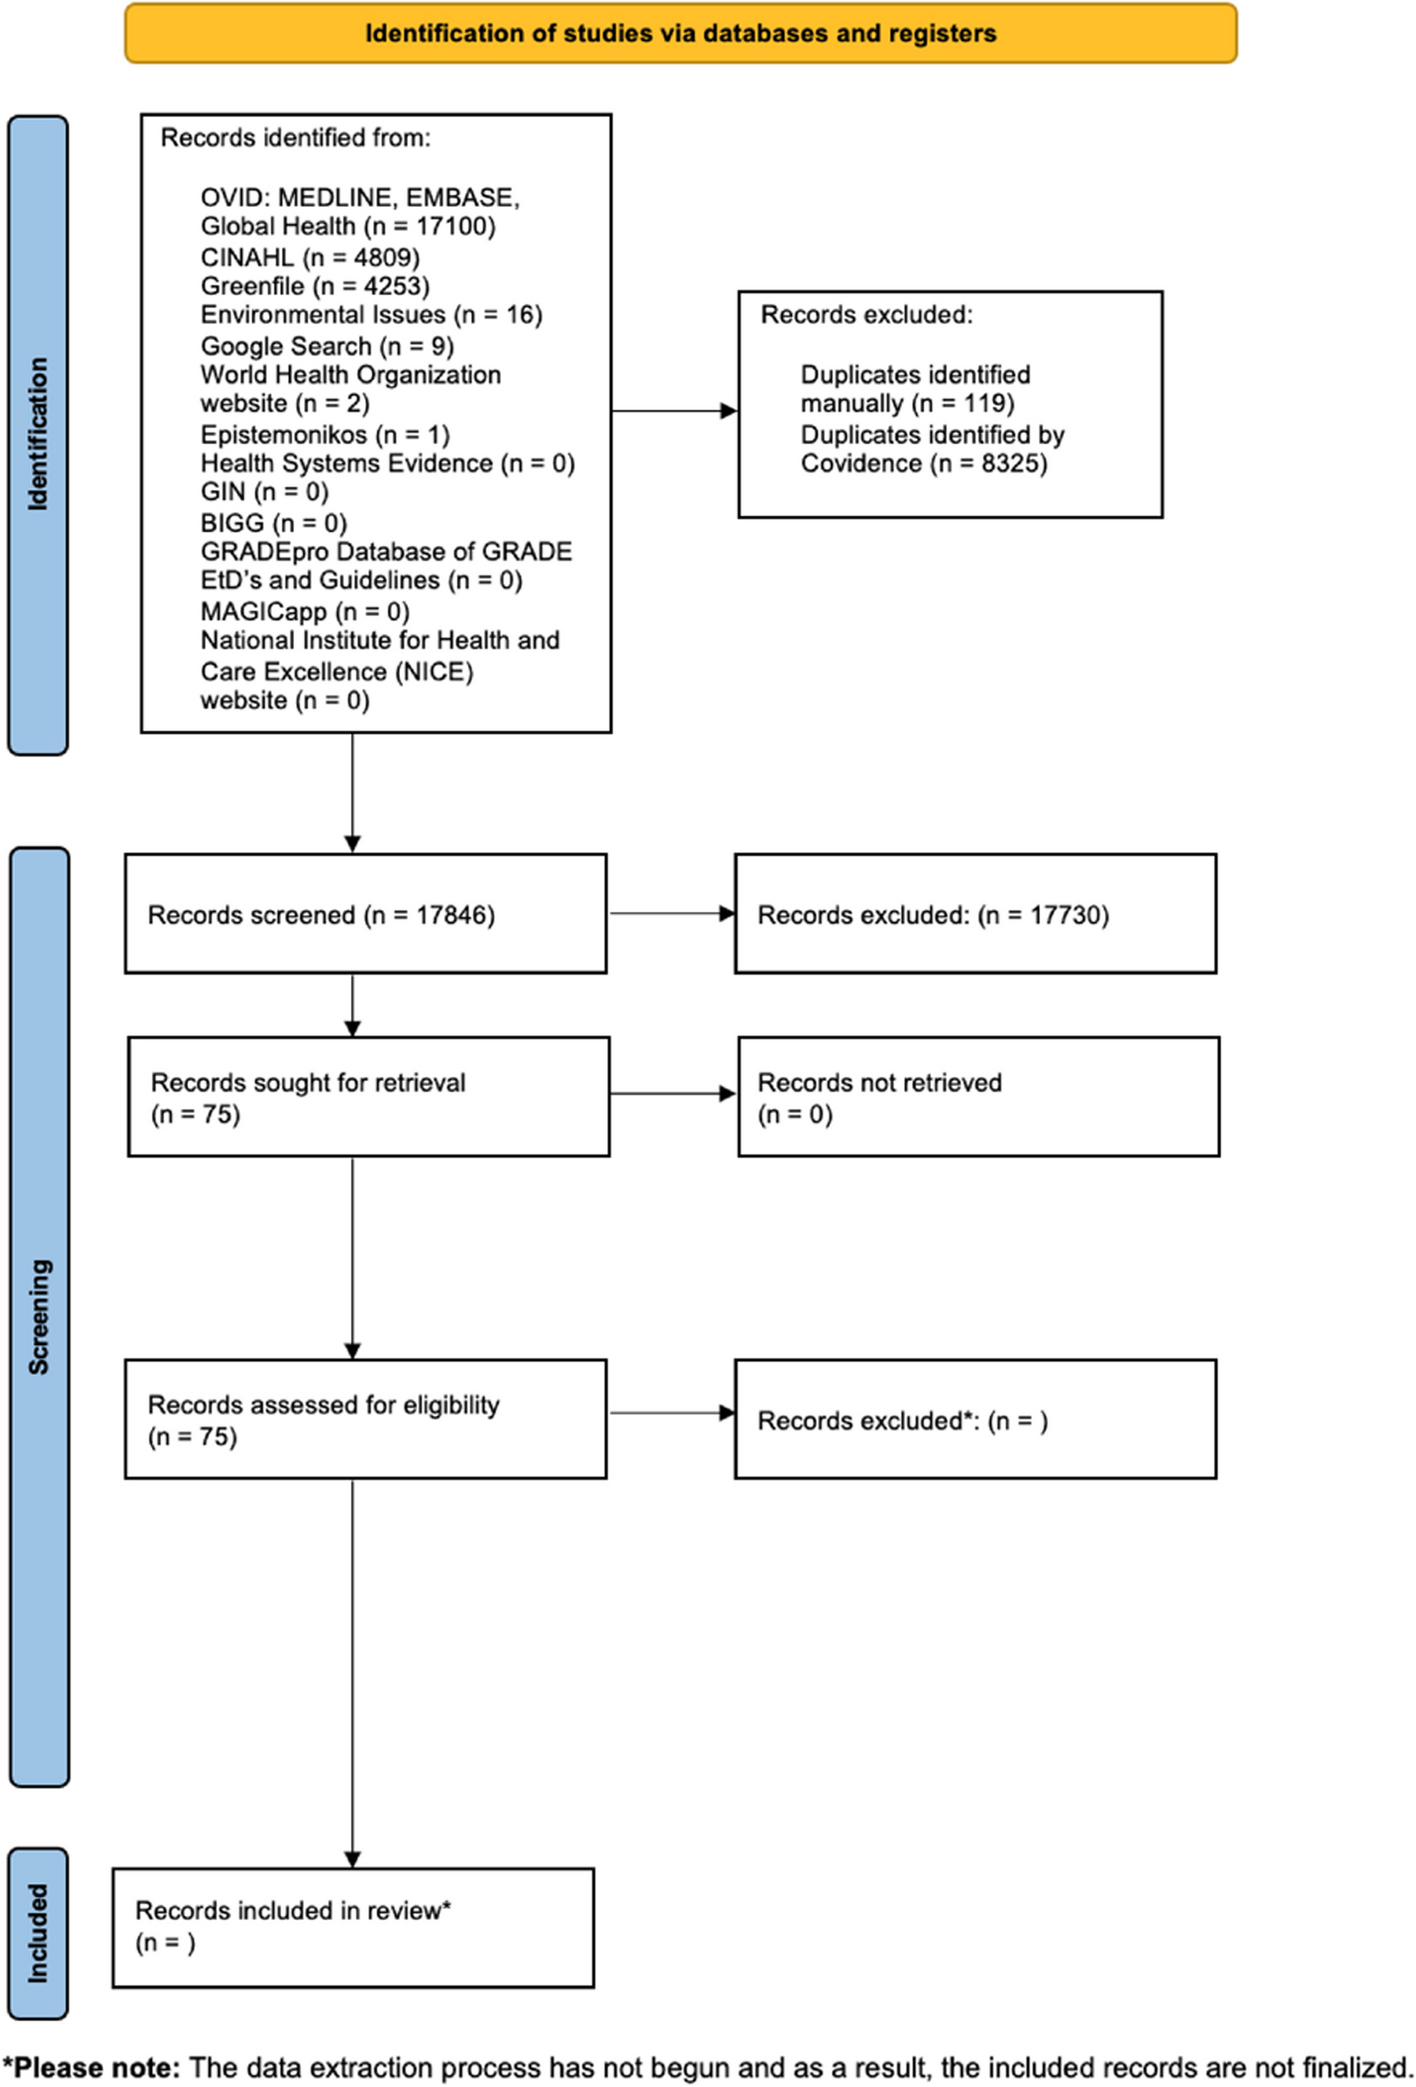
Table 1 Search strategy in PubMedStudy selectionThis study will follow the Preferred Reporting Items for Systematic Reviews and Meta-Analyses criteria, and the Preferred Reporting Items for Systematic Reviews and Meta-Analyses flow diagram [46], shown in Fig. 2, demonstrates the proposed research selection methods. The discovered studies will be imported into the online Rayyan literature management tool (https://rayyan.qcri.org) for additional analysis. Independent screening of the papers’ titles and abstracts will be performed by two reviewers. If either reviewer determines that an article meets the inclusion criteria, full texts will be obtained. Subsequently, both reviewers will independently assess the eligibility of each reference through a thorough examination of the full text. Any differences that cannot be settled via conversation will be brought to the attention of a third reviewer who will act as a mediator. Cohen’s kappa coefficient will be calculated to measure the inter-rater reliability. The reasons for excluding any studies will be carefully documented.
Fig. 2 Data extraction
A standardized data extraction form is available as a supplemental file. Before the actual usage of the form, each member of the team will have the opportunity to test it. Two reviewers will independently perform data extraction. In the case of any inconsistencies, a third arbiter will be consulted to facilitate a discussion and achieve a consensus. Our inclusion criteria for data extraction include various aspects of the study, such as background data (first contributor and the time of publication), research design (setting, methods of sampling, randomization, allocations, and blinding), sample characteristics (inclusion and exclusion criteria, sample size, age, sex, and educational background, rates, or severity of PICS), intervention details (type, content, frequency, duration, provider, and control group), and primary and secondary outcomes (including measurement time points, assessment tools, and any negative effects connected to preventative measures). In cases where information is missing or requires further clarification, we will reach out to the corresponding author for additional details.
Risk of biasTwo individuals will independently determine the risk of bias. If a dispute or discrepancy cannot be settled via conversation, a third reviewer will help achieve an agreement. We will weigh the RCTs’ quality of methodology using the revised Cochrane risk-of-bias methodology for randomized trials [47]. The five domains of this tool are as follows: (1) risk of bias resulting from the randomization process, (2) risk of bias due to departure from the purpose of the intervention, (3) risk of bias due to lacking outcome data, (4) risk of bias in measuring of the outcome, and (5) risk of bias in selection of the presented result.
Data synthesisStudy results will be categorized and summarized based on the intervention type, detailing the methodologies and clinical attributes documented in the corresponding studies. The summary will include an exhaustive analysis of patient demographics, the reported outcomes, and a critical assessment of potential bias risks. In instances where a quantitative synthesis of research findings is infeasible, a narrative synthesis will elucidate the systematic reviews outcomes.
Assessment of transitivityIn NMA, the transitivity assumption is crucial, allowing for indirect comparisons between interventions via a common comparator [48]. Considering the inherent clinical and methodological diversity in systematic reviews, it is essential for researchers to determine whether such variability could significantly impact the transitivity. To identify potential intransitivity, we will scrutinize the distribution of known effect modifiers across all direct comparisons before conducting the NMA [49], including variables like age, gender, disease severity, and the duration of interventions. A comparable distribution of these factors suggests that the transitivity assumption holds. Conversely, if transitivity is compromised, the NMA results may be biased, warranting a more conservative interpretation.
Network meta-analysisShould the assumption of transitivity be deemed met, a random-effects NMA [50] will be executed employing vague priors within a Bayesian framework.
Detection of heterogeneityConsidering the anticipated variability in participant demographics, intervention methodologies, and outcome measurements, statistical heterogeneity is expected. In anticipation of inherent variability across the included studies, we will implement a random-effects model to mitigate the observed statistical heterogeneity. The deviance information criterion (DIC) will serve as our comparative metric for model selection, integrating considerations of model fit with complexity.
To explore the sources of heterogeneity, we will conduct network meta-regression, subgroup analyses, and sensitivity analyses [51]. Network meta-regression will be carried out to examine the impact of potential effect modifiers (e.g., average age of participants, baseline symptom scores) on the primary outcomes. The duration of interventions may be a significant factor affecting efficacy, and subgroup analyses will be performed to assess the influence of different intervention durations on the primary outcomes. Additionally, if a sufficient number of studies are available, we will conduct sensitivity analyses by excluding trials assessed to be at high risk of bias to ensure the robustness of the primary study results.
Assessment of inconsistencyWhen closed loops are present within the NMA framework, the node-splitting approach is employed to evaluate the consistency between direct and indirect evidence. p > 0.05 in the node-splitting analysis is indicative of agreement between the two sources [52].
Assessment of publication biasIn instances where a treatment comparison encompasses over 10 studies, we will utilize a comparison-adjusted funnel plot to evaluate potential small-study effects and the likelihood of publication bias [53]. The symmetry of these plots will be systematically assessed via Egger’s test.
The overall strength of the evidence will be assessed while accounting for research limitations, imprecision, heterogeneity, indirectness, and publication bias using the Confidence in Network Meta-Analysis (CINeMA) method. The Grading of Recommendations Assessment, Development and Evaluation (GRADE) framework is the foundation of CINeMA [54] and contains the following six dimensions: within-study bias, reporting bias, indirectness, imprecision, heterogeneity, and incoherence. The adoption of CINeMA boosts transparency and prevents the selective use of evidence in making judgments, thereby reducing the level of subjectivity.
Statistical analysesAll studies will be performed using the R-evolution software [55] version 4.3.0 and the gemtc package [56] version 1.0–1, which connects with JAGS version [57] 4.3.2 to perform a Markov chain Monte Carlo simulation (MCMC) [58]. We will configure 4 Markov chains, with executing a minimum of 20,000 iterations. The concordance between direct and indirect evidence will be ascertained through the node-splitting technique. Model convergence will be gauged using convergence diagnostic and trace density plots, with the potential scale reduction factor (PSRF) providing a metric for convergence adequacy—a PSRF close to 1 suggests satisfactory convergence. For continuous outcomes, the mean difference (MD) is utilized as the measure of effect, whereas for binary outcomes, the risk ratio (RR) is used, including its 95% confidence interval (CI). The area under the cumulative ranking curve (SUCRA), as determined from the ranking probability matrix generated by R software, will be calculated and the corresponding SUCRA curve plotted; a greater SUCRA value indicates an increased likelihood of a superior outcome ranking.
A network diagram will be created to visualize relationships between interventions [59]. Data processing will be executed utilizing network group commands. Subsequent to this, network evidence graphs will be generated [58]. In these visual representations, the magnitude of the nodes will be proportional to the sample sizes derived from the comparative analysis of interventions. The thickness of the edges will represent the volume of RCTs interlinking the interventions.
留言 (0)