
記住我
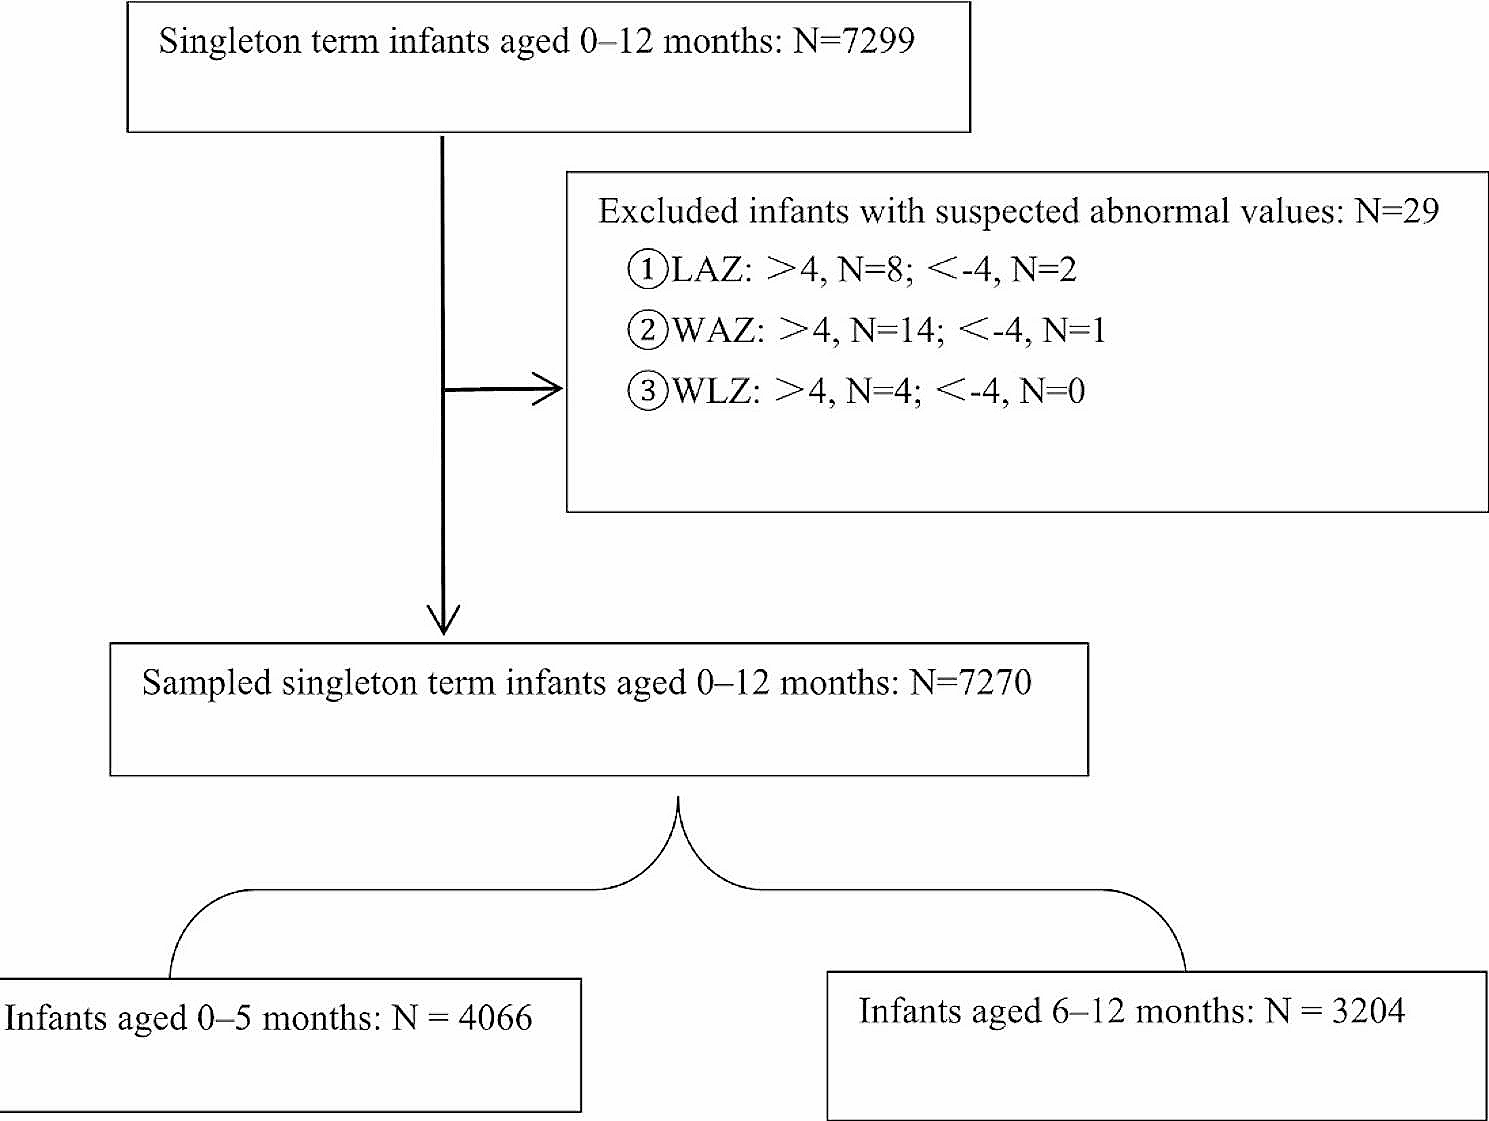
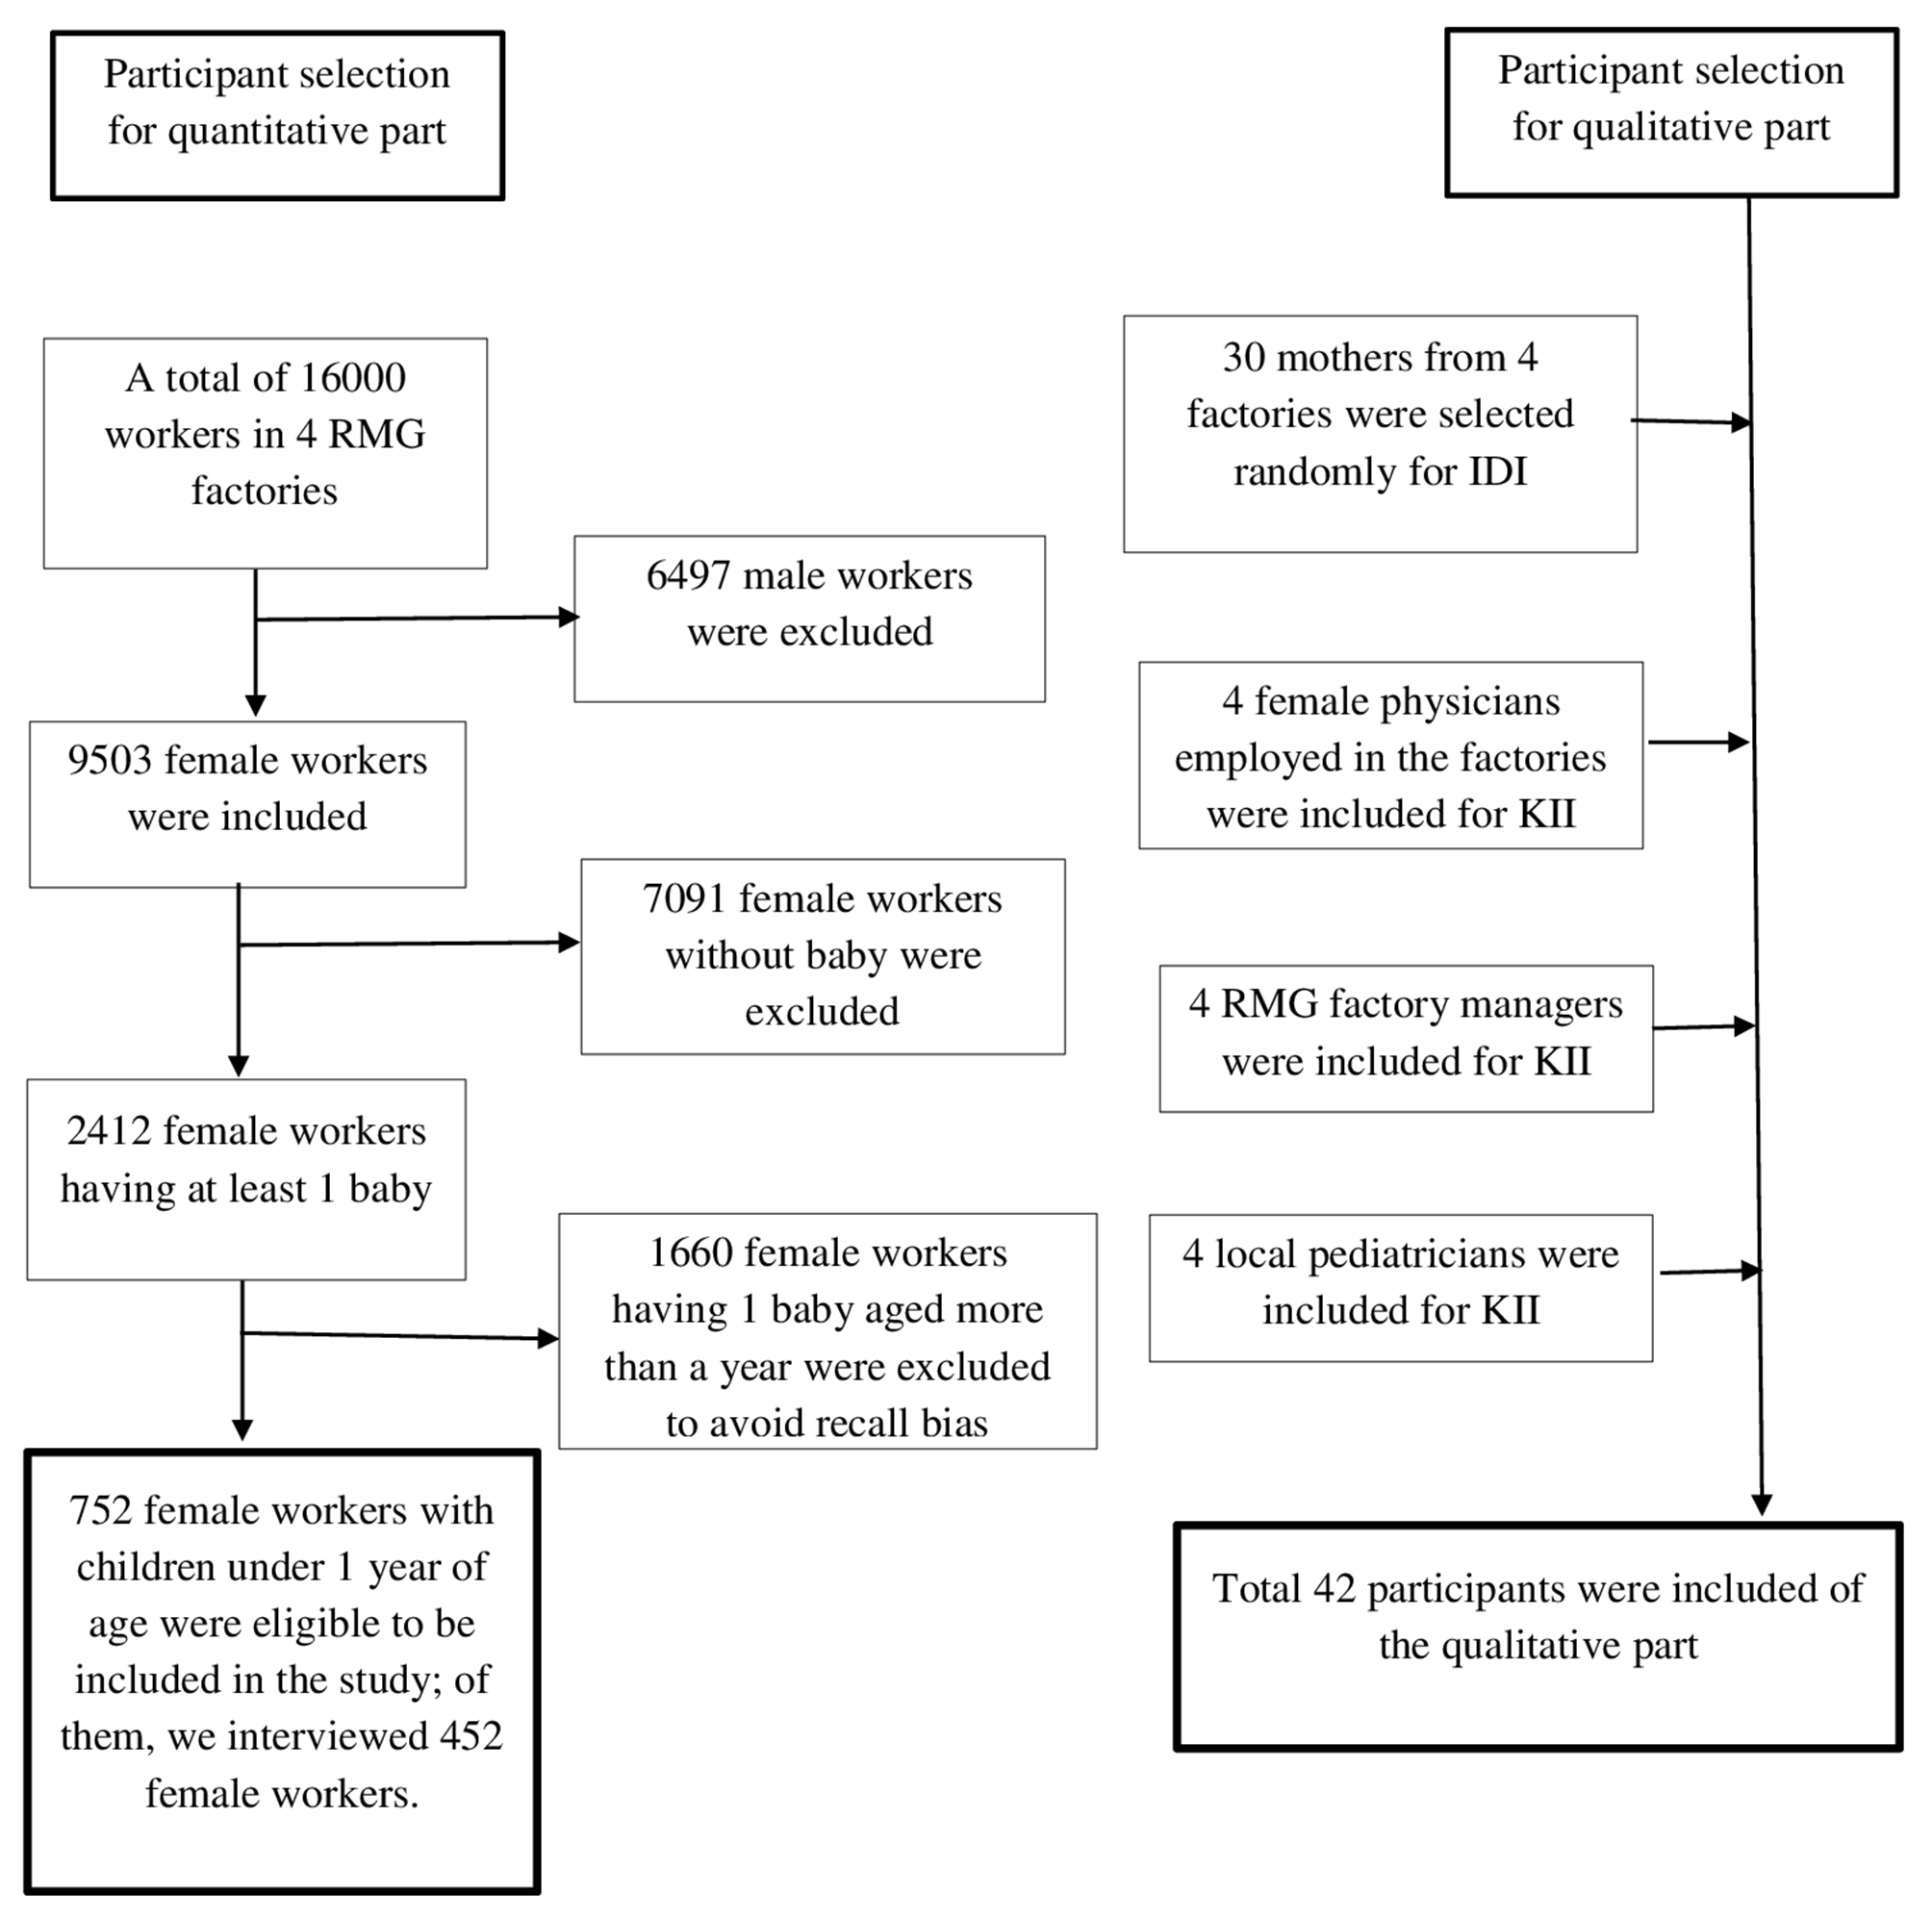

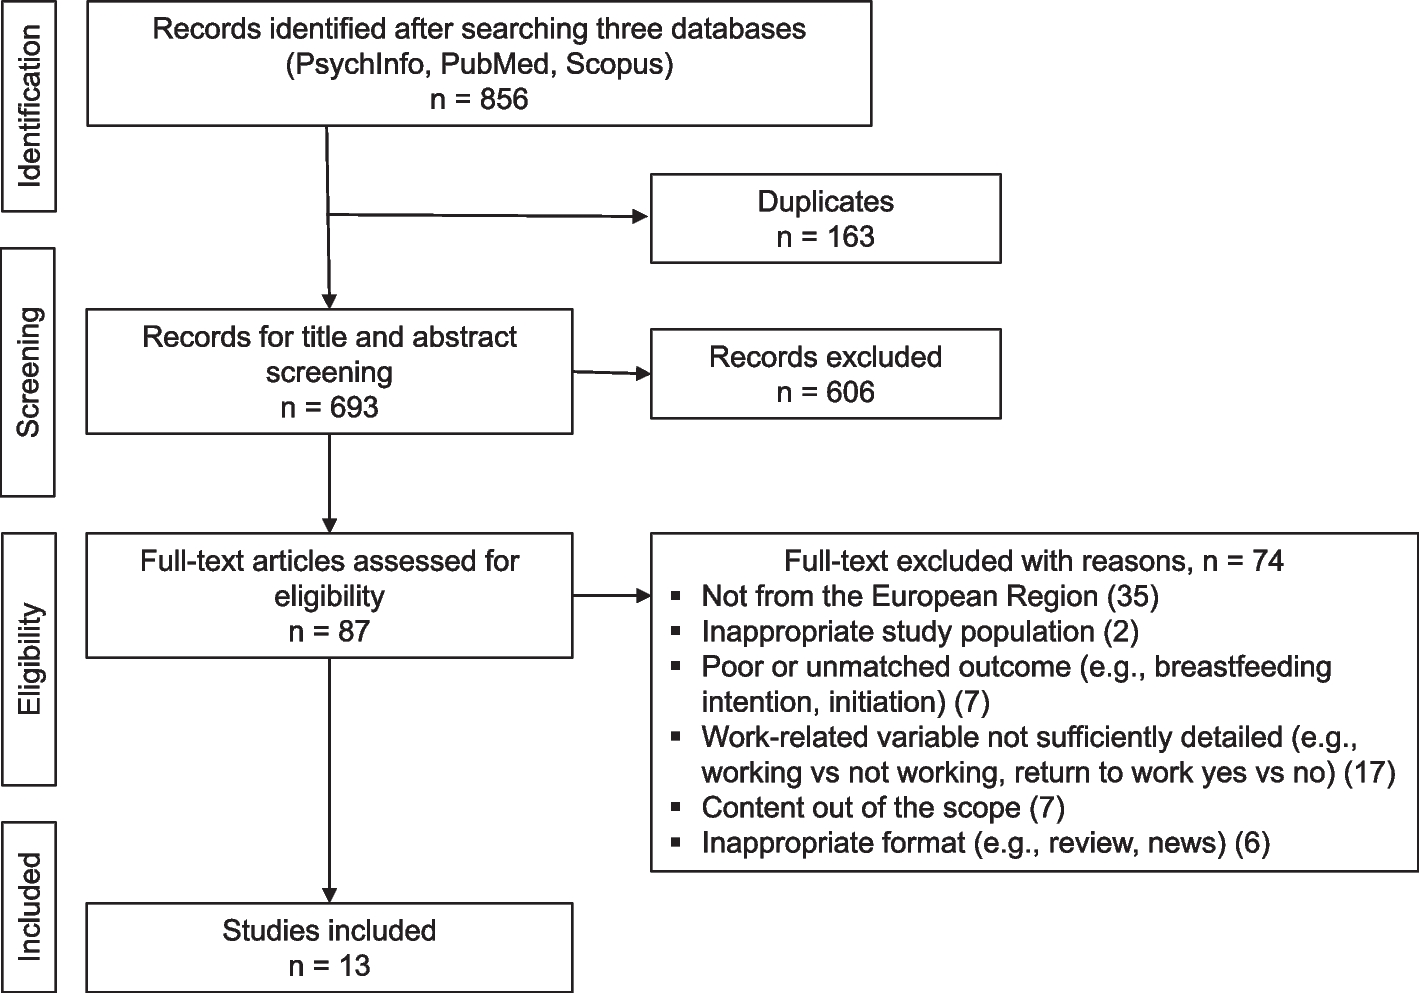
This retrospective cross-sectional study used data from the Korean National Health and Nutrition Examination Surveys (KNHANES) database. The KNHANES, a nationwide and population-based health survey, was performed by the Korean Ministry of Health and Welfare. The KNHANES included a health examination, health interview, and nutrition survey. The KNHANES measured anthropometric measures and biochemical profiles from the participants’ blood and urine samples. The information on socioeconomic status and health behaviors were also collected through the interview and surveys and the interviews and surveys were conducted by well-trained researchers. The KNHANES has been described in previous studies [20]. The current study used data from the fifth (2010–2012), sixth (2013–2015), seventh (2016–2018), or eighth (2019–2020) KNHANES. Among the KNHANES participants, postmenopausal women with a history of delivery were selected as the study population. Women with incomplete data on gravidity, breastfeeding, or biochemical profiles were excluded, and 15,946 postmenopausal/parous women were included in the final analysis (Fig. 1).
Fig. 1
Flow diagram of the study population
VariablesThis study considered various covariates, including sociodemographic characteristics, lifestyle characteristics, medical and obstetric history (including breasting duration), and biochemical profiles (Table 1). Data regarding sociodemographic characteristics, health-related variables, and medical and obstetric histories (including breasting duration) were obtained from the questionnaires. The presence of the following diseases was defined as an answer of “yes” to questions regarding whether the participants had ever been diagnosed by a physician: (1) hypertension, (2) DM, (3) myocardial infarction, (4) angina, (5) stroke, (6) hypercholesterolemia, (7) dyslipidemia, (8) osteoarthritis, (9) rheumatoid arthritis, (10) pulmonary tuberculosis, (11) asthma, (12) thyroid-related disease, (13) major depressive disorder, (14) kidney failure, (15) hepatitis B, (16) hepatitis C, (17) liver cirrhosis, (18) gastric cancer, (19) hepatic cancer, (20) colorectal cancer, (21) breast cancer, (22) cervical cancer, and (23) lung cancer. The total breastfeeding duration was defined based on a questionnaire in which female participants responded as the total duration of breastfeeding during their lifetime. The “average breastfeeding duration” was calculated using the following formula: average breastfeeding duration = (total breastfeeding duration) / (number of breastfed children).
Table 1 Baseline characteristics of the study populationBiochemical profiles, including HbA1c, fasting glucose, high-density lipoprotein (HDL), total cholesterol, and triglyceride (TG), were measured at the time of the survey. The measured low-density lipoprotein (LDL)-C was used for this study for subjects whose LDL-C was measured directly, and when it was not measured and serum TG levels were < 400 mg/dL, LDL-C was calculated using the Friedewald formula.
The characteristics of women with DM were compared to those of women without. To evaluate the association between breastfeeding and DM, the study population was divided into three groups by average breastfeeding duration: no breastfeeding group, < 12 months breastfeeding group, and ≥ 12 months breastfeeding group. The risk of DM was compared among the three groups.
Statistical analysesThe variables were presented as mean values (standard deviation) or numbers (percentages). The chi-square test or Fisher’s exact test was used to compare categorical variables, and the t-test was used to compare continuous variables. Multivariable logistic regression analysis was performed to evaluate the risk of DM according to breastfeeding duration. The results from logistic regression are presented as odds ratios (OR), adjusted odds ratio (aOR), and 95% confidence intervals (95% CI). The < 12 months breastfeeding group was used as the reference group. For multivariate logistic regression analysis, covariates included sociodemographic characteristics (age at enrollment, body mass index (BMI), household income, areas of residence, occupation, and education level), obstetric characteristics (gravidity, age at first delivery, age at last delivery, age at menarche, and age at menopause), medical diseases (hypertension, myocardial infarction, angina, stroke, hypercholesterolemia, hyperlipidemia, osteoarthritis, rheumatoid arthritis, pulmonary tuberculosis, asthma, thyroid-related disease, major depressive disorder, kidney failure, hepatitis B, hepatitis C, liver cirrhosis, gastric cancer, hepatic cancer, colorectal cancer, breast cancer, cervical cancer, and lung cancer), family history, and socioeconomic and lifestyle characteristics (history of smoking, alcohol consumption, weekly weight training routines, stress awareness, and feeling depression within a year).
To evaluate the association between the average breastfeeding duration and DM, a machine-learning method was used. An artificial neural network, decision tree, logistic regression, naïve Bayes, random forest, and support vector machine were used to predict DM. Data on 15,939 observations with full information were divided into training and validation sets in a 70:30 ratio (11,157:4,782). The area under the receiver-operating-characteristic curve and accuracy (the ratio of correct predictions among the 4,782 observations in the validation set) were employed as the standards for model validation. The random-forest variable importance, the contribution of a certain variable to random-forest performance (accuracy), was used to examine the major predictors of DM. The importance of the random-forest variable was used to investigate the main factors of HbA1c. Variable importance provides the explanatory ability of the contribution of a specific variable to the outcome variable. Therefore, variable importance indicated important variables that had a strong association with the outcome, which was DM in the current study [21]. Then, random-forest Shapley Additive Explanations (SHAP) values were derived to examine the direction of association between DM and its major predictor. The SHAP value of a particular predictor for a particular observation measures the difference between what the model (random forest) predicts the probability of DM for the observation with and without the predictor (https://github.com/shap/shap). The inclusion of a predictor (average breastfeeding duration) into machine learning (random forest) will decrease or increase the probability of the dependent variable (DM). The SHAP values are skewed for the max value hence it can be concluded that there is a positive association between the average breastfeeding duration and DM.
The SHAP approach has a specific advantage compared to linear or logistic regression: the former incorporates all realistic scenarios unlike the latter. Let us make a simplistic assumption that there are three predictors of DM, i.e., BMI at enrollment, age at enrollment and the average breastfeeding duration. As explained above, the SHAP value of the average breastfeeding duration for DM for a particular participant is the gap between what machine learning predicts for the probability of DM with and without the average breastfeeding duration for the participant. Precisely speaking, the SHAP value for the participant is the average of the following four possible situations for the participant: (1) BMI at enrollment excluded, age at enrollment excluded; (2) BMI at enrollment included, age at enrollment excluded; (3) BMI at enrollment excluded, age at enrollment included; and (4) BMI at enrollment included, age at enrollment included [22]. That is, the SHAP value incorporates the outcomes of all possible sub-group analyses, which are missing in linear or logistic regression with an unrealistic presumption of ceteris paribus, i.e., “all the other variables staying constant”. Random split and analysis were repeated 50 times and averaged for external validation. R-Studio 1.3.959 (R-Studio Inc., Boston, United States) and Python 3.52 (CreateSpace: Scotts Valley, United States) were employed for the analysis between September 1, 2022-Ocober 30, 2022.
EthicsThis study was approved by the Institutional Review Board (IRB) of the Korea University Anam Hospital (K2023-1954-001). The IRB waived the requirement for informed consent due to the anonymization of participant information. This study followed the Strengthening the Reporting of Observational Studies in Epidemiology (STROBE) guidelines [23].
留言 (0)