
記住我


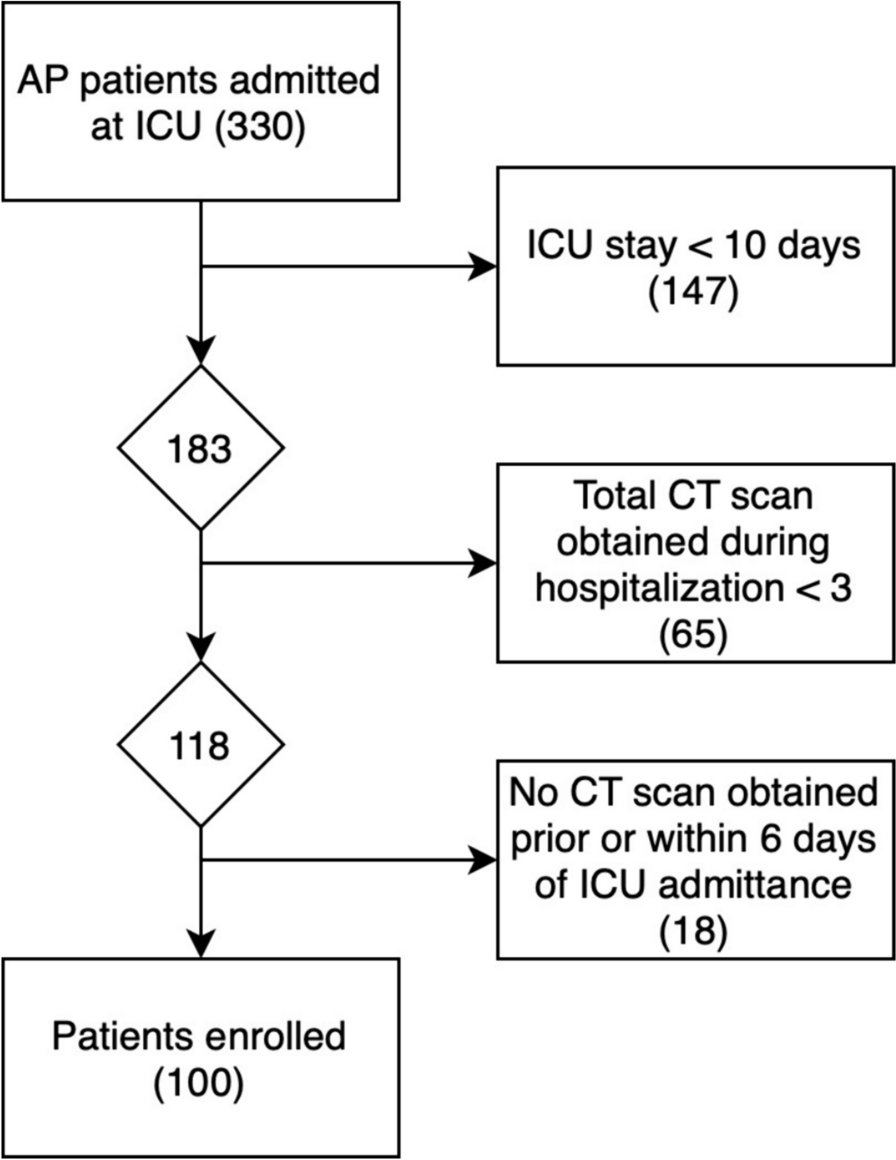
We utilized data from the China Health and Retirement Longitudinal Study (CHARLS), publicly accessible at http://charls.pku.edu.cn. CHARLS is an ongoing longitudinal survey encompassing families and individuals aged 45 and older across 150 counties and 450 communities (villages) within 28 provinces, autonomous regions, and municipalities nationwide. Its comprehensive content spans demographic, economic, health, pension, and other pertinent information. Approval for this project was granted by the Biomedical Ethics Committee of Peking University (Beijing, China) (IRB00001052-11015), with our study adhering strictly to the principles outlined in the Declaration of Helsinki, and obtaining informed consent from all participants. Our analysis specifically focused on CHARLS2015 data, wherein after excluding subjects with missing data, a total of 3454 participants were ultimately included in our study cohort. Notably, our research targeted individuals aged 60 and above. The flowchart of the study is outlined in Fig. 1.
Fig. 1 Data extractionAssessment of symptoms of sarcopenia
Sarcopenia was evaluated according to the criteria recommended by the AWGS2019 [7], which encompass muscle strength, physical performance and appendicular skeletal muscle mass (ASM). Handgrip strength (unit: kg) was assessed in both the dominant and non-dominant hand using the YuejianTM WL-1000 dynamometer. Participants were instructed to squeeze the handle as firmly as possible for 3 s. Measurements were taken twice for each hand, with a minimum interval of 15 s between trials. The recorded value represents the average of the maximum grip strength from both hands. The thresholds for low grip strength established by AWGS are < 28 kg for men and < 18 kg for women [21]. Physical performance decline, as per AWGS criteria, is defined as 5 times sitting time > 12 s or 6-m walking speed < 1 m/s [22]. ASM measurements were derived using validated anthropometric equations specifically developed for the Chinese population [23, 24]. The study demonstrated strong concordance between the ASM equation and Dual-Energy X-ray Absorptiometry (DXA) [23, 24]. In our study cohort, the cutoff for low muscle mass was determined based on sex-specific criteria, equating to a minimum of 20% of height-adjusted muscle mass (ASM/Ht2) [23,24,25,26]. Height and weight were recorded in centimeters and kilograms, respectively. Regarding sex, a value of 1 represents male and a value of 2 represents female. Consequently, individuals with ASM/Ht2 < 5.69 kg/m2 for females and ASM/Ht2 < 6.88 kg/m2 for males were classified as having low muscle mass. The ASM equation utilized is:
$$ASM\, = \,0.193*weight\left( \right)\, + \,0.107*height\left( \right) - 4.157*sex - 0.037*age\left( \right) - 2.631$$
Sarcopenia manifests through a blend of diminished muscle strength, impaired physical performance, or decreased appendicular skeletal muscle mass. Diagnosis typically hinges on identifying low muscle strength, either alone or accompanied by reduced appendicular skeletal muscle mass. Individuals displaying low muscle strength, compromised physical performance, and diminished appendicular skeletal muscle mass were classified as having severe sarcopenia. For the purposes of this study, participants were segregated into two main groups: those with sarcopenia and those without.
Assessment of depressive symptomsDepressive symptoms were assessed with a 10-item stream using the Center for Epidemiologic Studies Depression Scale (CES-D) to assess depressive mood and behavior. CESD pay attention to the individual's situation in the past week and rate it as “Rarely or none of the time (< 1 day)”, “Some or a little of the time (1-2 days)”, “Occasionally or a moderate amount of the time (3-4 days)”, and “Most or all of the time (5-7 days)” according to the frequency of symptoms, and assign 0, 1, 2, and 3 points, respectively, with higher scores representing individuals with more severe depressive symptoms. In this study, according to the research results of ROBERTS and his colleagues [27], CESD ≥ 16 is considered to have depressive symptoms, and < 16 is considered to have no depressive symptoms.
Assessment of cognitive functionCHARLS measures cognitive function in three parts: Telephone Interview for Cognitive Status (TICS), Word Recall, and Picture Drawing. The higher the score, the better the cognitive function. The TICS requires the subject to correctly name the year, month, day, day of the week, and season, and each correct answer is worth 1 point; the subject is required to correctly calculate 100-7, and each correct answer is worth 1 point, and the scores of the two parts are added together, the total score is 0–10 points, which mainly evaluates the subject’s orientation, calculation ability and attention. Word recall: the researchers read 10 words and asked the subjects to recall the 10 words in a short time and after answering several other questions, each correct recall of a word was recorded as 1 point, and the average score of the two words recalled was taken. A total score of 0–10 points was used to assess episodic memory ability. Picture drawing: the researcher provides a picture of two overlapping five-pointed stars and asks the subjects to draw the figure on a white piece of paper. If they can draw a similar figure, they get 1 point, and if they cannot, they get 0 points. It is used to evaluate the subject's visuospatial ability.
Assessment of activities of daily livingActivities of daily living include physical self-maintenance scale (PSMS) and instrumental activities of daily living (IADL). PSMS evaluates essential tasks like dressing, bathing, eating, getting out of bed, going to the toilet, controlling bowel and urine. Meanwhile, IADL assesses more complex activities such as shopping, cooking, doing housework, taking medicine, managing money and making phone calls. According to the degree, it is divided into “No, I don’t have any difficulty”, “I have difficulty but can still do it”, “Yes, I have difficulty and need help” and “I cannot do it”. These options correspond to scores of 1, 2, 3, and 4, respectively, indicating higher scores reflect greater impairment in the skill.
Socio-demographic informationSocio-demographics include sex, age, marital status, education level, address and residence. Sex is defined as male and female. Education level was divided into no schooling, primary school, junior high school and above. Marital status was defined as married if the subject was currently married and living with a spouse; unmarried if the subject was currently separated, divorced, widowed, or never married. Address is divided into “Family house”, “Nursing home” and “Other”. Residence is divided into “The center of city/town”, “Combination zone between urban and rural areas”, “Village” and “Special area”.
Health-related informationWithin the health-related data examined as potential risk factors, a broad spectrum of conditions and indicators were included. These encompassed physical disabilities, neurological impairments such as brain damage, sensory deficits like blindness, deafness and muteness, as well as prevalent medical conditions including hypertension, dyslipidemia, diabetes, cancer and various chronic diseases affecting organs such as the lungs, liver, heart and kidneys. Mental health aspects such as emotional disturbances, memory-related ailments, and joint diseases or rheumatism were also considered. Other factors such as asthma, pain (specifically chronic pain), history of surgeries like cataract or hip fracture, usage of assistive devices like hearing aids, dental health indicators like tooth loss and lifestyle habits like smoking status, alcohol consumption, and social activity levels were evaluated. Additionally, variables related to accidents, falls, vision and hearing impairments and subjective health assessments were included. Specifically, aspects like distant vision, near vision, hearing ability and self-assessment of health status were categorized as “good”, “fair” or “poor”, while the remaining variables were dichotomized as “yes” or “no”. These variables can be directly obtained from the CHARLS questionnaire.
Statistical methodsIn this study, data from the CHARLS database in 2015 were selected for analysis. Continuous variables were expressed as medians and interquartile ranges, and rank sum tests were used to compare between groups; categorical variables were expressed as percentages, and χ2 tests or Fisher's exact tests were used to compare between groups. First, the data set is randomly divided into training set (n = 2417) and verification set (n = 1037) according to the ratio of 7:3. During this process, we set a random seed to ensure the randomization and repeatability of the sampling [28].
Utilizing a nomogram to depict the risk of sarcopenia among the older adults in China, we employed Least Absolute Selection and Shrinkage Operator (LASSO) regression analysis to construct and validate the model. We chose LASSO regression due to its capability to manage high-dimensional datasets with multicollinearity, effectively selecting variables and improving model interpretability. In contrast to Rigid and Elastic Net models, LASSO provides greater flexibility in variable selection and sparsity, making it the preferred choice for our specific research objectives and dataset characteristics. This choice ultimately leads to a more accurate and concise model. The primary R packages utilized in this study include: “mice”, “tableone”, “glmnet”, “rms”, “pROC” and “rmda”. First, LASSO regression analysis was performed on the training set data to select predictors of sarcopenia in Chinese older adults [29, 30]. Then, the tuning parameter (λ) suitable for LASSO regression analysis was determined by tenfold cross-validation, and the most significant features were screened using the LASSO algorithm. Finally, the selected predictors were included in the multivariate logistic regression analysis and the predictors with P-value < 0.05 were included in the nomogram model. The maximum missing value of all extracted variables does not exceed 20%, and multiple imputation is used to handle missing data [31].
In this study, the area under the receiver operating characteristic curve (AUROC) was used to determine the discriminative ability of the model. Calibration curves are used to determine the degree of agreement between predicted probabilities and observed results. Clinical validity was assessed by decision curve analysis (DCA). All data in this study were analyzed using R software (version 4.1.0). All tests were two-tailed and P < 0.05 was considered statistically significant.
留言 (0)