
記住我


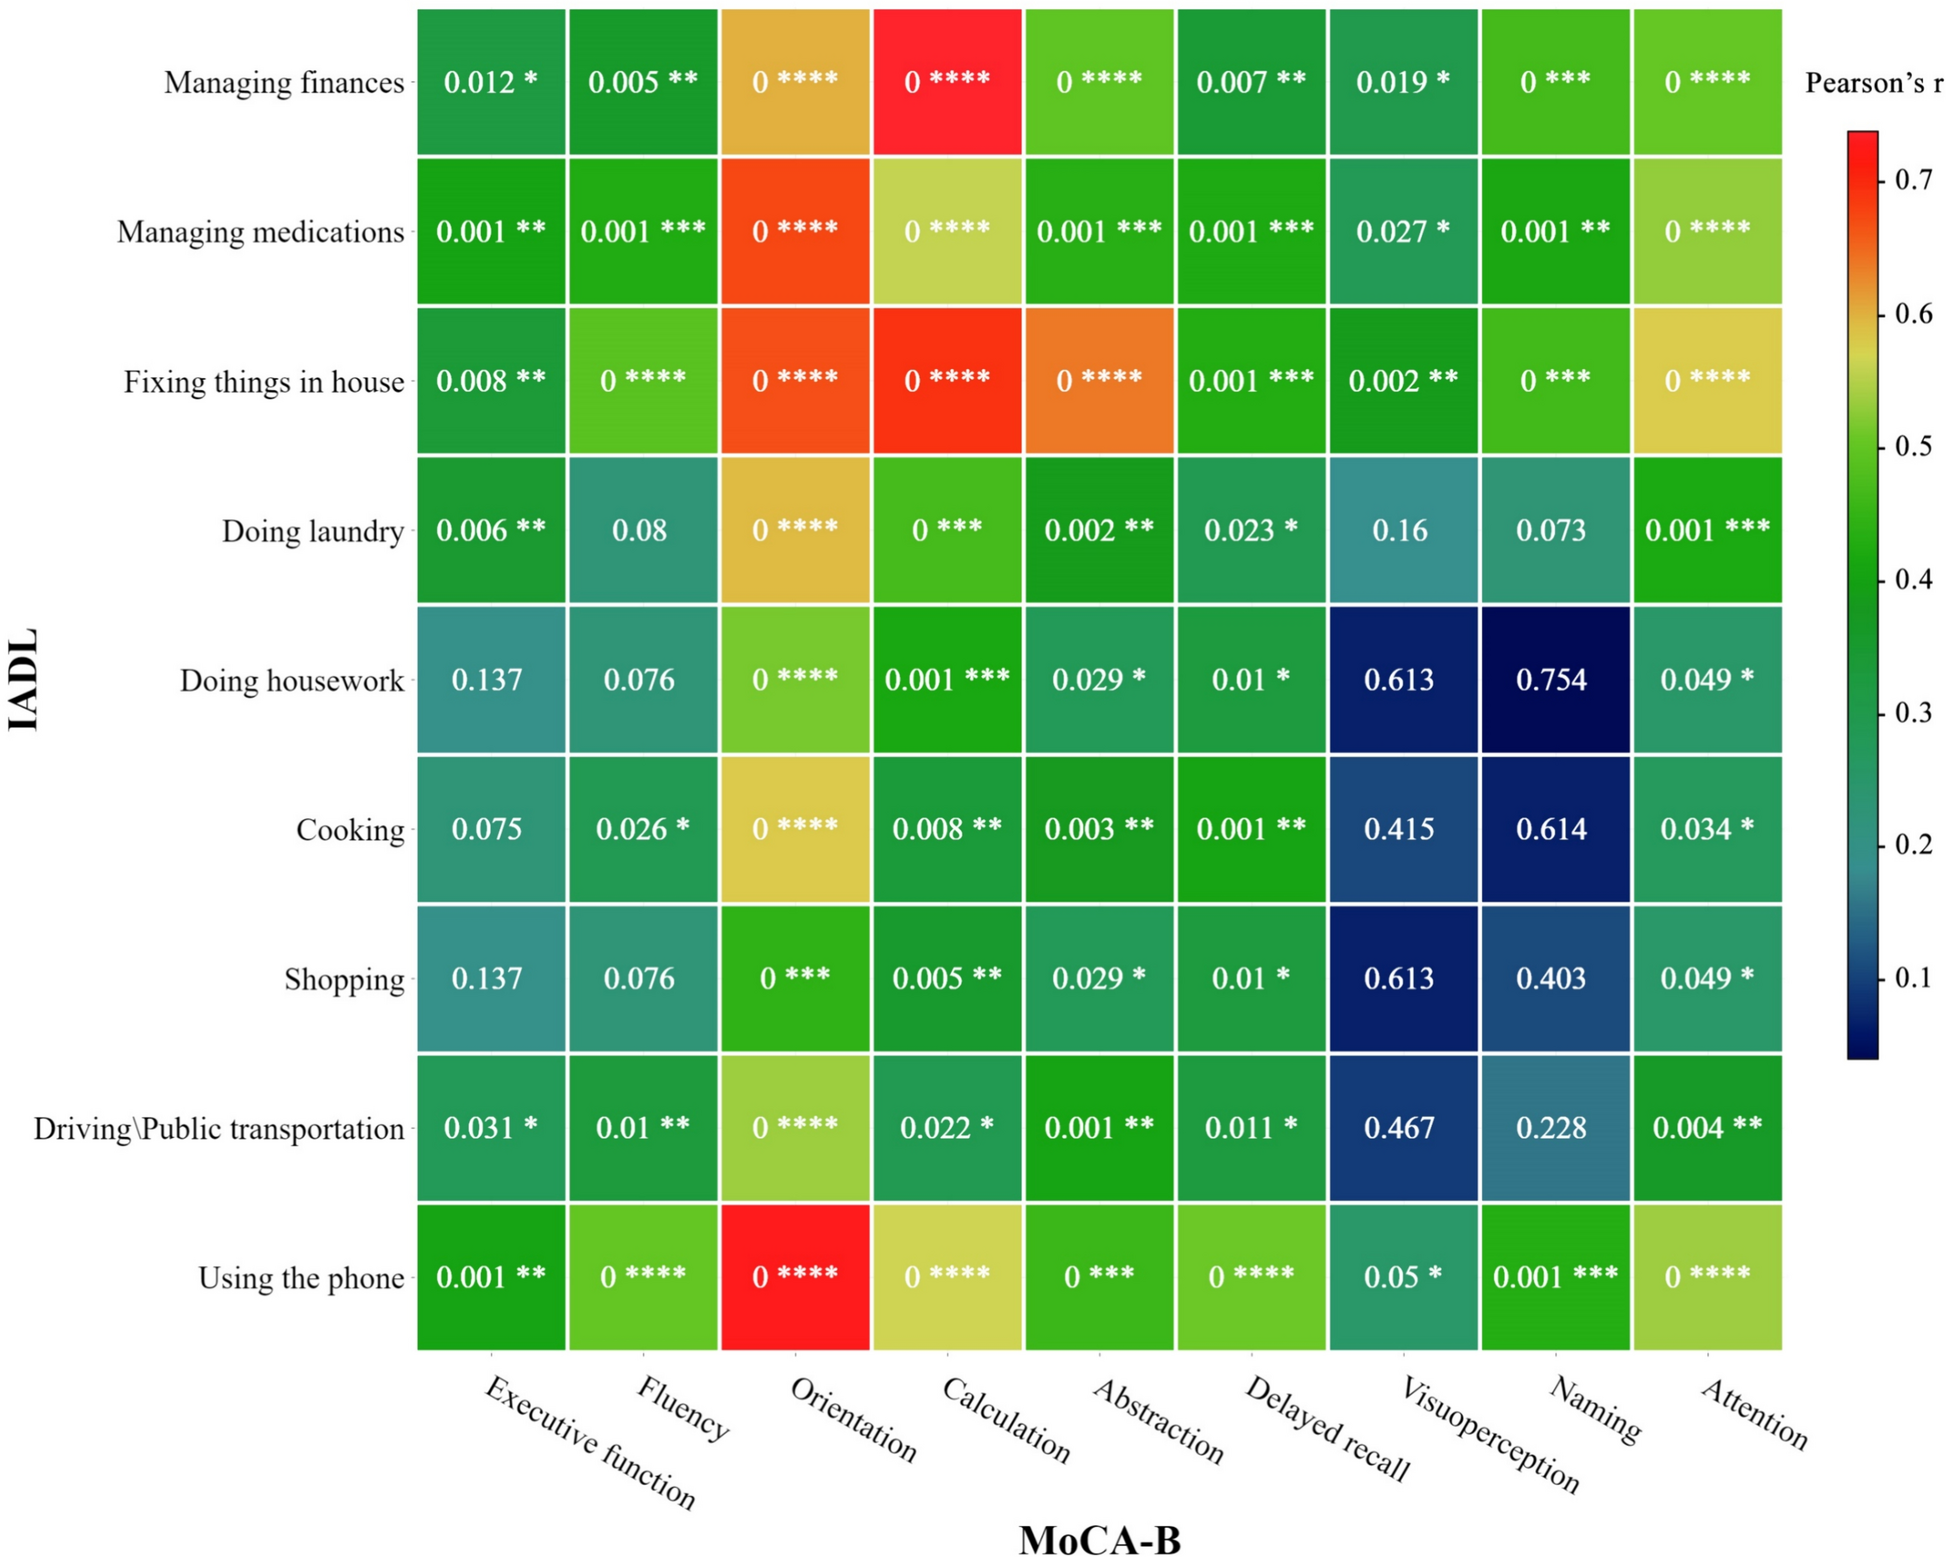


Out of the 330 patients admitted to the ICU for AP, a total of 230 patients were excluded from the study. A total of 100 critically ill patients (75 men and 25 women), that underwent.a total of 749 CT scans, met the defined criteria and were retrospectively enrolled (Fig. 1).Mean age of the study population was 60.19 ranging from 19 to 94 years at the timepoint of hospital admission. Mean BMI was 26.27 kg/m2, ranging from 16.67 to 52.59 kg/m2. Forty-two patients (42%) had sarcopenia at admittance, fifty-five (55%) were obese, defined as BMI > 25 kg/m2, and nineteen (19%) were obese, defined as BMI > 30 kg/m2 (Table 1).The majority of patients (86%) presented with chronic pre-existing conditions prior to the acute pancreatitis. Among these, arterial hypertension was the most prevalent, affecting 49 out of 100 patients, followed by other cardiovascular conditions in 34 out of 100 patients, metabolic conditions in 21 out of 100 patients, pulmonary conditions in 14 out of 100 patients and malignant conditions in 9 out of 100 patients. Only five patients were pre-diagnosed with chronic pancreatitis. Grouped according to the etiology of pancreatitis, our study cohort comprised various categories: 22 patients with post-ERCP pancreatitis, 23 patients with ethyl-toxic pancreatitis, 23 with biliary pancreatitis, 10 with unknown reason for pancreatitis and 19 patients with other causes of pancreatitis. Among the latter, 10 patients developed pancreatitis post-surgically, 4 due to toxic causes, 2 post-traumatic cases, one associated with lipid metabolism disorder, one autoimmune, and one after the rupture of a pancreatic pseudocyst. These were summarized into a group named post-surgical and other. Notably, the exact cause of pancreatitis remained unclear in 13 patients despite extensive investigations. The overall survival (OS) rate was 59%, while 41 patients died during hospitalization.
Fig. 1
Flow chart of patient collection
Table 1 Descriptive data of patient collectiveHospitalization, complications and interventional treatmentMean hospital length of stay was 116.63 days, with 82.39 days at the ICU. Average SOFA (Sequential Organ Failure Assessment) at ICU admission was 8.44 ± 5.44. During hospitalization, 64 patients exhibited renal failure and had to undergo dialysis. Most patients (88%) required invasive mechanical ventilation at some point during hospitalization, more than half (66%) had to undergo tracheostomy and 7 patients required extracorporeal membrane oxygenation (ECMO). Regarding pancreatic complications, 12 individuals exhibited abdominal compartment, 23 patients presented with bowl ischemia and 20 with pancreatic fistulas. Just over half of the patients (51%) experienced bleeding during their stay, 25 of which were managed by angiography. Peripancreatic fluid collections were managed through a multidisciplinary approach. On average, 57 patients underwent 2.96 open necrosectomies/lavages, while 43 patients received an average of 3.27 transgastric necrosectomies and 3.46 transgastric drainages. Furthermore, 58 patients underwent an average of 2.74 endoscopic retrograde cholangiopancreatography (ERCP) procedures, and 76 patients were subject to an average of 2.98 CT drainages (Table 2).
Table 2 Complications and interventional therapies in patients with acute pancreatitis who require intensive medical care during their stayInitial analysis of muscle distributionAverage SMA of the collective was 140.16 cm2, ranging from a minimum of 73.53–226.82 cm2 and average PMA was 15.96, ranging from 4.39 to 32.0 cm2, resulting in an average TAMA of 154.99 ranging from 40.41 to 246.56 cm2. The collective’s mean VAT and SAT were 168.44 and 226.76 cm2, respectively. Upon admission, there were no statistically significant disparities observed in muscle distribution between the groups of patients who ultimately survived and those who did not: PMA was 15.87 cm2 in the survival group and 16.10 cm2 in the non-survival group. Similarly, the average SMA was 142.01 cm2 in the survival group and 137.50 cm2 in the non-survival group, resulting in a mean TAMA of 157.88 cm2 and 153.60 cm2, respectively.
Muscle loss during hospitalizationReviewing the automated segmentations uncovered instances of SMA swelling during hospitalization, which was attributed to fluid therapy and capillary leakage associated with sepsis. Notably, the assessment of PMA appeared less influenced by fluid accumulation. None of the obtained scans needed to be excluded from segmentation due to poor quality or technical obstacles. Utilizing segmentation data, distinct rates of relative muscle loss were computed concerning PMA and the duration between measurement intervals. The observed total muscle loss showed a non-linear trajectory, characterised by an overall negative trend with different rates of decline at different timepoints. A subgroup analysis of the patient collective was performed to gain a more comprehensive insight of muscle changes over time:
The mean long-term PMA loss for the entire cohort was 48.20% (CI 33.87–58.73%). Measurement of mean total/long-term PMA loss per day, calculated between the first and last CT scan, averaged 0.98% per day (CI 0.82–1.14%). Interestingly, in the majority of cases (59 out of 100), the peak of muscle wasting did not occur during the first measurement interval, in average 6.16 days after ICU admission, it occurred later, at an average of 17.03 days after admission to the ICU. The timeframe for experiencing the peak loss was notably wide-ranging: in 8 instances, it had already taken place before ICU admission, while in five cases, it manifested more than 50 days after admission to the ICU. The mean first loss was 2.33% per day (CI 1.73–2.93%), while the mean maximum decay accounted for 4.63% per day (CI 3.38–5.87%). Figure 2 provides an overview of the muscle status of each of the 100 patients.
Fig. 2
Comprehensive overview depicting the progression of muscle wasting in all one hundred ICU patients with acute pancreatitis. The psoas muscle area was segmented based on clinically indicated CT scans using an AI tool
Overall survivalIn the cohort of 100 patients, decedents (41 patients) experienced a significant mean loss of 55.45% (CI 40.17–70.73%), while survivors (59 patients) displayed an average loss of 39.94% (CI 21.55–58.73%). Long-term PMA loss per day significantly differed between the survival groups (p < 0.01), with rates of 0.74% per day (CI 0.62–0.85%) in survivors and 1.34% per day (CI 1.00–1.67%) in non-survivors. Initial loss was notably higher in non-survivors (3.02% per day, CI 1.73–2.93%) than survivors (1.86% per day, CI 1.43–2.26%; p = 0.058). However, the mean maximum loss did not significantly differ between the survival groups (p = 0.22), recording a mean rate of 5.54% per day (CI 4.01–7.07%) in non-survivors and 3.51% per day (CI 2.53–4.49%) in the survival group.
100-Day survivalAssessing survival within the initial 100 days revealed significant distinctions: the non-survivor group (29 patients) exhibited a substantial mean loss of 56.00% (CI 48.75–63.25%), contrasting with the mean loss of 45.02% (CI 40.14–49.91%) observed in survivors (71 patients). Notably, non-survivors experienced a higher mean daily loss of 1.61% (CI 1.17–2.05%) compared to survivors, who displayed a lower mean daily loss of 0.73% (CI 0.63–0.83%; p < 0.001). Specifically, the initial loss in non-survivors was notably higher at 3.54% per day (CI 1.73–5.34%) than in survivors, who had a mean loss of 1.84% (CI 1.43–2.26%; p = 0.022) per day. The differences in maximum loss rates between the groups accounted for a mean loss rate of 5.91% per day (CI 3.86–7.97%) in non-survivors, notably higher than the rate of 3.71% (CI 2.84–4.57%) per day observed in survivors.
Sarcopenia and overweightPatients with sarcopenia (n = 42) naturally presented with lower SMA (117.85 vs. 156.31 cm2; p < 0.001) and PMA (12.56 vs. 18.42 cm2; p < 0.001), but also had significantly smaller SAT (193.23 vs. 251.04 cm2; p = 0.024) and VAT (137.64 vs. 190.73; p = 0.019). Sarcopenic patients experienced significantly lower total PMA loss of 40.23% vs. 53.97% in non-sarcopenic patients (p < 0.001), while the loss rate per day (0.98% vs. 1.02%) did not differ significantly (p = 0.59). Overweight patients (BMI > 25 kg/m2; n = 55) had significantly greater VAT (207.26 vs. 120.97 cm2; p < 0.001) and SAT (266.13 vs. 178.64 cm2; p < 0.001), but also greater SMA (151.12 vs. 126.76 cm2; p < 0.001). These patients were observed with significantly higher total PMA losses (52.53% vs. 42.91%; p = 0.02) and average PMA loss per day (of 1.13% vs. 0.80%; p = 0.039). Patients suffering from obesity (BMI > 30 kg/m2; n = 19) did not present significantly different rates of muscle decay, but had significantly higher SAT and VAT (p < 0.001; p = 0.11) values and exhibited significantly reduced survival rates (37% vs. 64%; p = 0.029).
Etiology of pancreatitisThe patient collective was subdivided into five groups depending on the underlying cause of the pancreatitis, namely, post-ERCP (group 1, n = 22), ethyl-toxic (group 2, n = 23), biliary (group 3, n = 23), post-surgical and other (group 4, n = 19) and unknown (group 5, n = 13). ANOVA analysis of these groups revealed significant differences survival (p = 0.006), gender and age distribution (p = 0.038 and p = 0.002), initial PMA (p = 0.23) and SMA (p = 0.046), as well as maximal PMA loss per day (p = 0.046) and relative overall/long-term loss per day (p = 0.037).
In detail, the survival rates in the biliary group was significantly decreased to only 30%, in contrast to the post-ERCP group (68%, p = 0.008) and the ethyl toxic group (83%, p < 0.001). However, there were no significant differences in survival compared to group 4 (58%, p = 0.61) and group 5 (54%, p = 0.153). Patients with post-ERCP pancreatitis had significantly less muscle mass (TAMA) on average compared to the ethyl-toxic (p = 0.023) and biliary group (p = 0.008). In addition, patients with biliary pancreatitis had more visceral adipose tissue (VAT) compared to patients with post-ERCP (p = 0.034) and ethyl-toxic pancreatitis (p = 0.051).
Analysis of muscle loss rates between groups showed that patients in the biliary pancreatitis group (1.22%; p = 0.028 and p = 0.039) and those with unknown cause of pancreatitis (1.38%, p = 0.015 and p = 0.021) had significantly higher average daily PMA losses than patients in the post-ERCP (0.70%) and ethyl-toxic (0.74%) groups. Conversely, patients with post-surgical and other pancreatitis (group 4; 1.04% PMA loss per day) showed no significant difference from the other groups. In terms of maximum muscle loss observed between two scans, the biliary group showed a notable difference, with an average PMA loss of 7.79% per day. This exceeded the maximum rates of group 1 (2.46%, p = 0.004), group 2 (3.35%, p = 0.015), group 4 (5.02%, p = 0.145) and group 5 (4.38%, p = 0.149). Compared to the other groups, the biliary pancreatitis group had the oldest population and the lowest proportion of women, with a mean age of 68 (CI 60.12–75.88) and only 2 female patients. There were no significant differences in complications and interventional treatment approaches between the groups. Relevant inter-group distinctions are compiled in Table 3, 4, 5.
Table 3 Comparison of muscle decay rates in survivors and non-survivors each for overall and 100-day survivalTable 4 Comparison of tissue distribution and muscle decay rates according to preexisting sarcopenia and overweightTable 5 Comparison of muscle loss rates according to the etiology of the severe pancreatitisOutcome analysisComparing means between OS groups (59 survivors and 41 non-survivors) revealed significant variables from the spectrum of pre-existing conditions, disease complications and muscle loss rates. In particular, overweight showed a significant association with reduced survival (47.46% of overweight individuals among the survivors vs. 65.85% among the non-survivors, p = 0.017), while obesity showed an even stronger correlation with reduced survival (11.86% among the survivors vs. 29.27% among the non-survivors, p < 0.001). Similarly, cardiovascular disease was more common in non-survivors (28.81% vs. 41.46%, p = 0.022). Looking at complications, the non-survivors had significantly more intestinal ischemia (31.71% vs. 17.24%, p = 0.001) and dialysis requirement (75.61% vs. 56.90%, p < 0.001). There were no significant differences in hospital- and ICU-length of stay with 134.89 and 90.27 days in the survivor and 90.34 and 71.05 days in the non-survivor group. The average muscle loss per day diverged significantly between the survival groups, with 1.34% decay per day in the non-survivor and 0.74% in the survivor group (p < 0.001), whereas the first obtained loss with 1.86% vs. 3.02% did not differ significantly (p = 0.075).
Despite slight differences in numbers, the overall pattern remained similar when comparing the 71 survivors and 29 non-survivors in terms of 100-day survival. The survivor group comprised a significantly lower number of overweight (47.89% vs. 72.41%) and obese (12.68% vs. 34.48%) patients compared to the non-survivors (each p < 0.001). In addition, survivors had a lower incidence of cardiovascular disease (29.58% vs. 44.83%) and bowel ischemia (18.57% vs. 34.48%), both statistically significant with p values of 0.030 and 0.003, respectively. In addition, the need for dialysis was lower in survivors (60.00%) compared to non-survivors (75.86%, p < 0.001). In contrast to OS, there were significant differences in ICU-stay for the 100-day survival, with on average 44 days in the non-survivors and 98.07 days in the survivor group (p = 0.008). While overall hospital stays with 69.96 days in the non-survivors and 135.69 in the survivors did not differ significantly. Both first muscle loss and average muscle loss per day, with values of 1.84% vs. 3.54% and 0.73% vs. 1.61% in survivors vs. non-survivors, respectively, showed statistically significant differences (p = 0.022 and p < 0.001). These results are compiled in Table 6.
Table 6 Compiled are the significantly diverging variables between survivors and non-survivors for overall and 100-day survivalROC analysis was applied to assess the ability of different muscle loss rates to predict survival outcomes, overall and 100-day survival. Concerning OS, the first loss rate showed moderate predictability (AUC: 0.607, p = 0.054), the maximal decay rate showed slightly better performance (AUC: 0.718, p = 0.016). The relative total/long-term loss and relative total loss per day showed AUC values of 0.742 (p < 0.001) and 0.709 (p < 0.001) respectively. Focusing on muscle loss rates and 100-day survival outcomes, the first incurred decay rate showed moderate predictability (AUC: 0.659, p = 0.006), while the maximum loss rate per day showed better performance (AUC: 0.709, p < 0.001). Total/long-term loss showed a comparable predictability AUC: 0.659 (p = 0.013). Notably, long-term average loss per day stood out as having the highest predictive potential among the variables, with a substantial AUC of 0.814 (p < 0.001), indicating robust predictive ability for 100-day survival outcomes (Fig. 3).
Fig. 3
ROC analysis of multiple muscle decay rates for 100 days and overall survival. Naturally, the average daily muscle decay over the entire stay showed good discriminatory power for survival. However, the values of the first and maximum muscle loss, available much earlier during hospitalization, also showed good predictive power
Based on the ROC tables, we used the Youden index calculation to determine optimal thresholds for OS and found a maximum muscle loss rate of 3.23% per day, as well as a first loss rate of 1.98% per day. Utilizing these determined cutoff values and considering the prevalence of overweight individuals in the patient cohort, we conducted a Kaplan–Meier analysis. The results indicated notable disparities in OS among patients exceeding both first muscle loss (p = 0.013) and the maximum muscle loss cutoff (p = 0.001). Furthermore, individuals identified as overweight at ICU admission exhibited significantly reduced 100-day survival rates (p = 0.037). Results are shown in Fig. 4.
Fig. 4
Kaplan–Meier curves of overall survival in ICU-patients with severe pancreatitis. Individuals were grouped according to a cut off for the maximal (A) and first (B) occurred muscle decay. Muscle loss beyond the defined thresholds showed significantly reduced survival (p = 0.001 and p = 0.013). In addition, survival was significantly limited in overweight (BMI > 25 kg/m.2) patients (C; p = 0.037)
留言 (0)