
記住我


The Japan Public Health Center-based Prospective Study (the JPHC Study) is an ongoing cohort study designed to investigate associations between lifestyle habits and non-communicable diseases. The JPHC Study has been described in detail elsewhere [13]. Briefly, the JPHC Study consists of Cohort I, established in 1990, and Cohort II, established in 1993, involving a total of 140,420 individuals (68,722 men, 71,698 women) in 11 public health centres (PHC) nationwide aged 40–69 at the beginning of the baseline survey.
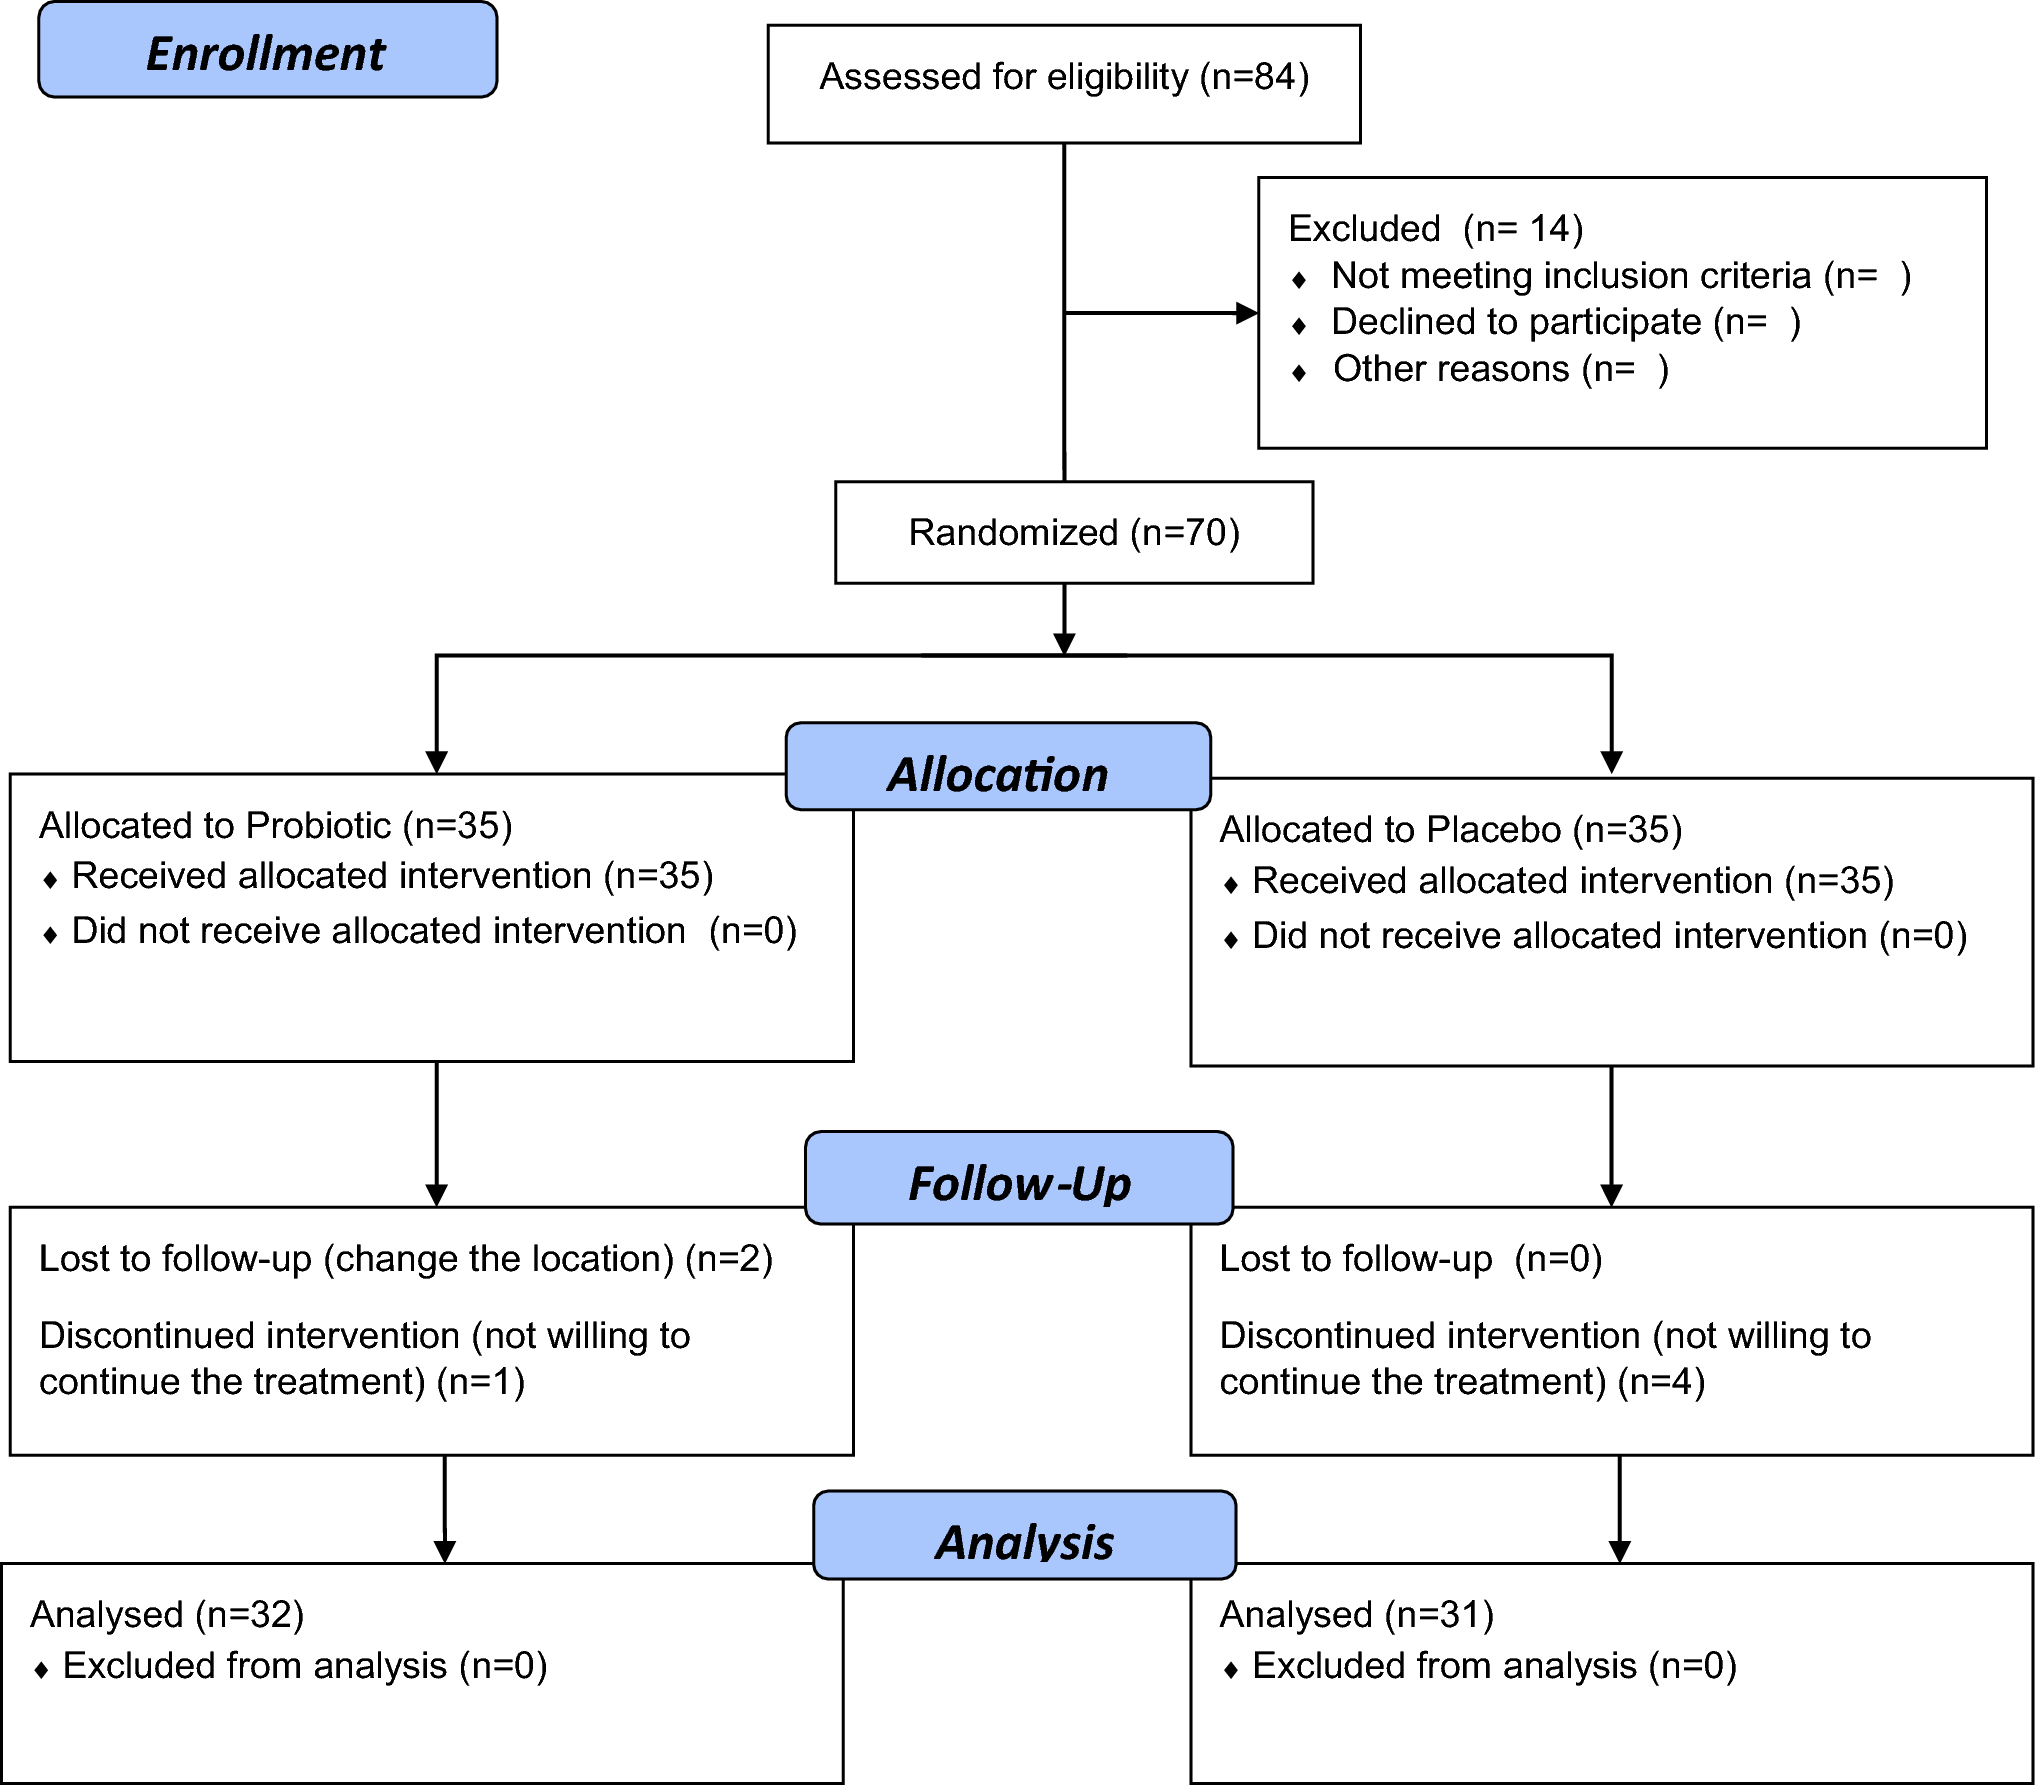
Study populationFor this study, we included those who responded to a self-administered 5-year follow-up questionnaire between 1995 and 1999, which included comprehensive information on dietary intake and lifestyle-related factors. Figure 1 shows the flow diagram of study participant selection. We excluded participants from Katsushika, Tokyo, due to the lack of cancer incidence information. After excluding those who died or moved out of the study area before the 5-year follow-up survey, non-Japanese nationals, incorrect birthdate, duplicates, cancer diagnosis before the 5-year follow-up survey, non-response, history of any type of cancer, history of gastric surgery, or reported extreme energy intake (men: < 800 or > 4200 kcal; women: < 500 or > 3500 kcal), 90,504 (42,328 men and 48,176 women) participants remained for analysis.
Fig. 1 Exposure and covariates
The self-administered questionnaire at the 5-year follow-up collected data on smoking, alcohol consumption, physical activity, anthropometry, and medical history. It also included a comprehensive food frequency questionnaire (FFQ). It covered 138 food and drink items with nine eating frequency categories (never; 1–3 times/month; 1–2 times/week; 3–4 times/week; 5–6 times/week; once/day; 2–3 times/day; 4–6 times/day; ≥ 7 times/day) and three portion sizes (small: 50% smaller than the standard size; medium: standard; large: 50% larger than the standard size). The FFQ also included questions on consumption of 19 seafood items (from here on referred to as fish and shellfish: canned tuna, salmon/trout, bonito/tuna, cod/flatfish, sea bream, horse mackerel/sardines, mackerel pike/mackerel, shirasuboshi (dried young sardines), chikuwa (Japanese fish cake), kamaboko (Japanese cured surimi (minced fish paste)), salted fish, salted fish roe, dried fish, eel, squid, octopus, prawn, short-necked clam, and viviparide). These items were further categorised into: fish (canned tuna, salmon/trout, bonito/tuna, cod/flatfish, sea bream, horse mackerel/sardines, mackerel pike/mackerel, shirasuboshi, salted fish, dried fish, and eel), salted fish (salted pike/mackerel, salted cod/flatfish, salted salmon/trout, salted fish roe, dried fish, and shirasuboshi), and n-3 PUFAs-rich fish (salmon/trout, horse mackerel/sardines, mackerel pike/mackerel, eel, and sea bream, based on the mount of n-3 PUFAs in 100 g (g) edible fish portion). Daily consumption of fish and shellfish, salted fish, and n-3 PUFA-rich fish (measured in g/day) were calculated by multiplying the frequency by relative portion size. For n-3 PUFAs, we focused on eicosapentaenoic acid (EPA), docosapentaenoic acid (DPA), and docosahexaenoic acid (DHA), n-3 PUFAs that are often found high in marine food, to look at the association between marine-based n-3 PUFAs and gastric cancer risk [14]. Daily intake of EPA, DPA, and DHA was calculated using Japanese food fatty acid composition tables [15]. The sum of EPA, DPA, and DHA was considered as marine n-3 PUFAs in our study, as about 90% of these n-3 PUFAs consumed among the study participants derived from marine food. All dietary intake variables were log-transformed and adjusted for total energy intake using the residual method and divided into quintiles for both sexes.
FFQ validation for fish,shellfish, and marine n-3 PUFAs were conducted using 14- or 28-day dietary records, which are considered a gold standard. Spearman correlation coefficient for fish and shellfish for Cohort I was men 0.32, women 0.32, and for Cohort II, men 0.27, women 0.23 [16, 17]. Spearman correlation coefficient for marine n-3 PUFAs in Cohort I were EPA: men 0.38, women 0.45; DPA: men 0.32, women 0.39; and DHA: men 0.34, women 0.37 [18]. Reproducibility of the FFQ was evaluated by administering two questionnaires 1 year apart. Spearman correlation coefficient for fish and shellfish for Cohort I was men 0.44, women 0.34, and for Cohort II, men 0.45, women 0.40 [17, 19].
Laboratory analysisInformation on H. pylori infection and atrophic gastritis was available for 31% of participants who provided blood samples at the baseline survey in Cohort II (8,702 men and 15,672 women). H. pylori was measured using plasma immunoglobin G (IgG) level through an enzyme immunoassay (Eiken Kagaku, Tokyo, Japan). IgG titer ≥ 10 U/mL was considered as H. pylori-positive. Atrophic gastritis was defined using plasma levels of pepsinogen I and II, measured by a latex-agglutination assay (Eiken Kagaku, Tokyo, Japan), with pepsinogen I ≤ 70 ng/mL and pepsinogen I/II ratio ≤ 3.0 considered as positive [20].
Follow-up and identification of gastric cancer casePerson-years of follow-up were calculated from the date of the 5-year follow-up survey to the date of gastric cancer diagnosis, death, move out from the study area, or until 31 December 2013 (except Osaka PHC: 31 December 2012), whichever came first. The residential registry was used to confirm residence and survival status. Gastric cancer incidence was identified by active patient notification from major local hospitals in each PHC area and linkage of the record with population-based cancer registries, and were supplemented by death certificates. Gastric cancer was coded using the International Classification of Diseases (ICD) for Oncology, 3rd edition (C16.0 to 16.9) [21]. Residual cases were tumours that could not be classified due to overlapping lesions (C16.8) or no information (C16.9).
Statistical analysisWe used Cox proportional hazards regression models to estimate hazard ratios (HRs) and their 95% confidence intervals (CIs), running multivariable models using the lowest quintile as a reference. We conducted the analysis separately for men and women since gastric cancer incidence is significantly higher in men [22]. The models were adjusted for potential confounders based on previous studies: metabolic equivalent of tasks (METs, continuous), body mass index (BMI, weight (kg)/height(m)2, continuous), total energy, meat consumption (energy-adjusted, continuous), fruit consumption (energy-adjusted, continuous), vegetable consumption (energy-adjusted, continuous), alcohol consumption (main analysis: men: never/former, < 150, 150–299, 300–449, ≥ 450 g ethanol/week; women: never/former, < 150, 150–299, ≥ 300 g ethanol/week; H. pylori and atrophic gastritis analysis: men: never/former, < 150, 150–299, 300–449, ≥ 450 g ethanol/week; women: never/former, current), smoking (never, former, < 20 cigarettes/day, ≥ 20 cigarettes/day), history of diabetes mellitus, use of anti-cholesterol drugs, history of gastric ulcer, and family history of gastric cancer. We used two definitions of salted food depending on the analysis: salted food excluding salted fish, or salted food and salted fish. When evaluating the association between salted fish and gastric cancer, we used salted food excluding salted fish (energy adjusted, continuous). For the analysis on the association between fish other than salted fish and gastric cancer, we used salted food and salted fish (energy adjusted, continuous) to evaluate the effect of salt. Because the consumption of salted food and salted fish varies heavily by the region of Japan [23], we thought that adjusting the model by PHC may mask the true association between fish consumption and gastric cancer. Therefore, we included PHC as a covariate for all models except for salted fish. We tested for linear trends using the median value of each quintile. For salted fish, fish excluding salted fish, and n-3 PUFAs-rich fish analyses, we adjusted for fish excluding salted fish, salted fish, and lean fish consumption, respectively, in addition to the confounding variables listed above. We performed sensitivity analysis by running the same model excluding gastric cancer cases diagnosed within 3 years of follow-up. For multi-variable analysis, we used multiple imputation to impute missing data on METs (3.6%), alcohol consumption (7.7%), smoking status (4.9%), BMI (2.6%), family history of gastric cancer (12.5%), and vegetable intake (0.1%) using the command “mi estimate”, created based on Rubin rules [24]. We assessed interaction between the exposure variables and BMI (< 25, ≥ 25 kg/m2), smoking (never/former, current), and alcohol consumption (never/former, ever) by comparing the model with or without an interaction term using the likelihood ratio test with or without an interaction term. We also conducted an analysis based on the anatomical region of the tumour (proximal, upper one-third of the stomach, versus distal, lower two-thirds of the stomach), based on The Japanese classification of gastric carcinoma, 3rd edition [25].
Among those with available information on H. pylori and atrophic gastritis, we performed subgroup analyses on the association between fish and shellfish consumption and risk of gastric cancer based on the H. pylori infection and atrophic gastritis status. Given that atrophic gastritis is caused by H. pylori infection-related chronic gastritis [26, 27] and the small number of cases, we divided the subjects into four categories based on their H. pylori infection and atrophic gastritis status: H. pylori antibody and atrophic gastritis negative (H. pylori − /AG −), H. pylori antibody positive (H. pylori +), those with atrophic gastritis (AG +), and H. pylori antibody and/or atrophic gastritis positive (H. pylori + and/or AG +).
All analyses were performed using Stata 16.0 (StataCorp LLC).
留言 (0)