A composite clinical rating scale, the Spinocerebellar Ataxias Composite Score (SCACOMS), was developed based on the approach described by Wang et al. (2016), used to create the ADCOMS in Alzheimer’s disease [12]. The methodology permits the objective selection and weighting of measures based on their responsiveness to disease progression as observed in natural history studies. The resultant composite scale is highly sensitive to disease progression, a key requirement in psychometric scale validation [13]. The approach involves the application of partial least squares (PLS) regression and data from natural history studies to derive the scale. The availability of two natural history data sources allows for cross-validation of the composite scale. This composite scale is then applied to data from a clinical trial assessing an experimental SCA therapy, to estimate the treatment effect and associated temporal delay in disease progression with treatment. The goal was to develop an optimally weighted composite score for measuring disease progression over 48-weeks in mild-to-moderate stage SCA patients.
PLS regression can be considered a construct of two other techniques: principal components regression and reduced rank regression. Principal components regression was developed to allow for correlated variables in regression and identification of a smaller set of uncorrelated variables for applied use. In principal components regression, selected factors are optimized based on predictor variation, while reduced rank regression selects factors optimized to describe response variation. PLS regression balances explanatory predictor variation with explanatory response variation; thus, the correlation between the composite variables and the response variable is greater than with principal components regression, and the method will identify composites with high responsiveness and low bias.
Data Sources
Two natural history studies—the Clinical Research Consortium for Spinocerebellar Ataxias (CRC-SCA; NCT01060371) and the European Integrated Project on Spinocerebellar Ataxias (EUROSCA; NCT02440763) provided ample data on longitudinal disease progression with multiple years of follow up, and were used to establish the natural progression of SCAs [14,15,16].
CRC-SCA is a natural history study with the primary objective of describing the clinical characteristics and progression of symptomatic, genetically confirmed, untreated SCA patients, specifically individuals aged 6 years and above with SCA 1, 2, 3, 6, 7, 8, and 10 (Table 1) [14]. A total of 650 participants were recruited across 14 centers in the United States, and longitudinal evaluations were conducted at 12-month intervals. Outcomes collected included ataxia progression as measured by SARA, along with functional assessments, patient-reported outcome measures, and clinical measures. Data were collected from 2010 to the present.
Table 1 Overview of natural history studies used to derive SCACOMS EUROSCA is a European natural history cohort study initiated in 2005 to understand the natural history of SCA and to identify prognostic factors in patients with SCA genotypes 1, 2, 3, and 6 (Table 1) [15, 16]. EUROSCA comprises clinical and clinical-genetic data pertaining to SCA. Outcomes collected included ataxia progression (SARA), along with other functional and clinical measures. Participants were recruited across 17 centers with evaluations conducted at 12-month intervals. Data on 423 subjects with SCA were available for the current analysis. For both natural history datasets, the follow up period for the PLS regression analyses was from baseline to two years.
The derived and validated SCACOMS were applied to estimate treatment effects among patients enrolled in the BHV4157-206 (NCT03701399) study dataset, a phase 3, multicenter, randomized, double-blind, placebo-controlled parallel-group study designed to assess the safety, tolerability, and efficacy of troriluzole in adults with SCA genotypes 1, 2, 3, 6, 7, 8, and 10 [17]. Subjects were randomized to receive placebo or troriluzole and were stratified by SCA genotype. The primary objective was to compare the efficacy of troriluzole vs placebo on ataxia symptoms in subjects with SCA after 48 weeks of treatment, as measured by the total score on the f-SARA, a modified version of SARA developed for use in the clinical trial setting [17]. Despite minimal change in the primary end point in the overall study population, post-hoc analyses in a pre-specified subgroup of patients with SCA3 showed consistent treatment benefits across multiple outcome measures including the change from baseline f-SARA at Week 48, CGI total score at Week 48, and a robust reduction in fall risk over the study period. In total, SCA3 subjects represented 41% of study participants [18].
Analyses
Within the CRC-SCA and EUROSCA databases, the population was restricted to align with the inclusion and exclusion criteria of the BHV4157-206 clinical study, specifically, baseline SARA gait of 1 to 7. Analyses included patients with available data for all included model variables at baseline and 12 or 24 months. The resultant analytic sample sizes in the natural history datasets for the derivation of four SCACOMS models were of n = 214 for CRC-SCA all SCA genotypes, n = 77 for CRC-SCA SCA3 genotype only, n = 423 for EURO-SCA all SCA genotypes, and v = 106 for EURO-SCA SCA3 genotype only.
Data preparation
Candidate scales deemed sensitive to disease progression and convergent with items included in the BHV4157-206 study were identified within the natural history studies as SARA, Friedreich ataxia rating scales-activities of daily living (FARS-ADL), the Friedreich ataxia rating scale-functional staging (FARS-FUNC) and the CGI. Since the SARA was common in both natural history datasets, and the f-SARA was utilized in BHV-4157–206, the latter was mapped from SARA in the natural history data sets. Specifically, the first four items of SARA (gait, balance, sitting, and speech) were rescaled to mirror the 5-point scaling options of f-SARA. This derivation was similar to the method by Moulaire et al. 2023 [11]. Further details on these scales, and mapping algorithm is available in the electronic supplementary material.
In general, each item from the original scales could serve as candidate items in the derivation of the composite, however there were differences in scale availability between CRC-SCA and EUROSCA. For the CRC-SCA dataset, item selection incorporated all items from f-SARA, FARS-FUNC, and CGI. Although FARS-ADL items were of interest, limited data availability prohibited use. For EUROSCA, the selection of items included all items from f-SARA and the CGI, as FARS-FUNC and FARS-ADL were not collected. Other scales were examined to evaluate whether a robust proxy may be included, however these were not available.
Prior to examining item performance in PLS regression models, the item-level scores were standardized across scales by transforming scores into a 0 to 1 scoring range. A score of 0 uniformly reflected the best possible score and a score of 1 reflected the worst possible score. Additional details on data preparation are in the electronic supplemental material.
PLS regression
To assess disease progression from individual candidate scale items, linear decline models were fit using PLS regression techniques (R v4.2.1) [12, 19, 20]. A linear decline model was deemed a valid representation of disease progression as the population was constrained to patients within the linear phase of an overall sigmoidal decline observed over the follow up period [10].
In deriving composite scales using PLS regression, time is considered the dependent variable as a measure of disease progression during the period of linear decline. Items derived from the regression analysis and their weightings (e.g., f-SARA, FARS-FUNC, CGI) were defined as predictor variables.
Another feature of PLS regression is the application of the variable importance of projection (VIP) and Wold’s criteria to support the selection of relevant candidate items. VIP scores denote a variable's significance in the PLS model and in this analysis, the degree to which that variable influences progression over time in the overall dataset. Wold’s criteria is the threshold used to evaluate the significance of the items. VIP scores are calculated for a given variable as a sum of its squared PLS weights, weighted by the percentage of variance in the outcome variable explained by each latent variable. Variables with VIP scores > 0.5 were included and if variables had VIPs that approximated 0.5, these were included if deemed to be clinically relevant and if they contributed over 5% of the total composite score weight. The PLS regression coefficients were then used as weights that reflected the relative contribution towards progression amongst the items. The resultant composite score (SCACOMS) thus reflects a weighted linear combination of the selected individual scale items. To support interpretation of SCACOMS, the mean to standard deviation ratio (MSDR) was calculated as a measure of responsiveness. MSDRs are defined as the change from baseline (CFB) for each item at follow up divided by the standard deviation for the CFB. MSDRs are essentially identical to Standardized Response Means (SRM) utilized in psychometric scale validation. MSDRs were estimated for both individual items in SCACOMS and for the total scale.
These regressions were repeated across both datasets, on the full population, and on the SCA3 subset of the population to assess whether the item selection and weights differed among these different cohorts. Additional details on the regression models are provided in the electronic supplemental material.
Cross-validation
Two cross-validation techniques were performed to assess the reliability of SCACOMS: cross-validation by interchanging weights between CRC-SCA and EURO-SCA and a fivefold split sample analysis within each individual dataset.
Cross-validation by interchanging weights amongst scales involved comparing the MSDR of SCACOMS total scores between the original CRC-SCA and EUROSCA models and after swapping the item weights between datasets (i.e., using CRC-SCA data with EUROSCA PLS regression weights and vice versa). The purpose of cross validation is to discover how much the performance of the scale is expected to decrease when applied in a dataset external to the training set, with some degradation expected.
Since functional stage (FARS-FUNC) was not available in EUROSCA, modifications to this approach were employed: 1) we discounted functional stage data and used the weights for all other variables; and 2) we used the functional stage weight from the CRC-SCA model and redistributed the EUROSCA weights such that functional stage contributed the same original percentage.
A fivefold cross validation was performed by randomly assigning subjects in the natural history datasets into 5 cohorts. Each cohort was systematically omitted, such that the remaining 80% of the pooled study population was used to derive the model (training set). This model was then tested on the remaining 20% (test set). This process was repeated 40 times, with the composition of the training and test sets being randomly allocated in each iteration (40 iterations × fivefold, for 200 estimates total). MSDR values were compared between the training set and the test set within each fold, for each iteration, to estimate the average residual bias of the MSDR in the total population.
Evaluation of Treatment effects in BHV4157-206
The following four SCACOMS models were developed and validated:
CRC-SCA-derived model in all SCA patients applied to SCA3 subgroup of BHV-4157–206
EUROSCA-derived model in all SCA patients applied to SCA3 subgroup of BHV-4157–206
CRC-SCA-derived model in SCA3 patients applied to SCA3 subgroup of BHV-4157–206
EUROSCA-derived model in SCA3 patients applied to SCA3 subgroup of BHV-4157–206
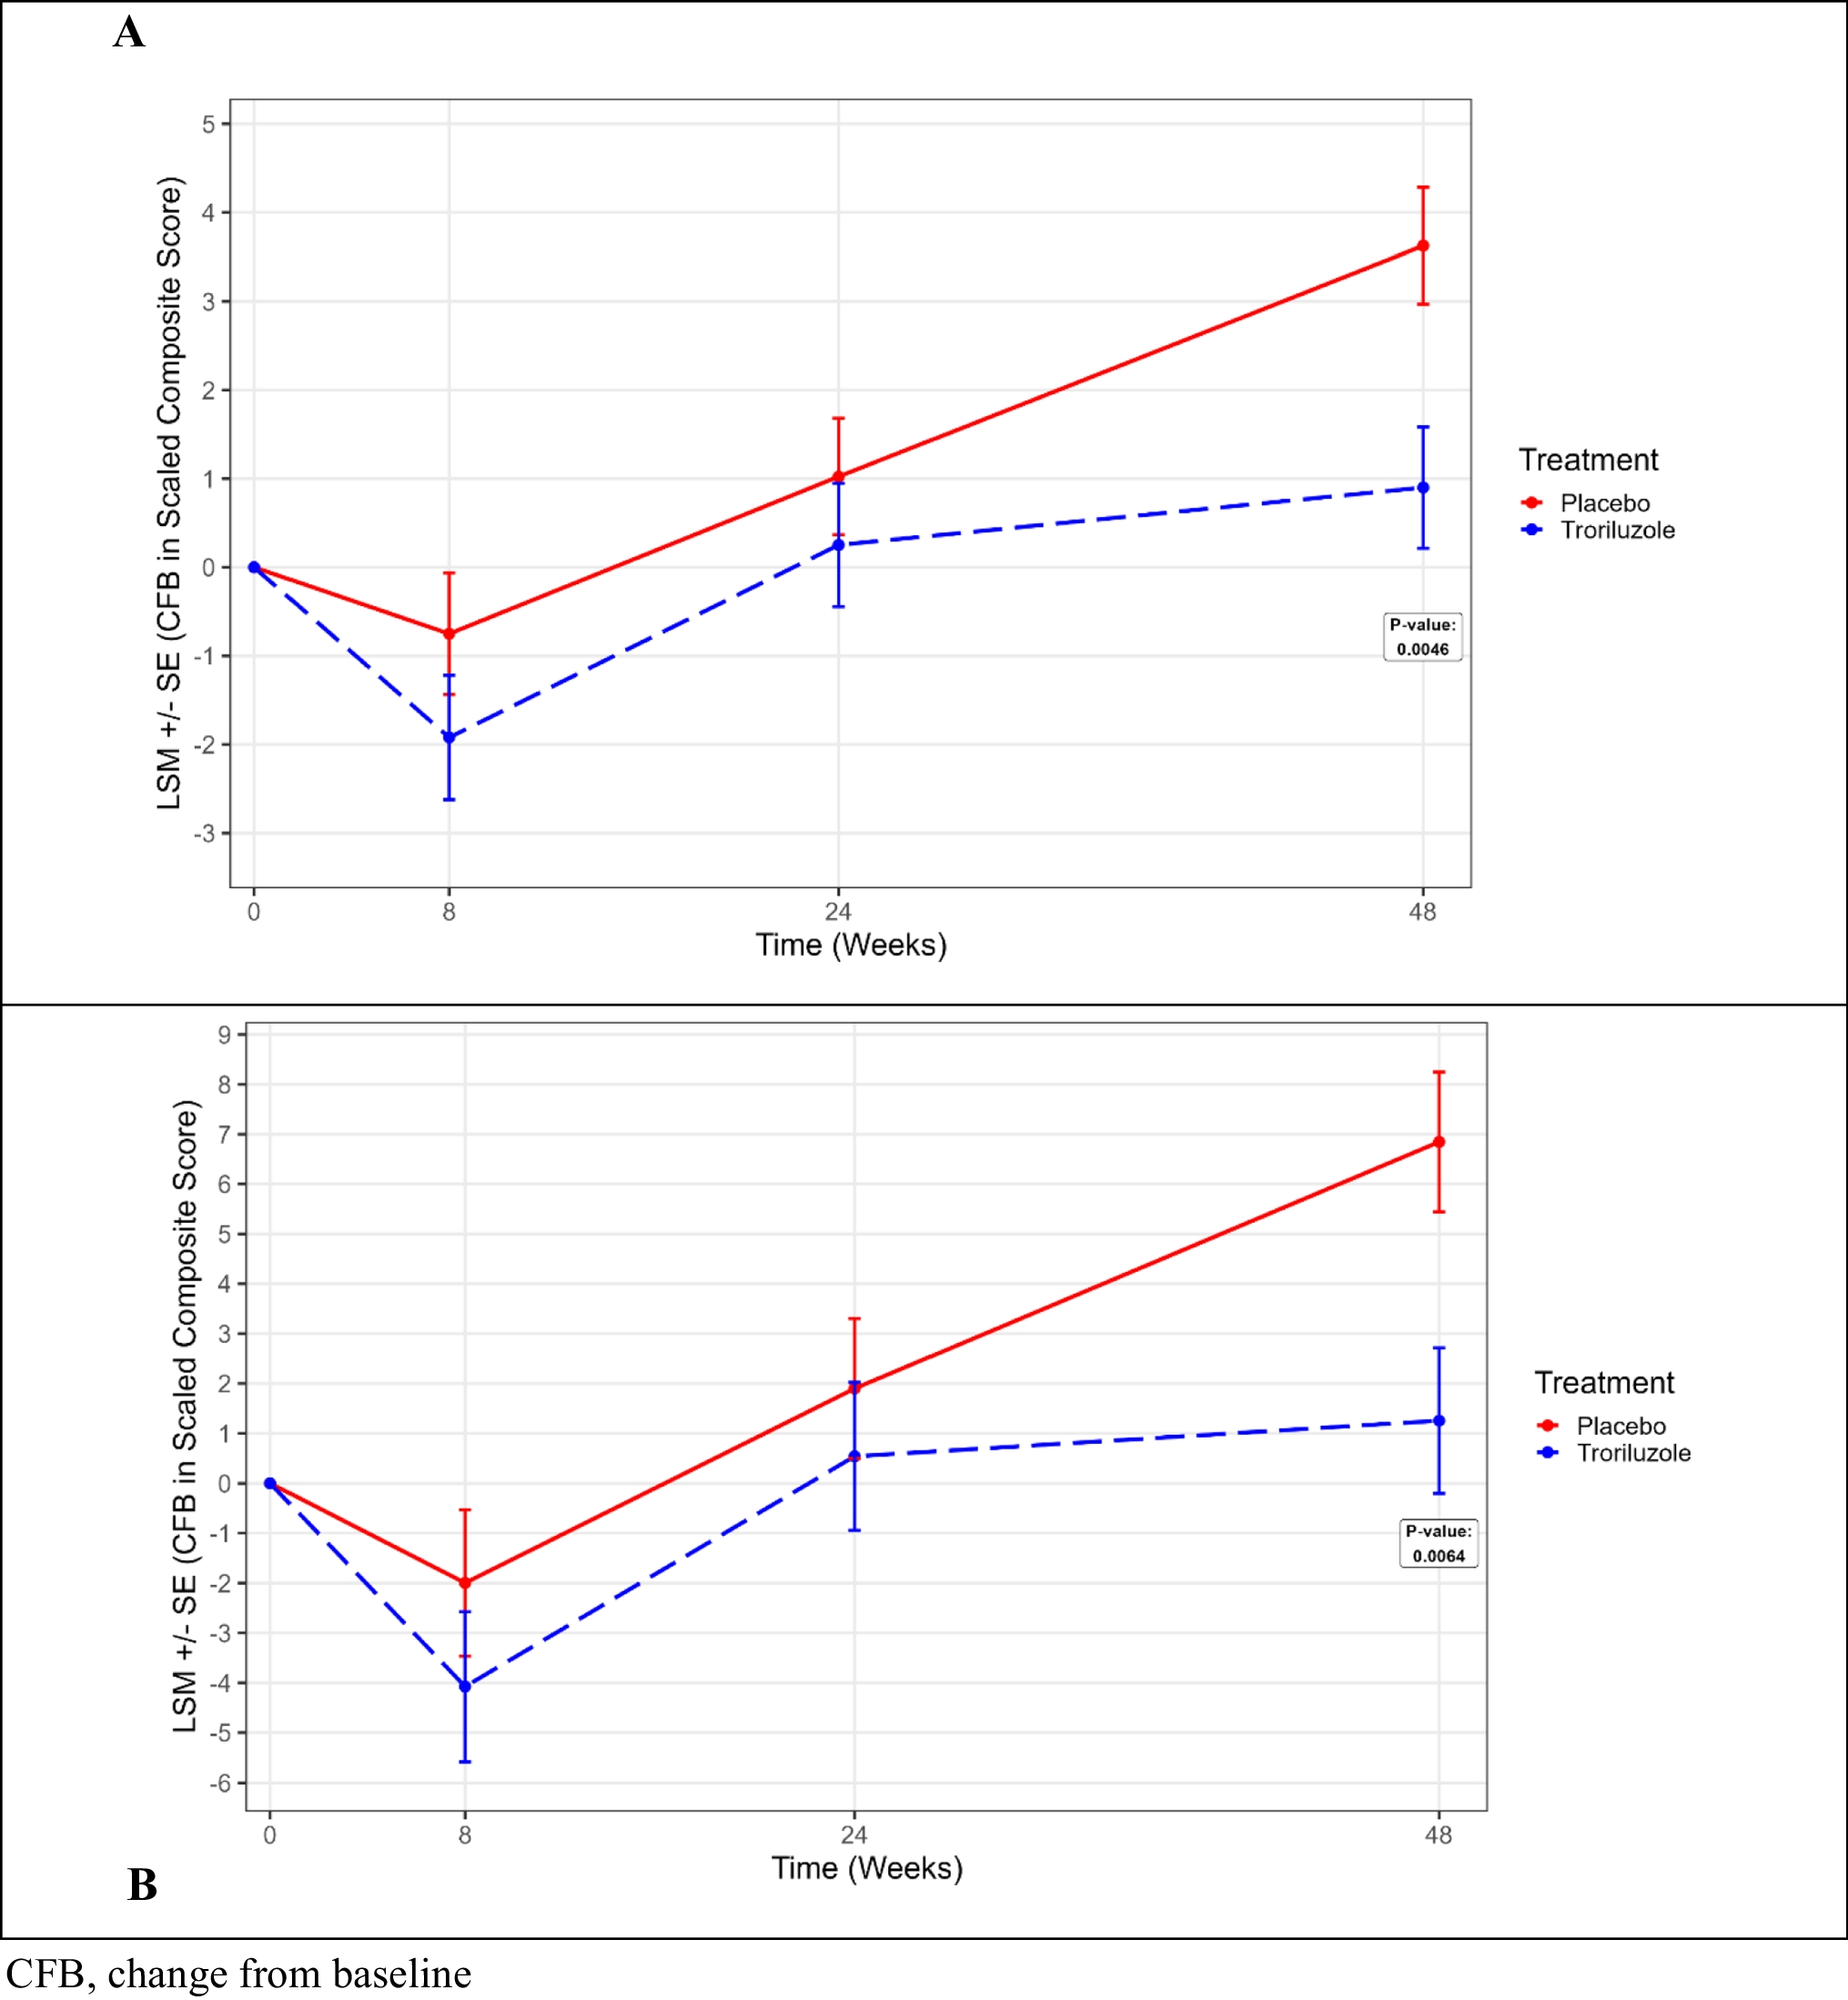
For each of the four models, treatment effects were estimated in the SCA3 subgroup of patients enrolled in BHV4157-206. Since these analyses were post-hoc and designed to provide an illustration of the treatment effect, patients were analyzed according to their treatment allocation. Using mixed model repeated measures (MMRM) with fixed effect covariates for treatment, analysis visit, cohort by treatment, and baseline SCACOMS score as covariates, the study evaluated the SCA3 population via SCACOMS at baseline, week 8, week 24 and week 48. In addition, the percent progression avoidance, Cohen’s d, and the estimated delay (months) in progression with troriluzole treatment were calculated [21].
Lastly, sample sizes required to demonstrate a 30% and 50% delay in disease progression, at 80% and 90% power were calculated. Percent delay in disease progression with treatment is used in conjunction with the placebo progression to determine the Cohen’s d for each model. The sample size calculations are based on the effect size and power for a potential SCA clinical trial, when using SCACOMS compared to existing clinical trial scales (e.g., f-SARA, CGI, FARS-FUNC).


留言 (0)