
記住我

There was a notable proportion of ANC coverage for at least four visits among individuals aged 20–49 years in Nigeria in 2003, reaching 50.2% (95% CI, 47.2, 53.2) than those aged 15–19 years. However, in 2008, there was a decline in coverage to 46.8% (95% CI, 45.3, 48.5) (Fig. 2a). In 1997, the proportion of ANC coverage among individuals aged 20–49 years in Chad was 14.9% (95% CI, 13.2, 16.8). However, coverage was pointedly increased in 2004 (17.3%) and 2014 (30.6%). This rise was also observed in the younger age bracket (15–19 year) (Fig. 2b). The ANC coverage among individuals aged 20–49 in Liberia was 66% (95% CI, 62.9, 68.8) in 2007. Subsequently, there was an increase in coverage to 77.9% (95% CI, 75.6, 79.9) in 2013 and further to 87.6% (95% CI, 85.6%, 89.3) in 2019 (Fig. 2c). The ANC coverage in Sierra Leone for individuals aged 20–49 exhibited an upward trend, starting from 56.8% (95% CI, 53.5, 58.9) in 2008 and increasing to 78.2% (95% CI, 76.1, 80.2) in 2019 (Fig. 2d).
Fig. 2
a Proportion of ANC coverage at least four visit in Nigeria, by Age (2003,2008,2013 and 2018). b Proportion of ANC coverage at least four visit in Chad, by Age 1997,2004 and 2014. c Proportion of ANC coverage at least four visit in Liberia, by age (2007, 2013,and 2019). d Proportion of ANC coverage at least four visit in Sierra Leone, by age (2008, 2013,and 2019)
ANC coverage (at least four visits (%)) by educational statusThe ANC coverage in the survey year 2003 in Nigeria among individuals with no formal education was 25% (95% CI, 22.2, 28.1). However, there was a decrease in coverage among this group in 2008, with a proportion of 21.9% (95% CI, 20.1, 23.9). On the other hand, an ascending trend in coverage was observed in the survey years 2013 (27.6%) and 2018 (34.5%) for individuals with no formal education. A descending trend was observed among other educational status subgroups between 2003 and 2008, followed by ascending trends in 2013 and 2018 (Fig. 3a).
Fig. 3
a Proportion of ANC coverage at least four visit in Nigeria, by educational status (2003, 2008, 2013 and 2018). b Proportion of ANC coverage at least four visit in Chad, by educational status (1997, 2004 and 2014). c Proportion of ANC coverage at least four visit in Liberia, by educational status (2007, 2013 and 2019). d Proportion of ANC coverage at least four visit in Sierra Leone, by educational status (2008, 2013 and 2019)
The ANC coverage of at least four visits in Chad exhibited an ascending trend in the survey years 1997, 2004, and 2014 among individuals with no formal education, with proportions of 10.3%, 13.2%, and 22.7% respectively. On the other hand, for individuals with primary education, there was a slight descending trend from the survey year 1997 (28.6%) to the survey year 2004 (27.1%), but an increase in coverage was observed in the survey year 2014 (41.5%). Additionally, an increase in ANC coverage was consistently observed among individuals with secondary educational attainment in all the survey years (Fig. 3b).
The ANC coverage of at least four visits in Liberia has shown an upward trend in all educational subgroups across all survey years. Among individuals with no formal education, the coverage proportion was recorded to be 61.5% (95% CI, 57.4, 65.4) in 2007, 70% (95% CI, 67.2, 73.8) in 2013, and markedly increased to 87.8% (95% CI, 82.9, 88.1) in 2019. It's worth noting that ANC coverage has notably increased throughout all survey years within each educational attainment subgroup (Fig. 3c).
In Sierra Leone, the ANC coverage of at least four visits exhibited an upward trend in all survey years, specifically in subgroups with no formal education and primary education. However, there was a noticeable downward trend in the secondary school educational subgroup from 2013 (82.1% with a 95% CI of 78.5% to 85.1%) to 2019 (76.8% with a 95% CI of 73.1% to 80.1%) (Fig. 3a, b, c, d).
ANC coverage (at least four visits (%)) by place of residenceIn 2003 in Nigeria, the ANC coverage in the urban setting is 71.1% while the rural is 37.6%, which shows higher ANC coverage in the urban setting than the rural. While in 2008, the ANC coverage in the urban setting was 68.8% whereas the rural was 34.4%, which indicates higher ANC coverage in the Urban setting than the rural. In the survey year 20,013, the ANC coverage in the urban setting of Nigeria has reached to 74.5% while the rural was 38.2%, this shows high ANC coverage in the urban setting. In the survey year 2018, the ANC coverage in the urban setting of Nigeria was 73.7%, whereas the rural was 45.8%, which shows higher coverage in the urban setting (Fig. 4a). In Chad, the ANC coverage demonstrated an ascending trend in both rural and urban settings across all survey years, depicting higher ANC coverage in the urban setting; 1997(urban = 35.9%, rural = 9.2%), 2004 (urban = 43.7%, rural = 11.7%) and 2014 (urban = 51.1%, rural = 25.9%) (Fig. 4b). Similarly, ANC coverage in Liberia showed an upward trend in all survey years across urban and rural settings; 2007(urban = 76.1%, rural = 60.9%), 2013 (urban = 83.4%, rural = 72.1%) and 2019 (urban = 89.4%, rural = 84.7%) (Fig. 4c). The ANC coverage in Sierra Leone exhibited an upward trend from the survey year 2008 (65.9%) to 2013 (79.9%) in urban settings. However, there was a subsequent descending trend to the survey year 2019 (72.5%), which shows higher ANC coverage in the urban setting than the rural ones (Fig. 4d).
Fig. 4
a Proportion of ANC coverage at least four visit in Nigeria, by residence (2003, 2008, 2013 and 2018). b Proportion of ANC coverage at least four visit in Chad, by residence (1997, 2004 and 2014). c Proportion of ANC coverage at least four visit in Liberia, by residence (2007, 2013 and 2019). d Proportion of ANC coverage at least four visit in Sierra Leone, by residence (2008, 2013 and 2019)
ANC coverage (at least four visits (%)) by economic status (Nigeria)ANC coverage of at least four visits in Nigeria showed an ascending trend in all the survey years with the highest coverage identified in the survey year 2018 in which the proportion of quintile 1(poorest) was 30.7%, quintile 2(42.7%), quintile 3(60.6%), quintile 4(73.3%), and quintile 5(richest) was (85.4%). In all study years the ANC coverage was lower for quintile 1 groups and higher among quintile 5 (Table 1).
Table 1 Proportion of ANC coverage at least four visits in Nigeria by Economic Status (2003, 2008, 2013 and 2018)ANC coverage (at least four visits (%)) by economic status (Chad)ANC coverage of at least four visits in Chad showed an ascending trend in all the survey years with the highest coverage identified in the survey year 2014 in which the proportion of quintile 1(poorest) was 23.7%, quintile 2(26.2%), quintile 3(26.3%), quintile 4(28.3%), and quintile 5(richest) was (53.4%). The lowest coverage was reported in the survey year 2004 among the quintile 1 (poorest) Economical status subgroup (2.2%, (95% CI, 0.97, 4.9)) (Table 2).
Table 2 Proportion of ANC coverage at least four visits in Chad by Economic Status (1997, 2004 and 2014)ANC coverage at least four visits (%) by economic status in Liberia and Sierra LeoneANC coverage of at least four visits in Liberia showed an ascending trend in all the survey years with the highest coverage identified in the survey year 2018 in which the proportion of quintile 1(poorest) was 82.5%, quintile 2(87.6%), quintile 3(86.3%), quintile 4(89.2%), and quintile 5(richest) was (91.3%). The lowest coverage was reported in the survey year 2007 among the quintile 1 (poorest) Economical status subgroup (54.9%, (95% CI, 49.5, 60.1)).
The ANC coverage for at least four visits in Sierra Leone exhibited an upward trend in the survey year 2008. The richest subgroup (quintile 5) achieved the highest coverage of 70.1% (95% CI, 64.2, 75.3), while the lowest coverage was 48.8% (95% CI, 44.1, 53.6). However, in the survey years 2013 and 2019, the trend of ANC coverage appeared somewhat irregular (Table 3).
Table 3 Proportion of ANC coverage at least four visits in Liberia and Sierra Leone by Economic Status (2007, 2008, 2013 and 2019)ANC coverage at least four visits (%) by subnational region in NigeriaAs shown in Table 4, the proportion of ANC coverage for at least four visits in Nigeria varied across regions. The highest coverage was observed in the south-western region, reaching 92.8% in 2003, while the lowest coverage was recorded in the northwest region in 2008, with a proportion of 20.6% (Table 4).
Table 4 Proportion of ANC coverage of at least four visits in Nigeria by Subnational region (2003, 2008, 2013 and 2018)ANC coverage at least four visits (%) by subnational region in Chad.As shown in Table 5, the ANC coverage for at least four visits in Chad varied across different regions. The highest proportion was documented in N'djamena during the survey year 2014, reaching 57.8%, whereas the lowest proportion was observed in Biltine during the survey year 1997, with a mere 0.94% coverage (Table 5).
Table 5 Proportion of ANC coverage of at least four visits in Chad by Subnational region (1997, 2004 and 2014)ANC coverage at least four visits (%) by subnational region in Liberia and Sierra LeoneThe proportion of ANC coverage of at least four visits in Liberia was reported to be high across regions in most survey years. The highest reported proportion is 89.9% in North Central in the survey year 2019 while the lowest was observed in 2007 in the southeastern a region. The proportion of ANC coverage in Sierra Leone was reported to be highest in the survey year 2019 with a proportion of 86.4% in the northwestern while the lowest was observed in the survey year 2008 in the north. (Table 6).
Table 6 Proportion of ANC coverage at least four visits in Liberia and Sierra Leone by Subnational region (2007, 2008, 2013 and 2019)Inequality by age groupIn Nigeria, from the survey conducted in 2003 revealed a significant level of inequality between age groups. Notably, it was observed that ANC coverage was higher among individuals aged 20–49 years (D = 14.8, PAF = 5.8, and PAR = 2.7) than those 15–19 years of age. Similarly, higher ANC coverage was observed in all the survey years 2008, 2013 and 2018 among age groups 20–49. In contrast, our analysis of Chad using summary measures such as PAF and PAR revealed no observed inequality across all survey years studied, namely 1997, 2004, and 2014, as both measures were found to be zero. However, the D measure, a value of -1, -2.4, and -3.4 was identified in the respective survey years. This indicates the presence of inequality, with higher ANC coverage observed among the age group 15–19.
In Liberia, no disparities were found in ANC coverage among different age groups during the survey years of 2007 and 2013, as indicated by the summary measures of PAF and PAR. However, when considering the D measure, values of -0.4 and -1.3 were observed, suggesting a slightly higher prevalence of ANC coverage in the age group 15–19. In contrast, during the survey year 2019, inequality was observed with a D value of 1.4, PAF value of 0.3, and PAR value of 0.3, indicating a slightly higher ANC coverage among individuals aged 20–49. In Sierra Leone, the survey conducted in 2008 revealed inequality in ANC coverage, with a D = 0.5, PAF = 0.1, and PAR = 0.1. This suggests a slightly higher ANC coverage among individuals aged 20–49. However, in the survey years of 2013 and 2019, no inequalities were observed between different age groups based on the PAF and PAR measures. Nevertheless, when considering the D measure, inequalities were observed with values of -2.2 in 2013 and -3.4 in 2019, indicating a noticeable difference in ANC coverage among various age groups during those years.
Inequality by educational statusIn Nigeria, inequality was observed in all the survey years with the four summary measures D, ACI, PAF and PAR, where the highest inequality was observed in the survey year 2003 with ACI = 12.7, D = 55.6, PAF = 70 and PAR = 33.2. This indicates the existence of inequality in ANC coverage where there exists higher coverage in the group with higher educational attainment (secondary school). Likewise, in Chad, significant disparities were observed in all the survey years using various measures such as ACI, D, PAF, and PAR. The highest level of inequality was identified in the 1997 survey, with ACI = 3.9, D = 45.8, PAF = 272.8, and PAR = 41. These values indicate the existence of inequality, where ANC coverage was notably higher among individuals with secondary educational attainment.
In Liberia, a higher level of inequality was observed in all the survey years with the four inequality measures. In 2007 and 2013 (ACI = 2.8, D = 15.6, PAF = 16.9, PAR = 11.1 and ACI = 3.6, D = 15.9, PAF = 10.7, PAR = 8.4) respectively indicating higher ANC coverage in the secondary school educational attainment subgroup. In contrast, in the survey year 2019, a slightly lower level of inequality was observed when compared with the previous survey years (ACI = 1.0, D = 4.1, PAF = 2.9 and PAR = 2.5). In Sierra Leone, it was found that there was a higher level of inequality of ANC coverage in the survey years 2008 and 2019 with (ACI = 2.2, D = 14.5, PAF = 21.0, PAR = 11.8 and ACI = 1.6, D = 8.3, PAF = 8.0, PAR = 6.1) respectively, indicating higher ANC coverage in the secondary school educational attainment subgroup. However, in the survey year 2019, higher inequality was observed in the lower educational attainment subgroup with ACI = -0.6, and D = -2.9, whereas there was no inequality with the measures PAF and PAR.
Inequality by residenceIn Nigeria, inequality was observed in all the survey years with D, PAF and PAR where in 2008 and 2013, (D = 34.4, PAF = 53.6, PAR = 24.0 and D = 36.6, PAF = 45.8, PAR = 23.4. These values indicate the existence of inequality, where ANC coverage was high among those who reside in the Urban area. In Chad, inequality was observed in all the survey years from 1997 to 2014 where the highest inequality was observed in the survey year 2004 (D = 31.9, PAF = 145.7 and PAR = 25.9). These values indicate the occurrence of inequality among people residing in the urban area, which means that those residing in the urban area has high ANC coverage than that of the rural one. In Liberia, inequality existed in all the survey years but was slightly lower than in Nigeria and Chad. As indicated with the summary measures D, PAF and PAR, in the consecutive survey years, 2007, 2013 and 2019 (D = 15.2, PAF = 15.4, D = 11.3, PAF = 6.7, PAR = 5.3 and D = 4.7, PAF = 2.4, PAR = 2.1) respectively.
In Sierra Leone, higher inequality in ANC coverage was observed in the survey years 2008 and 2013, with (D = 13.7, PAF = 17.3 and D = 5.3, PAF = 5.1, PAR = 3.8) respectively. This indicates that ANC coverage was higher in urban areas than in rural areas. In contrast, slightly lower to no inequality was observed in the survey year 2019, with a (D = -10.1, PAF = 0.0, PAR = 0.0). This suggests that ANC coverage was higher among those residing in rural areas. The summary measures PAF and PAR also indicate that inequality was non-existent with place of residence in 2019.
Inequality by economic statusInequality by economic status was measured by four summary measures, named ACI, D, PAF and PAR. It was observed that inequality has existed in all survey years in Nigeria where in 2003 (ACI = 12.7, D = 64.5, PAF = 85.7, PAR = 40.6), 2008 (ACI = 13.2, D = 64.9, PAF = 79.9, PAR = 35.8), 2013(ACI = 14, D = 67.6, PAF = 67.5, PAR = 34.5) and 2018(ACI = 11.1, D = 54.7, PAF = 50.2, PAR = 28.5). This shows the existence of inequality where there is high ANC coverage among people in the highest wealth quintile (richest).
In Chad, inequality was observed in each survey years where in 1997 (ACI = 6.2, D = 34.9, PAF = 164.3 and PAR = 24.,), 2004(ACI = , D = , PAF = and PAR = ,), and 2014(ACI = , D = , PAF = and PAR = ,). This implies that there is high inequality of ANC coverage by economic status where ANC coverage is found to be higher among those who were in the richest quintile Subgroup. In Liberia, inequality was observed by Economic status in all the survey years, where the highest was reported in the survey year 2007 (ACI = 5.2, D = 23.5, PAF = 18.8, and PAR = 12.4). The lowest was reported in the survey year 2019(ACI = 1.5, D = 8.8, PAF = 4.6, PAR = 4.0). All indicating the higher ANC coverage among the richest quintile subgroup.
In Sierra Leone, higher inequality was observed in the survey years 2008 and 2013 (ACI = 3.5, D = 21.2, PAF = 24.8, PAR = 13.9) and (ACI = 1.3, D = 6.3, PAF = 5.5, PAR = 4.2), which indicates higher inequality in ANC coverage where higher ANC coverage to be found among the richest quintile. Whereas in the survey year 2019 (ACI = -2.4, D = -11.4, PAF = 0.0, PAR = 0.0), indicating higher inequality of ANC coverage with ACI and D, where ANC coverage is found to be higher among the poorest quintile subgroup. On the other hand, PAF and PAR inequality measures showed no inequality among subgroups.
Inequality by subnational regionIn Nigeria, based on the summary measures of PAF and PAR in the survey year 2003(PAF = 95.7, PAR = 45.4), there is higher inequality in ANC coverage by the Subnational region. This indicates that there was higher ANC coverage in the southwestern region whereas the lowest coverage is in the north western region. In the survey years 2008, 2013 and 2018, the Southwestern region was mainly the one with the highest ANC coverage 2008(D = 60.1, PAF = 80.0, PAR = 34.9), 2013 (D = 56.6, PAF = 70.1, PAR = 35.8) and 2018 (D = 42.0, PAF = 48.2, PAR = 27.4); whereas the northwestern was the one with the lowest in all the survey years. In Chad, inequality was observed by subnational regions in all the survey years with (D = 44.0, PAF = 198.3, PAR = 29.9) in 1997 where biltine was the region with the lowest and ANC coverage while n'djamena was the one with the highest ANC coverage, (D = 55.0, PAF = 224.9, PAR = 40.0) in 2004 where ouaddai est was the one with the lowest while n'djamena was the one with the highest ANC coverage and (D = 45.9, PAF = 86.8, PAR = 26.9) in 2014 where wadi fira to be the region with the lowest coverage while n'djamena is the highest. In Liberia, higher inequality was observed in all the survey years by subnational region, 2007 (D = 24.6, PAF = 15.0, PAR = 9.9), 2013 (D = 21.8, PAF = 4.4, PAR = 3.4) and 2019(D = 7.1, PAF = 3.1, PAR = 2.7). The highest coverage is reported in Monrovia in 2007, south-central in 2013 and north-central in 2019. In Sierra Leonne, higher inequality by subnational region was observed in 2008,2013 and 2019 (D = 20.0, PAF = 23.6, PAR = 13.2), (D = 7.2, PAF = 5.8, PAR = 4.4) and (D = 27.0, PAF = 9.7, PAR = 7.7) respectively. The highest coverage was reported in the west in the survey year 2008, while the lowest was in the north. Whereas in the survey year 2013, the highest coverage was reported in the south, while the lowest was in the east. On the other hand, in the 2019 survey year, the highest coverage was observed in the northwestern, while the lowest was in the west.
Intra-national inequality of ANC coverageWhen we compare inequality in ANC coverage with Age, Nigeria showed the highest inequality with all the summary measures followed by Libera: D, PAF and PAR. Whereas Chad and Sierra Leonne exhibited slightly higher inequality with a high ANC coverage in the age group 15–19, with summary measure D and inequality was reported to be non-existent with PAF as well as PAR for these countries.
Nigeria also showed the highest inequality of ANC coverage by Economic status with summary measures ACI, D and PAR, while Chad exhibited the highest inequality with the summary measure PAF followed by Liberia. Sierra Leone showed higher ANC coverage in the poorest quintile status while the rest reported higher coverage in the richest wealth quintile. When we compare inequality by Education, Nigeria exhibited the highest inequality by the summary measures ACI and D where the ANC coverage was concentrated among educated, while Chad exhibited the highest inequality by summary measures PAF and PAR followed by Liberia. Whereas, Sierra Leonne reported a slightly higher ANC coverage among those with no formal education while the rest reported higher ANC coverage among those with Secondary school and above. Further, summary measures of PAF and PAR showed no inequality.
When we compare inequality with place of residence, Nigeria showed higher inequality favoring the urban residing community with summary measure D, while Chad exhibited higher inequality with the summary measures PAF and PAR followed by Nigeria and Liberia. Sierra Leonne further showed higher inequality with D among those residing in the rural areas and no inequality by residence with summary measures PAF and PAR. When we compare inequality by subnational region, Chad exhibited the highest inequality compared with Nigeria, Liberia and that of Sierra Leonne with summary measures D, PAF and PAR. Nigeria took the second place with the highest inequality while Sierra Leonne and Liberia took the third and fourth place, with all showing higher coverage (Table 7).
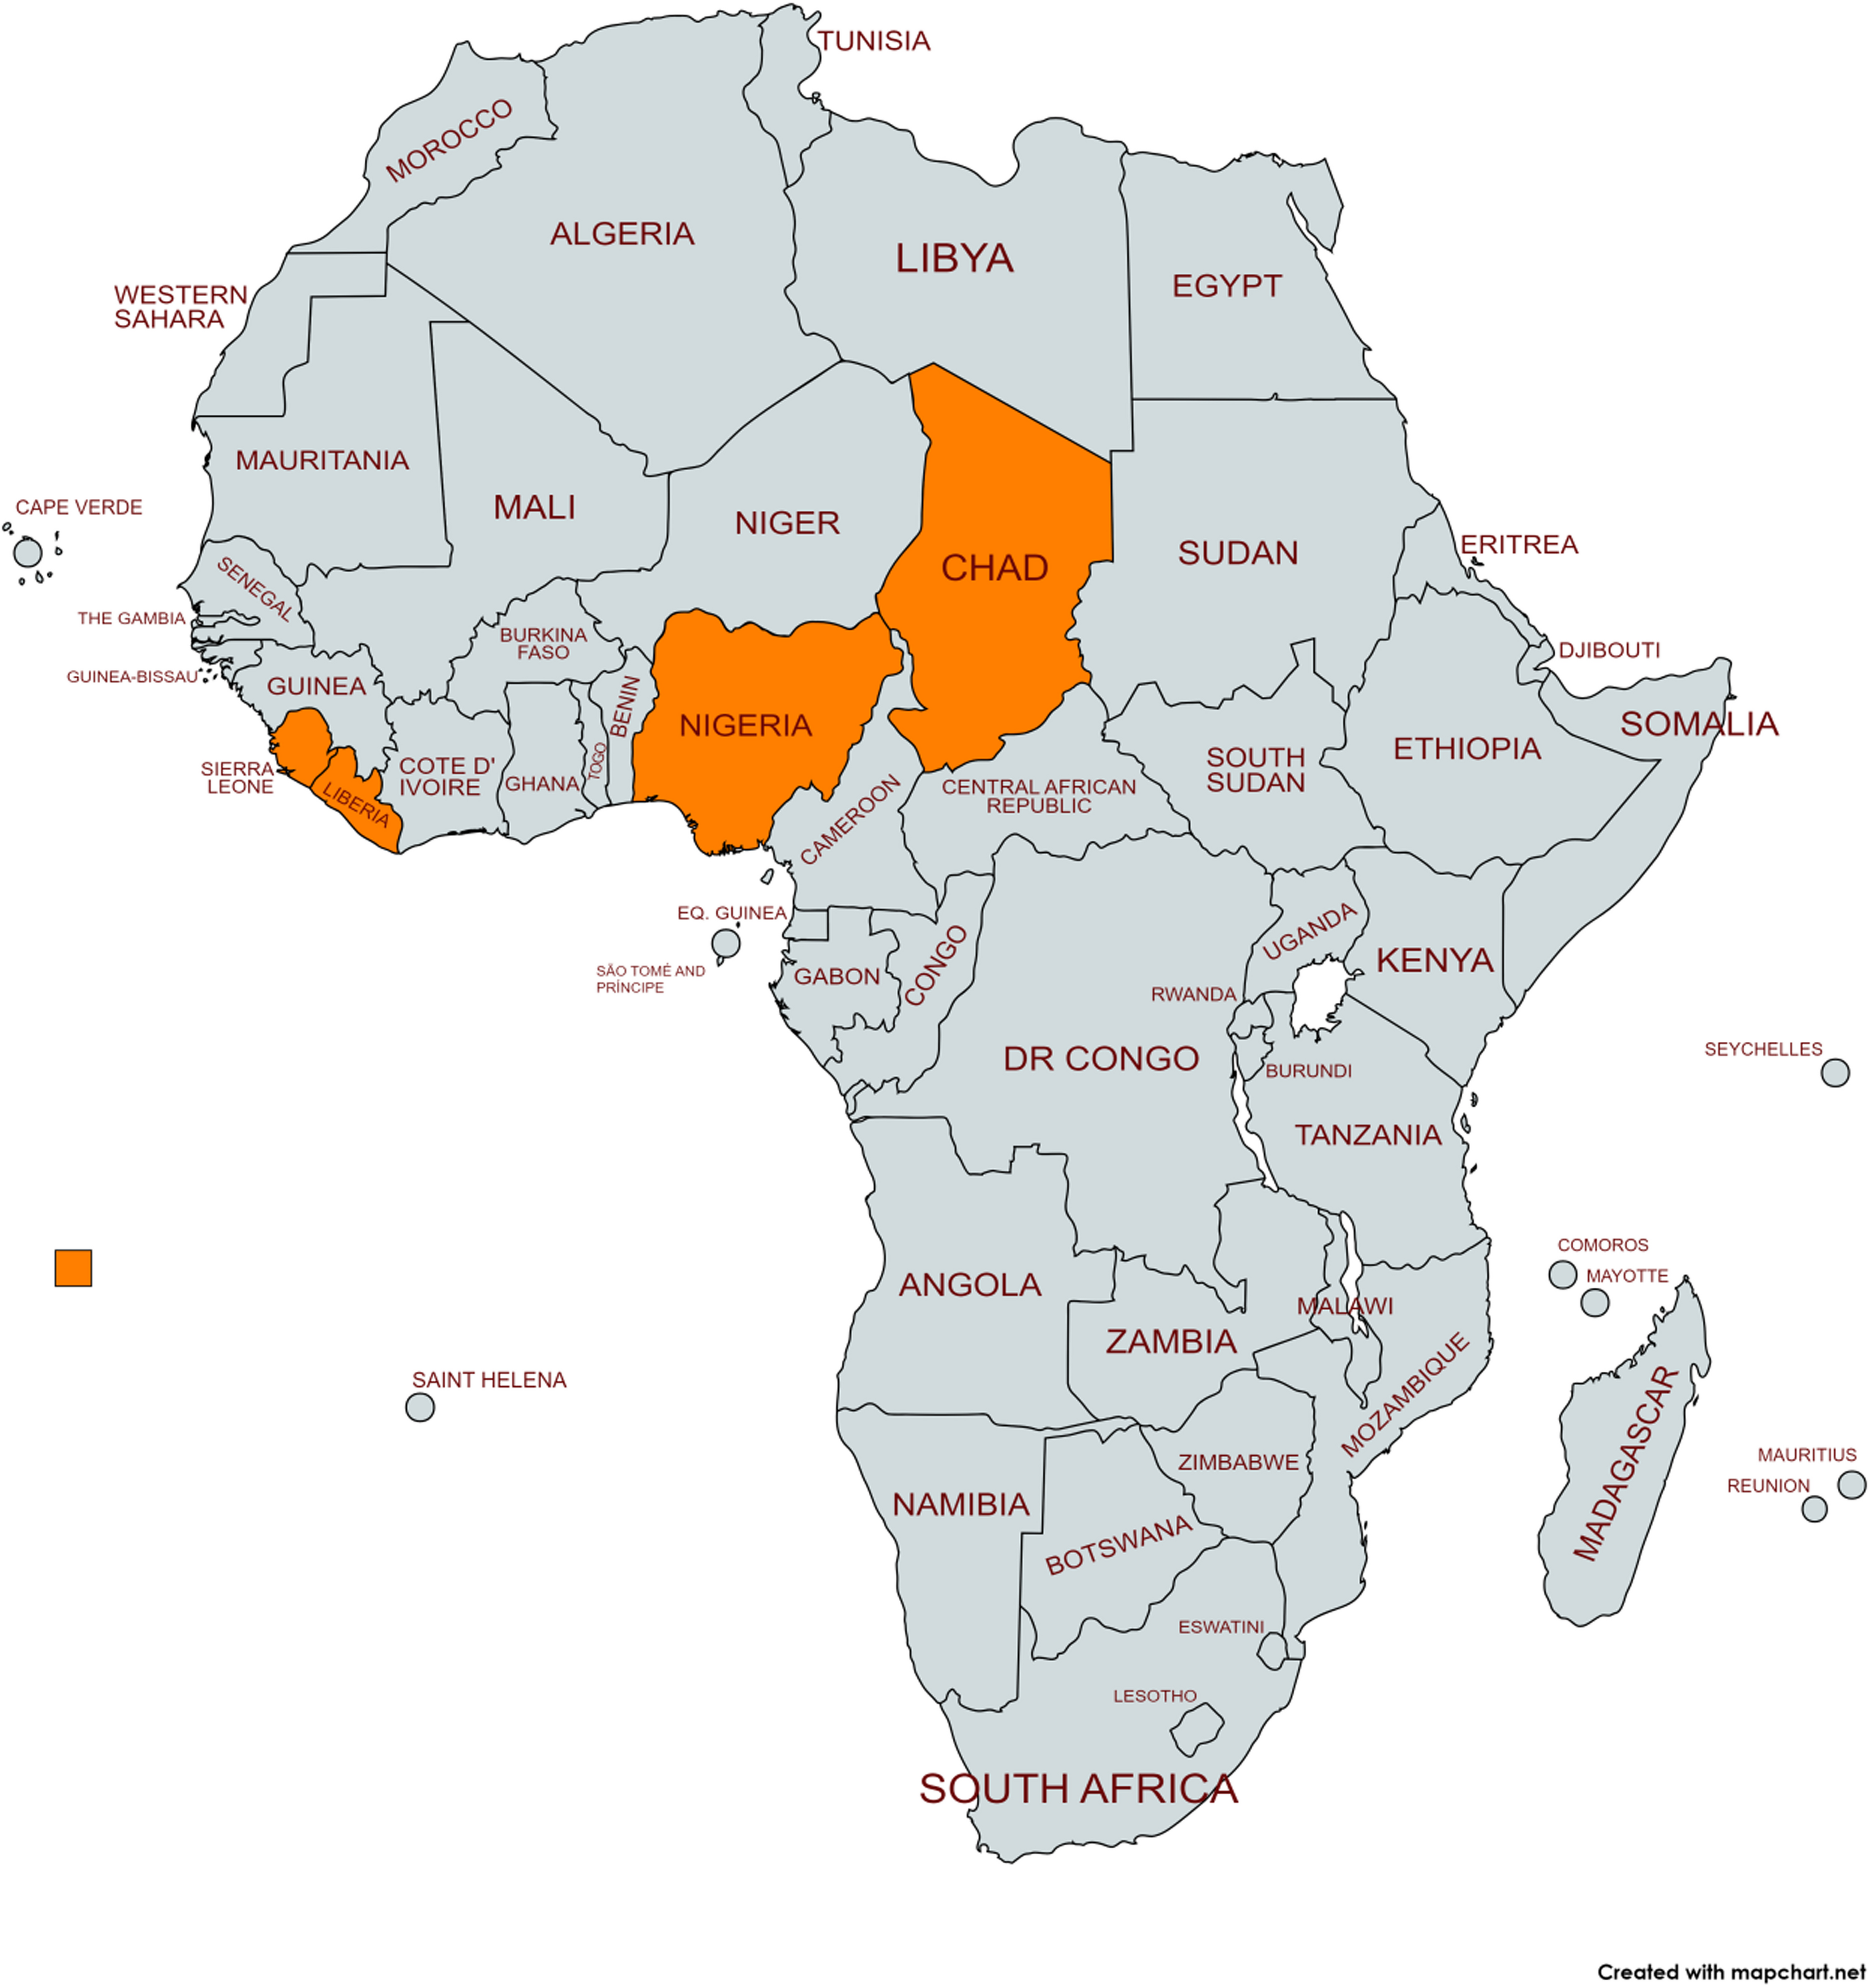
Table 7 Intra-nation ANC coverage with five Dimensions of four countries with the highest maternal mortality in Africa
留言 (0)