
記住我


The 134 OXPHOS-related genes were obtained from the Oxidative phosphorylation pathway in KEGG sets. We performed univariate Cox regression analysis based on these 134 genes and screened out 42 oxidative phosphorylation (OXPHOS)-genes with prognostic significance (Figure S1, p value < 0.05), in which 38 genes (NDUFB1, NDUFB8, CYC1, etc.) presented poor prognostic role in UVM (Hazar Ratio, HR > 1). It suggests the high expression of these genes is associated with high risk.
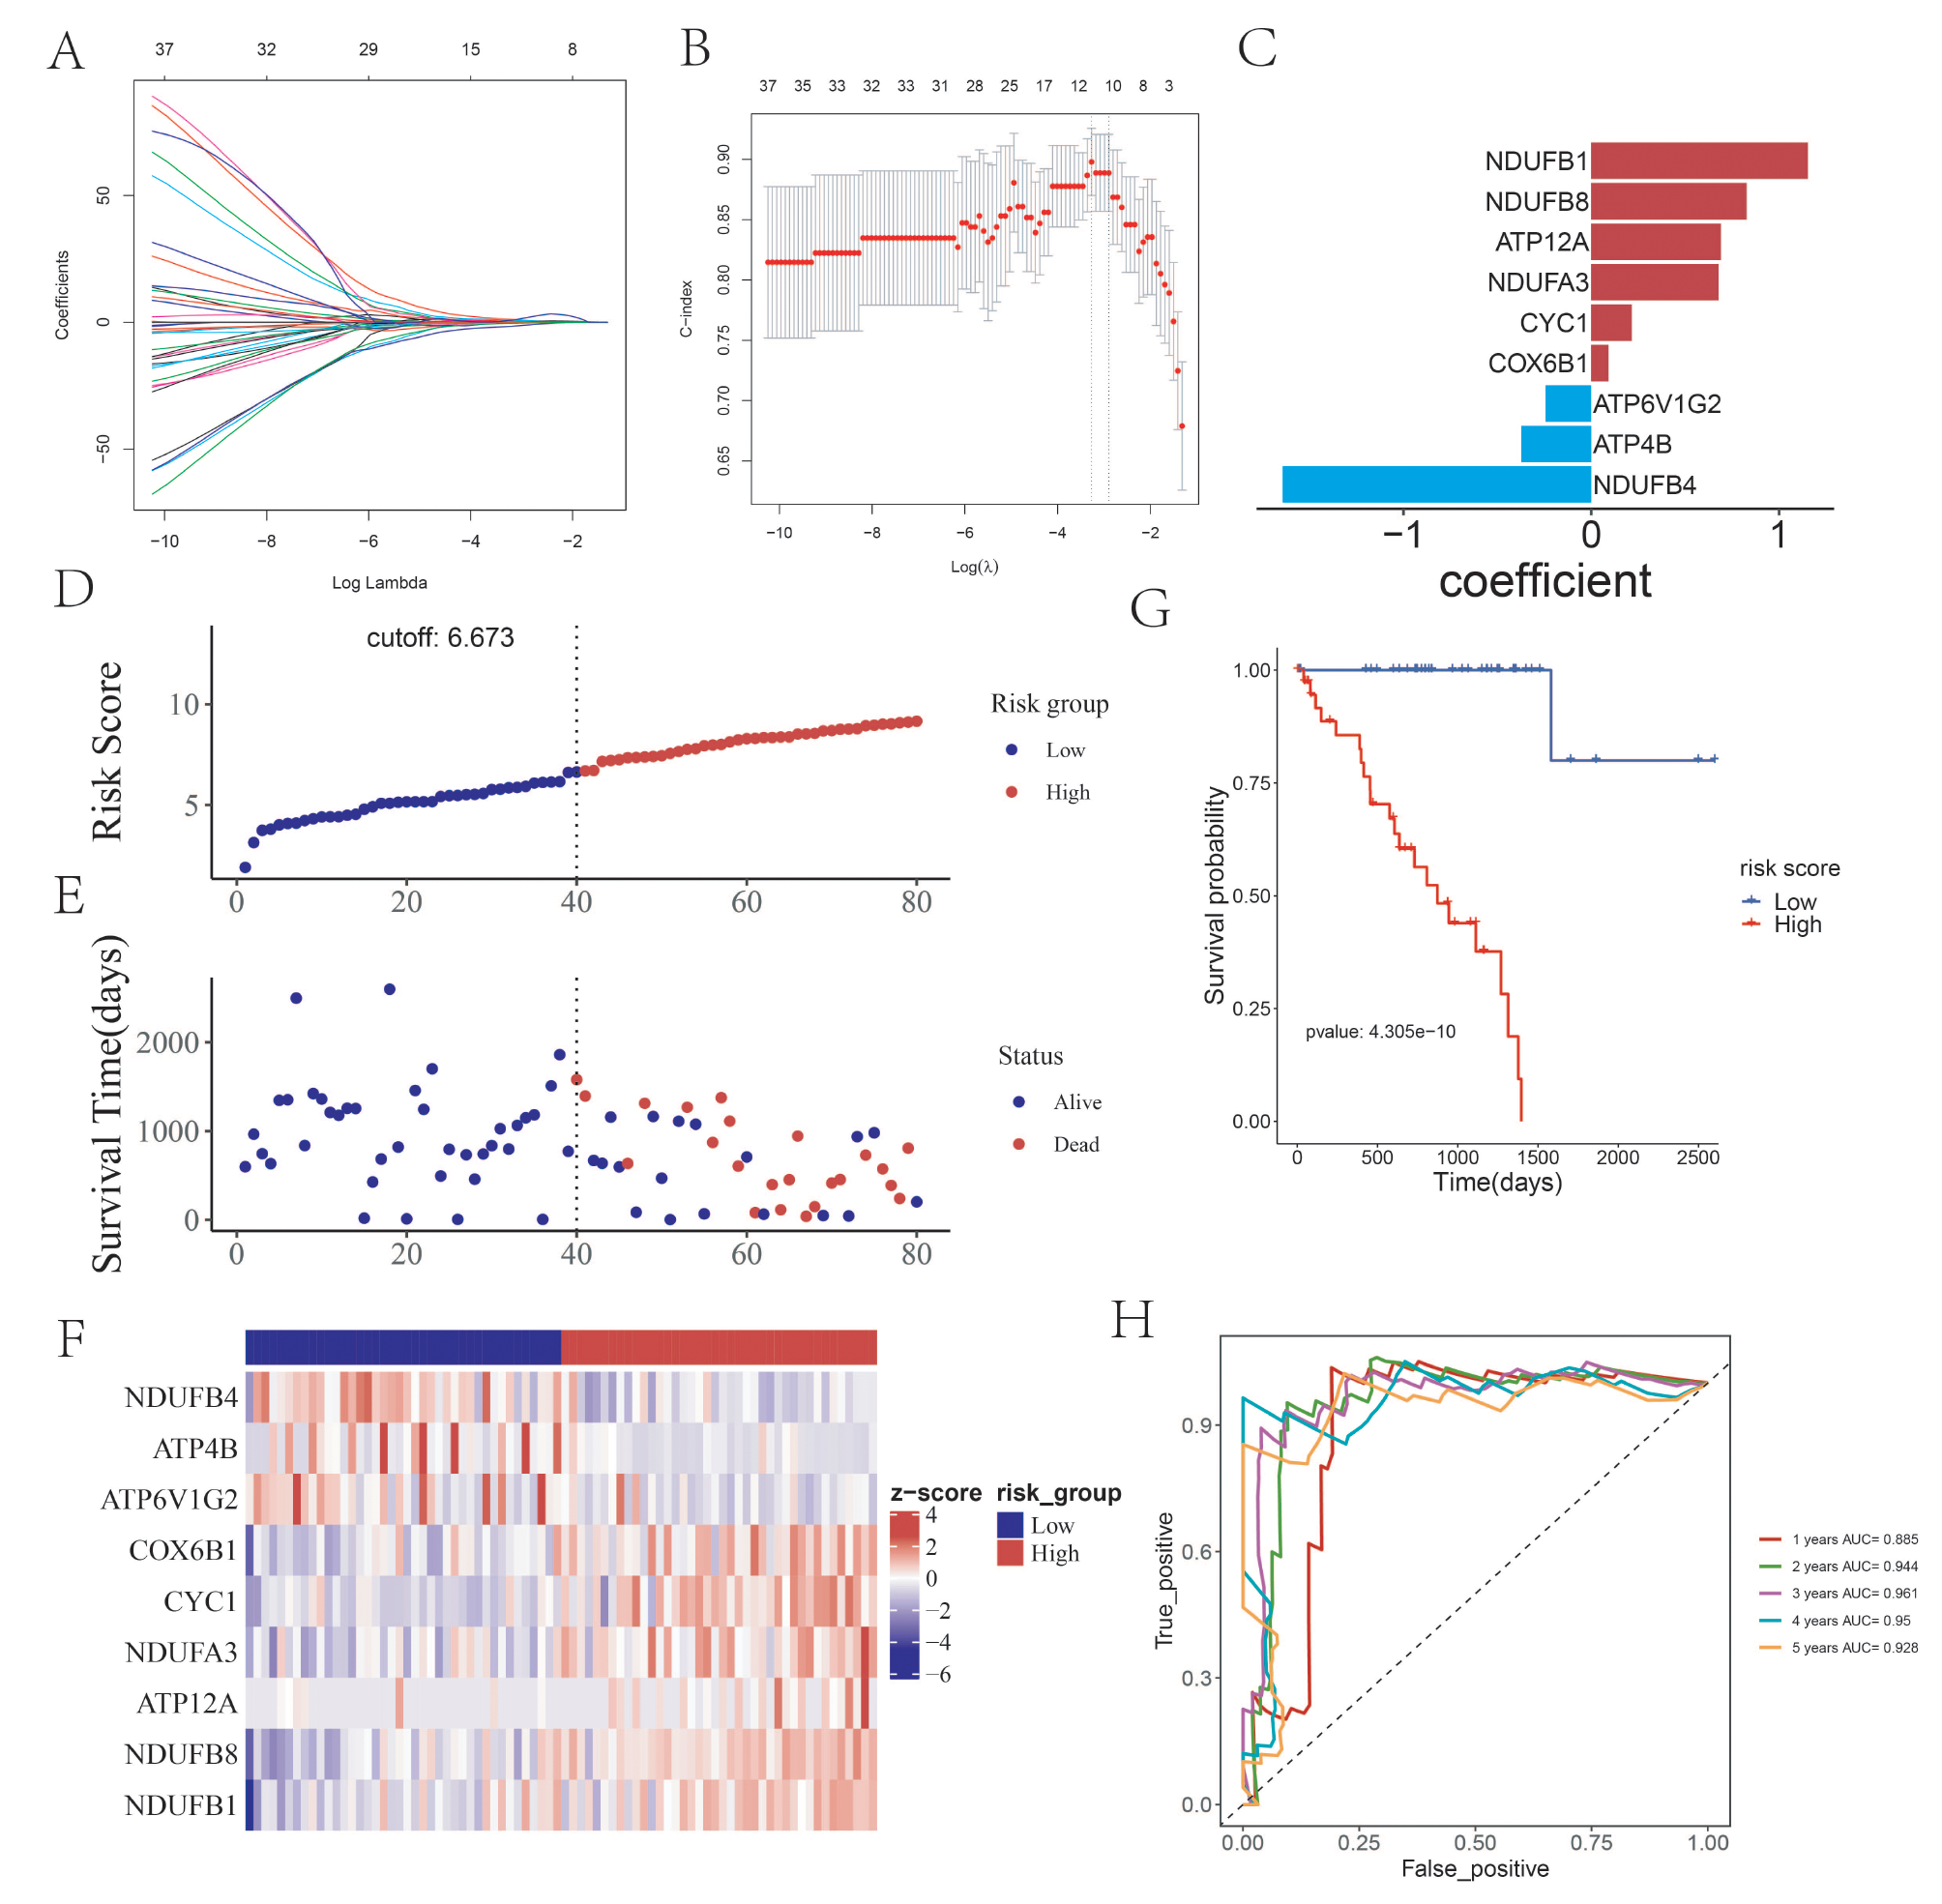
Construction and evaluation of prognostic risk score modelThe lasso regression analysis could be used to reduce the overfitting of the data and minimize the λ Value as the best reference value to screen genes that are more critical to prognosis. In the next step, the lasso regression analysis was performed based on the above 42 genes through the “glmnet” and “survival” R package (Fig. 1A-B). A total of 9 more stable OXPHOS-related prognostic genes were identified, which including NDUFB1 (Coef = 1.153), NDUFB8 (Coef = 0.8266), ATP12A (Coef = 0.6900), NDUFA3 (Coef = 0.6783), CYC1(Coef = 0.2152), COX6B1(Coef = 0.09137), ATP6V1G2 (Coef=-0.2422), ATP4B (Coef=-0.3718) and NDUFB4 (Coef=-1.6423) (Fig. 1C). Survival analysis was performed for 9 genes in the prognostic risk model constructed in this study in the TCGA UVM database according to the median grouping. The Kaplan-Meier survival analysis of the 9 OXPHOS-related signature genes were shown in Figure S2. NDUFB4, ATP4B and ATP6V1G2 were associated with better prognosis and survival of UVM, while NDUFB1, NDUFB8, ATP12A, NDUFA3, CYC1, COX6B1were associated with poor prognosis and survival of UVM.
Fig. 1
Construction of prognostic risk score model of the Oxidative phosphorylation (OXPHOS)-related genes based on the TCGA database. (A-B) LASSO regression analysis. (C) The coefficient of 9 identified genes, including NDUFB1, NDUFB8, ATP12A, NDUFA3, CYC1, COX6B1, ATP6V1G2, ATP4B and NDUFB4. (D) The risk score curve of the samples in high-risk group and low-risk group. The cutoff value is 6.637. (E) The survival status chart; of samples in high-risk group and low-risk group. (F) The heatmap showing the expression level of the 9 OXPHOS-related signature genes (G) The Kaplan-Meier survival curve of high-risk group and low-risk group. (H) The one to five-year time ROC curve of risk score in the TCGA training set
The prognostic risk model of UVM was constructed based on the 9 OXPHOS-related prognostic genes. At the same time, the risk value of each sample was calculated, and the median of the risk score was taken as the cutoff value (cutoff value = 6.673), which was divided into high-risk group and low-risk group (Fig. 1D and E). The probability distribution diagram of risk score and the heat map of 9 OXPHOS-related prognostic genes expression in high and low-risk groups were also presented (Fig. 1F).
The prediction ability of the prognostic risk score model was evaluated by Kaplan-Meier survival analysis and ROC curve. The results showed that the prognosis of patients in the high-risk group was poor, and the difference was statistically significant (Fig. 1G, p = 4.305e-10). Besides, the ROC curve demonstrated that the area under the curve of the model for predicting the 1 to 5-year survival rate of UVM patients were all more than 0.88 (AUC = 0.885, 0.944, 0.961,0.95 and 0.927, respectively), which revealed the accuracy of the model (Fig. 1H).
Performance evaluation of prognostic risk score model in GSE22138 and GSE39717 datasetsIn the next step, we evaluated the performance of prognostic risk score model in GSE22138 dataset. According to multivariate Cox regression analysis, a risk score was calculated for each patient using the 9 OXPHOS-related prognostic genes, and the cutoff value separating high-risk and low-risk groups was set at the median (16.213) (Fig. 2A). The expression trend of the 9 OXPHOS-related prognostic genes in high and low risk groups was consistent with the TCGA train set (Fig. 2B). The prediction performance of six genes was evaluated by using the time-dependent ROC curve for GSE22138. As seen in Fig. 2C. The higher the AUC, the better the model performance. The AUC of the external data set was slightly lower than that of the TCGA data sets. Kaplan-Meier survival curves showed significant differences between groups, the prognosis of high-risk group was significantly lower than those of the low-risk group (Fig. 2D). External validation revealed that these 9 genes could also be used to evaluate and predict the overall survival of patients with UVM.
Fig. 2
Performance evaluation of prognostic risk score model in external validation sets GSE22138. (A) The risk score of the samples in high-risk group and low-risk group. (B) The heatmap showing the expression level of the 9 OXPHOS-related signature genes. (C) The Kaplan-Meier survival curve of high-risk group and low-risk group. (D) The one to five-year Time ROC curve
Further, we evaluated the performance of prognostic risk score model in GSE39717 dataset. According to multivariate Cox regression analysis, a risk score was calculated for each patient using the 9 OXPHOS-related prognostic genes, and the cutoff value separating high-risk and low risk groups was set at the median (14.598) (Figure S3A). The expression trend of the 9 OXPHOS -related prognostic genes in high and low risk groups was consistent with the TCGA train set (Figure S3A). To explore the predictive value of the signature, the Kaplan-Meier survival curves were analyzed. UVM patients of high-risk group has shorter OS (Figure S3B). The prediction performance of six genes was evaluated by using the time-dependent ROC curve for GSE39717. ROC analysis confirmed that the area under curve (AUC) was 0.653 at 1 years, 0.834 at 2 years, 0.742 at 3 years, 0.772 at 4years, and 0.653 at 5 years, respectively (Figure S3C). AUC values were more than 0.5 regardless of the predicted survival time at 1, 2, 3, 4, 5-year survival in the GSE39717 dataset.
The risk score levels were associated with immune cell frequency and specific genomic alterationsWe next analyzed the immune cell frequency in samples and low- and high-risk group through Cibersort. As presented in Fig. 3A and B, the frequency of different immune cell types in each sample were presented, in which we found that Macrophages M2, Mast cells resting, T cell CD8, plasma cell and T cells CD4 memory resting were occupied most of the frequency. What’s more, the T cell CD8, T cells CD4 memory resting, T cell follicular helper, T cell regulatory Treg, Monocytes, Macrophages M1 Dendritic cells resting and Dendritic cells active were significantly expressed differently between the high- and low risk group (Fig. 3C).
Fig. 3
The immune cell frequency in samples and low- and high-risk group. (A) The cell frequency of immune cell in all samples. (B) The heatmap showing the relative expression level of samples in low- and high-risk in immune cell. (C) The cell frequency of immune cell between the low- and high-risk group
To investigate the association of risk score level and specific genomic mutational signatures, the somatic mutational assays was conducted based on the TCGA information. Next, we conducted general analysis of the somatic mutation frequency in these 40 low/high risk UVMs, the result showed a relatively high mutation frequency in UVM samples (Fig. 4A and B). In detail, 40(100%) UVM samples had mutations in UVM of high/low risk groups. Bioinformatics of somatic mutation profiles based on risk score levels showed the increased frequencies of mutations in GNA11 (57%), BAP1 (48%), and GNAQ (32%) in the high-risk group (n = 40), while GNAQ (68%), SF3B1 (40%), GNA11 (30%), and EIF1AX (25%) were more frequently mutated in the low-risk group (n = 40) (Fig. 4A and B).
Fig. 4
Genomic alterations in score-low versus score-high clusters. (A-B) Themaftool exhibited incidence of somatic mutations of UVMs in 40 UVM patients from of the high-risk group (A) and low-risk group cluster (B)
The DEGs between the low- and high- risk group were enriched in tumor OXPHOS and immune related pathwayTo explore the underlying molecular mechanism, we sequentially identified the DEGs between low- and high- risk group. As seen in Figs. 5A and B and 4566 DEGs were screened out, which included 2400 up-regulated DEGs and 2166 down-regulated DEGs. Thereafter, the GO and GSEA enrichment analysis were carried out. As seen in Fig. 6A, the DEGs were enriched in biology process of cell − cell adhesion, regulation of lymphocyte and T cell activation, cell component of T cell receptor complex. The GESA analysis of HALLMARK presented that the DEGs were enriched in reactive oxygen species pathway, IL6-JAK-STAT3, KRAS, TNFA- NFKB, NOTCH, P53, and MTORC1 signaling (Fig. 6B). Besides, in the GSEA analysis of the KEGG pathway, the DEGs were enriched in oxidative phosphorylation, natural killer cell mediated cytotoxicity, leukocyte transendothelial migration, T cell receptor signaling pathway, etc. (Fig. 6C).
Fig. 5
The differential expressed genes (DEGs) between the high-risk group and low-risk group. (A) The heatmap showing the expression level of DEGs. The screening criteria is|log2FC| > = 1 and p. adjust < = 0.05. (B) The volcano plot presented the DEGs, the red dots indicated up-regulated DEGs and blue dots indicated down-regulated DEGs
Fig. 6
The functional enrichment analysis of DEGs between the low- and high-risk group. (A) The Gene Ontology (GO) functional enrichment of DEGs, which included the Biological Process (BP), Cell Component (CC), Molecular Function (MF). (B-C) The Gene set enrichment analysis (GSEA) of DEGs based on HALLMARK pathways set (B) and KEGG set (C)
Knockdown of CYC1 inhibited cell proliferation, invasion and induced cell apoptosis in UVM cellscBioPortal shown that the copy number alteration (CNA) of 9 OXPHOS related genes in UVM. The amplification and CAN frequency of CYC1 (57%), ATP6V1G2 (10%), ATP4B(6%), ATP12A(6%), NDUFA3(5%), NDUFB8(5%), NDUFB1 (4%), COX6B1 (2.5%), CYC1 amplification was most significant (Fig. 7A). The role of CYC1 in UVM cells is still unclear. We investigated the role of CYC1 in UVM MUM-2 C cells. First, RT-qPCR assays showed that CYC1 expression was significantly reduced in si-CYC1 group (Fig. 7B). Knockdown of CYC1 inhibited the proliferation of MUM-2 C cell lines, as shown by the CCK-8 assay (Fig. 7C). Colon formation assay results shown that knockdown of CYC1 decreased the cell growth number of MUM-2 C cell lines (Fig. 7D). Next, we analyzed the effect of CYC1 on the apoptosis of MUM-2 C cell lines using flow cytometry. We found that knockdown of CYC1 increased the cell apoptotic rates (Fig. 7E and F). In addition, transwell assay revealed that cell invasion was reduced in the si-CYC1 group compared with the control group (Fig. 7G and H). Collectively, these results suggested that knockdown of CYC1 inhibited cell proliferation, invasion and promoted cell apoptosis in UVM cells.
Fig. 7
Effects of CYC1 on the proliferation, invasion and apoptosis of MUM-2 C cells in vitro. (A) The copy number alteration frequency of OXPHOS related genes in UVM. (B) CYC1 expression was analyzed by RT-qPCR assay. (C) CCK-8 assay detected the MUM-2 C cells proliferation. (D) Colon formation assay was used to detected cell growth number of MUM-2 C cells. (E) Glow cytometry assay was used to detect the apoptosis of MUM-2 C cell lines. (F) Cell apoptosis rate was calculated. (G) Transwell assay was performed to explore the invasion of MUM-2 C cell. (H) Cell invasion number was calculated. Data are represented as mean ± SD. * P < 0.05, ** P < 0.01, ***P < 0.001
留言 (0)