
記住我


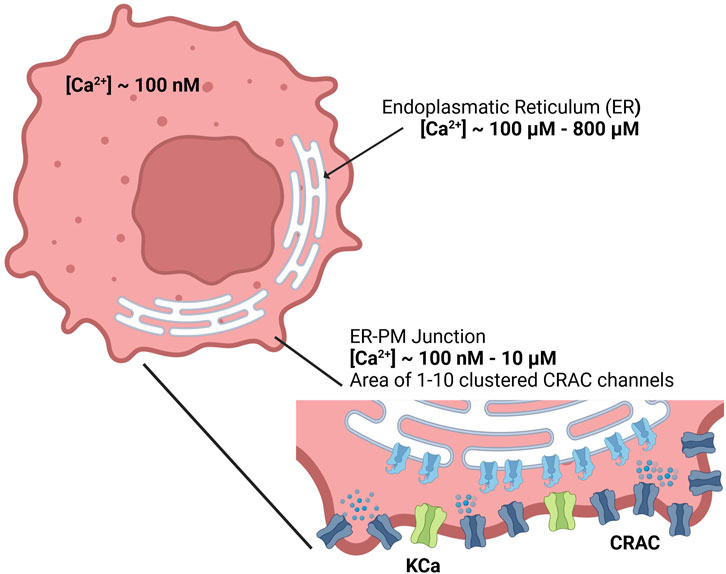
Ion transport across the cell and intracellular membranes through channels and carriers is involved in the regulation of survival, proliferation, death, and motility of cancer cells. Ca2+ ions play a fundamental role in a variety of intracellular signaling pathways that regulate cell proliferation, metabolism, excitability and contractability, exocytosis, gene transcription and expression. At rest, the cytosolic Ca2+ concentration [Ca2+]Cyt is typically maintained low at around 100 nM, compared with the extracellular space with [Ca2+]Ext > 1 mM and intracellular Ca2+ stores, such as the endoplasmic reticulum (ER) with [Ca2+]ER > 100 µM (Bong and Monteith, 2018). A significant portion of intracellular Ca2+ is not free but is bound to numerous calcium binding proteins that can function as Ca2+ sensors, Ca2+ buffers or both. Some of the important Ca2+ buffers include calmodulin (CaM) in the cytosol, and calsequestrin (CSQ) and calreticulin in the ER (Islam, 2020).
In the context of the cell cycle, Ca2+ is crucial for regulating important steps such as DNA synthesis, cell cycle checkpoints, and phase transitions. During the G1 phase, for example, it modulates the transcription of immediate early genes necessary for cell proliferation and activates the cyclin-dependent protein kinases (CDKs) in association with their regulators, the cyclins, which, after a series of intermediate reactions, allow the transition from cell cycle phase G1 to S (Humeau et al., 2018). Therefore, maintaining balanced Ca2+ levels within intracellular compartments is crucial for the proper cell function and life cycle (Roderick and Cook, 2008). To enable controlled Ca2+ entry and release, each cell has a unique expression pattern of calcium regulating agents that determine its calcium homeostasis (Islam, 2020). The main players in calcium signaling include ion channels, which act as gatekeepers for Ca2+ entry into cells and regulate calcium exchange in different compartments. While voltage-gated calcium channels are a characteristic feature of excitable cells, ligand-gated calcium channels occur predominantly in non-excitable cells (Kozak and Putney, 2018). Store-operated calcium entry (SOCE) is one of the most important calcium entry pathways in non-excitable cells, and shows distinct behavior throughout the cell cycle. Exemplarily it is upregulated in G1/S transition and downregulated from S to G2/M phase (Chen et al., 2016; Hodeify et al., 2018). Although the molecular mechanism is not yet fully understood in detail (Islam, 2020), Ca2+ depletion from the endoplasmic reticulum (ER), induced by inositol 1,4,5 trisphosphate receptor (IP3R) and ryanodine receptor (RyR), triggers the SOCE mechanism to replenish the ER with Ca2+ and maintain Ca2+ signaling in the cytoplasm (Hogan, 2015). The two major SOCE proteins are the calcium-sensitive Stromal Interaction Molecule 1 (STIM1) on the ER membrane and the ORAI1 channel pore on the plasma membrane (PM) (Zheng et al., 2015), which together form the calcium release activated calcium (CRAC) channels that regulate Ca2+ influx across the PM into the cytosol. Incoming Ca2+ via CRAC channels binds to calmodulin to regulate downstream expression of cytokines, transcription factors, and enzymes, which in turn govern proliferation, differentiation, metabolism, mast cell degranulation or cytotoxicity (Hodeify et al., 2018; Vaeth and Feske, 2018). Other imported channels in Ca2+ exchange are the sarco/endoplasmic reticulum Ca2+ ATPase (SERCA) and the plasma membrane Ca2+ ATPase (PMCA), which pump Ca2+ from the cytoplasm into the ER and the extracellular space respectively (Liu, 2012; Liu, 2012).
Cancer cells exhibit altered ion channel expression or activity, which is closely linked to tumor development and progression (Kunzelmann, 2005; Schönherr, 2005; Fiske et al., 2006; Litan and Langhans, 2015; Brackenbury, 2016; Leanza et al., 2016). In particular, calcium channels involving ORAI and STIM, transient receptor potential (TRP) channels, as well as voltage-gated calcium (CaV) channels are reported to promote proliferation in various cancer types, for example the upregulated expression of ORAI3 and TRPV6 channels are known to enhance proliferation rates in prostate or breast cancer (Pinto et al., 2015; Dubois et al., 2014; Lehen’Kyi et al., 2007). Furthermore, cancer hallmarks such as self-sufficiency in growth signals is highly associated with calcium signaling and upregulation of various calcium channels, whereas reduction of calcium influx by downregulation of calcium channels has been shown to result in insensitivity to antigrowth signals and some resistance to apoptosis (Brackenbury, 2016; Lehen’Kyi et al., 2007; Prevarskaya et al., 2010; Raphaël et al., 2014; Thebault et al., 2006). Changes in ion channel expression consequently affect the membrane potential of the cell, which represents an important bioelectric signal for cell proliferation. In general, proliferating cells often have a more depolarized membrane potential Vm than quiescent cells. As reported in several studies, cells can be induced to enter or exit the cell cycle by external hyper- or depolarization of the membrane, respectively. For example, lowering the membrane potential of proliferating CHO cells has been shown to induce mitotic blockade, while depolarization of quiescent CHO cells can trigger mitosis. Similarly, sustained depolarization initiates DNA synthesis and mitosis in mature neurons, emphasizing Vm as a crucial regulator for the mitotic ability of cells (Cone and Tongier, 1971; Stillwell et al., 1973; Cone and Cone, 1976; Yang and Brackenbury, 2013; Rao et al., 2015). In fact, compared with normal cells, cancer cells typically tend to be more depolarized, which is assumed to trigger DNA-synthesis and mitosis, leading to increased proliferation. Furthermore, during cell cycle progression, the membrane potential undergoes rhythmic oscillations from hyperpolarized to depolarized states, which can trigger the transition and drive cells through the different cell cycle phases, thus serving as a putative bioelectric signal for cell proliferation (Yang and Brackenbury, 2013).
Recent advances in the field of cancer research have focused on targeting specific ion channels involved in tumor development and progression, which opens up promising therapeutic opportunities based on the unique electric properties of cancer cells. However, the intricate and multifaceted nature of the underlying mechanisms, ion channel activation and interactions, and its consequences for membrane potential necessitates a comprehensive and holistic perspective to effectively identify and explore potential key targets. To gain deeper insights into the complex relationship between electrophysiological properties and cancer, in silico models can be a valuable tool to study and understand the impact of altered ion channel expression and abnormal changes in membrane potentials on malignant processes (Langthaler et al., 2021; Baumgartner, 2022). In 2021 we developed the first in silico cell model in cancer electrophysiology using A549 human lung adenocarcinoma cells (Langthaler et al., 2021). This first hidden Markov-based model simulates the rhythmic oscillation of the membrane potential during the cell cycle, allowing a deeper understanding of the electrophysiological mechanisms during cell proliferation. Currently, the model incorporates 11 functionally expressed ion channels of the PM with the respective calcium and voltage dependencies of the individual ion channels. As far as calcium modeling is concerned, the estimation of the calcium concentration in the initial model is based on a simplified approach that assumes a certain steady-state concentration of the cytosol, without taking into account the complex local calcium dynamics within the cell. However, the local calcium distribution and time evolution in the different compartments of the cell are of great importance for the activity of certain types of ion channels and subsequently affect the overall electrical properties of the cell membrane.
In this work, building upon the initial model, we propose an extension that takes into account the complex dynamics of intracellular calcium. For this purpose, the initial model is extended by a multicompartmental approach that addresses the heterogenous calcium profile and dynamics in the ER-PM junction caused by local Ca2+ entry via SOCE and uptake by SERCA pumps. Changes in cytosolic calcium levels due to diffusion from the ER-PM junction, release from the ER by RyR channels and IP3 receptors, and responding PM channels are implemented and the dynamics are assessed using literature and experimental data published elsewhere. The aim of this extension is to establish a comprehensive framework that elucidates the complex interplay between ion channels, intracellular calcium dynamics and electrophysiological processes in non-excitable cancer cells in order to gain a deeper understanding of cell proliferation mechanisms and potentially contribute to the discovery of new therapeutic strategies for cancer treatment.
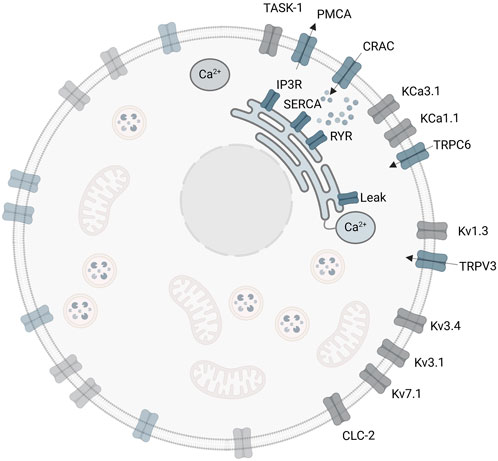
2 Materials and MethodsThe initial A549 in silico model involves three ligand-gated Ca2+ channels of the plasma membrane, the CRACM1, TRPV3 and TRPC6 (Langthaler et al., 2021). These channels enable the Ca2+ influx from the extracellular space into the cytosol. However, there are additional important channels and ion pumps including the sarco/endoplasmic reticulum Ca2+ ATPase (SERCA), which pumps Ca2+ ions from the cytosol into the ER, the plasma membrane Ca2+ ATPase (PMCA), which pumps Ca2+ out of the cell to the extracellular space, the inositol 1,4,5 trisphosphate receptor (IP3R) and the ryanodine receptor (RyR), both releasing Ca2+ from the ER into the cytosol (Liu, 2012), which have not yet been considered in the model. A summary of reported ion channels in the human lung cancer cell line A549, the role and function of the individual ion channels and their impact on electrophysiological properties, and relevance on cell proliferation and tumor progression in A549 cells are provided in the Supplementary Material Part A.
There is a large variety of published models that describe the store-operated calcium entry (SOCE) and calcium dynamics of the ER-PM junction (Kowalewski et al., 2006; Means et al., 2006; Marhl et al., 2008; Liu, 2012; Schmeitz et al., 2013; Eichinger et al., 2018; McIvor et al., 2018), all following the same basic principle of the law of mass balance. The Ca2+-submodel added to the A549 cell model is largely based on the SOCE model described in Liu, 2012.
2.1 The SOCE modelA depiction of the cell and corresponding calcium levels is given in Figure 1. The gating of the CRAC channels and to some extent the pump rate of the SERCA pumps depend on the calcium concentration inside the ER (Liu et al., 2010). The ER in turn is influenced by calcium entry through SERCA pumps, with which the cytosolic calcium concentration changes dynamically and which thus needs a separate description (Schmeitz et al., 2013). Taking the ER-PM junction into account, this results in three necessary calcium domains for a reliable model description. However, a real cell also contains additional important calcium pools such as the mitochondria or lysosomes, which are not considered at this level of abstraction. Additionally, the CRAC current in the SOCE model is assumed to be the only calcium influx into the cell, which however leaves out other calcium channels such as the TRP channels. The calcium pools are designed by the law of mass balance (Liu, 2012) which defines them by the sum of the calcium in- and outflows. All included calcium pools and flows as considered in this modeling approach are summarized in Figure 2.
Figure 1. Calcium concentrations of the cytosol, endoplasmic reticulum and the ER-PM junction inside the cell.
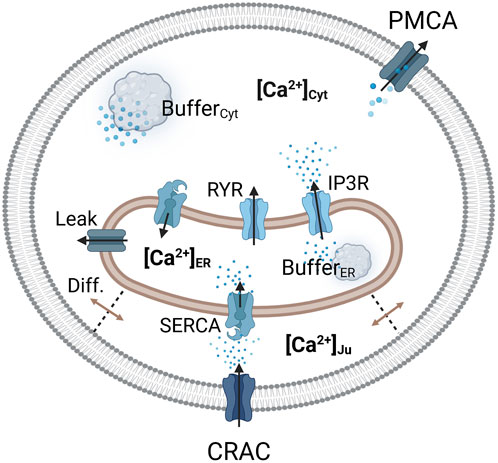
Figure 2. Visualization of the considered Ca2+ compartments and their connections in the SOCE model concept. The CRAC channel is formed by the ORAI1 channel on the PM and STIM1 on the ER membrane.
Calcium enters the cytosol by diffusion from the junction, from the ER via the RyR and IP3R channels, and through an ER calcium leakage. The cytosol is cleared of calcium via the PMCA and the SERCA pumps, which are located in the plasma and ER membrane, respectively. The ER is filled with calcium via SERCA pumps, which are active in the junction and the cytosol, depending on the dynamics of local calcium concentrations. Therefore, two separate SERCA flows for the junction and the cytosol were implemented. The outflow from the ER is facilitated by IP3R channels, RyR channels and the ER leak. The majority of intracellular calcium is bound to calcium storage or buffer proteins (Liu et al., 2010; Islam, 2020). To account for buffered calcium, buffer terms were included for the cytosol and the ER, but not for the junction.
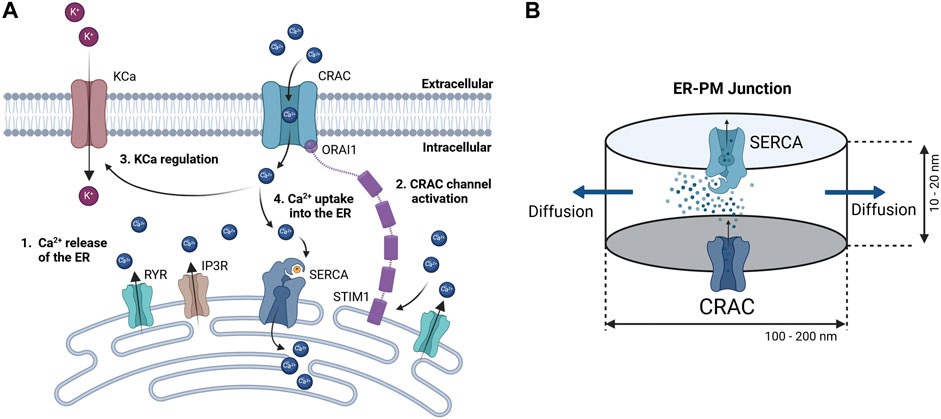
2.1.1 Calcium dynamics in the ER-PM junctionSince detailed knowledge of the ER-PM junction is lacking accurate spatial modeling of the junctional calcium distribution requires certain assumptions. In general, the ER-PM junction is defined as the space between the PM and the ER. Following calcium depletion from the ER via RyR and IP3R channels, ER resident STIM1 proteins undergo conformational change, oligomerize, and translocate to ER-PM junctions, where they cluster to bind and activate the PM-resident ORAI1 channels and form the CRAC channels (see Figure 3A). During this process the STIM1 proteins remain anchored in the ER and cannot fully leave it, which implies that the thickness of the junction is partially limited by the length of the cytosolic STIM1, estimates for which vary between 10 nm to 20 nm (Islam, 2020). The ER does not have a smooth elliptical shape with a single large contact plane to the PM, but has a lamellar structure (Plattner and Hentschel, 2017) that comes into close contact with the PM in many small gaps. The small gaps are referred to as the ER-PM junctions in this work, whereas the sum of all junctions is called the ER-PM micro domain. Based on a detailed spatial approach of the junctional calcium [Ca2+]Jun introduced by McIvor et al., 2018, it can be assumed that [Ca2+]Jun near the PM is roughly at a constantly high level with a spike in the direct vicinity of the CRAC channels and then declines in a linear manner towards the edge of the junction, where it aligns with [Ca2+]Cyt. This is in line with the predictions from Hogan, 2015. Both approaches consider the junction as a single entity directly bounded by the cytosol or cytosolic calcium concentration. In this work, however, it is assumed that the junction is located within the microdomain and is surrounded by other junctions, which reduces the influence of the cytosol. As a consequence, we designed the ER-PM junction as a cylinder with a uniformly distributed calcium concentration inside and the ring surface acting as a diffusion layer with a linear diffusion profile towards Ca2+ cytosol, as shown in Figure 3B.
Figure 3. Concept of calcium dynamics in the (A) ER-PM junction and (B) single junction geometry and calcium flows for modeling. The junction is assumed to be a cylinder with CRAC channels at the PM (bottom) side, SERCA pumps at the ER (top) side, and a diffusion flow to the cytosol (lateral area).
Inside the junction only the SERCA pump, the CRAC channels and the diffusion to the cytosol are considered to influence [Ca2+]Jun. All other possible ion channels or calcium binding proteins are not taken into account. With the current available knowledge (Hogan, 2015; McIvor et al., 2018), it is more feasible to directly model the calcium concentration of an individual junction rather than that of the microdomain, as this allows to circumvent the influence of other proteins and the irregularities of the ER surface. There are only estimations of how these junctions are actually shaped or sized. As there are no reports or measures for the junction dimensions of the A549 cell line, the measures are taken from other non-excitable cells instead (Hogan, 2015). The junctions are assumed to have a cylindrical shape, with a height between 10 nm and 20 nm and a diameter of 100 nm–300 nm. In other cell types, the micro domain is estimated to contain roughly 200 to 400 junctions (Hogan, 2015), which serves as a guiding value for this model.
2.1.2 Mathematical description for the SOCE mechanismThe calcium concentrations of the three different compartments, cytosol Ca2+Cyt, endoplasmic reticulum Ca2+ER and the ER-PM junction Ca2+Ju are described by a set of ODEs, which are designed based on continuity equations.
dCa2+Cytdt=JIP3R+JRYR+JLeak−JSERCA,Cyt−JPMCA+nJuVCytJDiff−dCa2+B,Cytdt(1)dCa2+ERdt=VCytVERJSERCA,Cyt−JIP3R−JRYR−JLeak+nJuVJuVERJSERCA,Ju+dCa2+B,ERdt(2)dCa2+Judt=JCRAC−JSERCA,Ju−1VJuJDiff(3)The terms Jx denote the calcium flow through the specified channel x, with calcium inflows having a positive sign and calcium outflows having a negative sign. The constants VCyt, VER and VJu are the volumes of the cytosol, ER and junctions respectively, used to scale the ion flux between the domains and nju represents the number of assumed ER-PM junctions. The last terms at the end of Eqs 1, 2 describe the influence of the calcium buffers of the cytosol Ca2+B,Cyt and the endoplasmic reticulum Ca2+B,ER. The individual ion channel models that describe the gating behavior and open probability are summarized in detail in the Supplementary Material Part B.
Additionally, based on the concept provided by Liu et al. (Liu et al., 2010; Liu, 2012), a Ca2+ leak current Jleak between the ER and the cytosol, with constant flow rate Rleak, driven by the concentration gradient between the ER and the cytosol, is included into the SOCE model:
JLeak=Rleak Ca2+ER−Ca2+Cyt(4)CRAC channels play a critical role in mediating store-operated calcium entry and are key channels in this process. What distinguishes CRAC channels from others is their property of being both calcium- and voltage-dependent. While many studies tend to focus only on either calcium or voltage dependence, here we consider both aspects in its mathematical description.
JCRAC=nCRAC gCRAC ρCRACCa2+ER∗V−ECa∗−1vcccj(5)with vcccj=1F z VJuwhere the term (V-ECa) describes the voltage dependence, V the membrane potential and ECa the Nernst potential for Ca2+ ions and vcccj a conversion constant that scales the current into an “ion flux”. The Nernst potential depends on the dynamic local [Ca2+] and is therefore updated for each time step:
ECa=RTzFlnCa2+ExtCa2+Ju(6)where R is the universal gas constant, F the Faraday constant, z the elementary charge of Ca2+, T the temperature and [Ca2+]Ext the extracellular calcium concentration.
It is known that CRAC channels are strongly inwardly rectifying under physiological conditions and therefore only allow calcium influx into the cell. To prevent a possible Ca2+ efflux under certain experimental conditions, the driving force is set to zero if an outward CRAC current is to be forced.
V−VCa=V−VCa ∀ V−VCa <0 0 ∀ V−VCa≥0(7)If the potential difference is used as driving force in conjunction with the electrical conductance gCRAC, an electric current is obtained according to Eq. 5. This current is then converted into an “ion flux” - using the constant vcccj, which is defined as follows:
where F is the Faraday constant, z the charge of calcium and VJu the volume of the target compartment, which in this case is the junction volume.
The formation of CRAC channels involves the interaction between the STIM1 protein in the endoplasmic reticulum and ORAI pore in the plasma membrane. According to Lui et al. (Liu et al., 2010; Liu, 2012), the activation process can be described in two steps. In the first step, when the endoplasmic concentration of calcium ions decreases, Ca2+ dissociates from STIM1, which leads to the activation of STIM1 (Liu, 2012).
nsCa2++STIM1 →fs←bs CansSTIM1(9)where [STIM1] describes the activated form and [CansSTIM1] the inactivated calcium bound molecule. To simplify the computation, the following relation is used (Liu et al., 2010):
CansSTIM1=TotalSTIM1−STIM1(10)Therefore, the reaction mechanism can be written as follows:
dSTIM1dt=−fsSTIM1Ca2+ERns+bsTotalSTIM1−STIM1(11)where fs is the binding rate, bs the dissociation rate and ns a positive exponent (Liu et al., 2010). The activated STIM1 then spreads across the ER-PM junction, where it binds to the ORAI pore to form the CRAC channel, which is formulated as follows:
STIM1+ORAI1 →f0←b0 CRAC(12)The differential equation for the CRAC channels can be derived similarly to the STIM1 equation.
dCRACdt=f0TotalORAI1−CRACSTIM1−b0CRAC(13)Since, to our knowledge, no data are available for the total STIM1 and ORAI1 concentration, the initial values for [TotalSTIM1] and [TotalORAI1] are both set to 1. With this setting, the values for STIM1 and CRAC vary from 0 to 1 and can be interpreted as the relative amount of bound or unbound proteins, with the calculated CRAC value corresponding to the dimensionless relative amount of CRAC channels formed. Once the CRAC channels are formed, they are considered to be immediately open, so the CRAC variable indicates the relative number of open CRAC channels (Liu et al., 2010), i.e. the open probability for calculation of the CRAC current according to Eq. 14:
2.1.3 Model parameterizationThe parameterization of the model is based on literature data and experimental data published elsewhere. In detail, the gating parameters for the CRAC, IP3R and RyR channel models were taken as stated in the original models (Sneyd and Dufour, 2002; Lee and Keener, 2008; Liu, 2012), with channel conductances or maximum flow rates varied to achieve a proper fit to the available experimental data. For the CRAC channel, the conductance was chosen to be the same as in the initial A549 in silico model (Zweifach and Lewis, 1993; Langthaler et al., 2021). The amount of CRAC channels per junction and the total number of junctions nju are based on literature data (Hogan, 2015; McIvor et al., 2018) and were adjusted to fit the experimental data in Padar et al., 2004; Hou et al., 2011. The parameters for the generic cytosolic buffer term and for the IP3 concentration were taken directly from Liu, 2012. For the calsequestrin buffer, parameters from Shannon et al., 2004 were used and the amount of calsequestrin was adjusted.
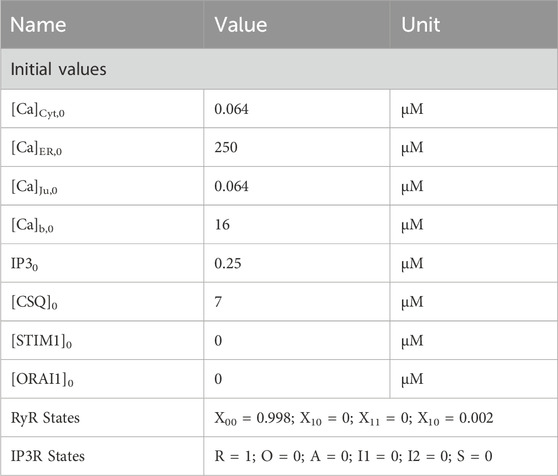
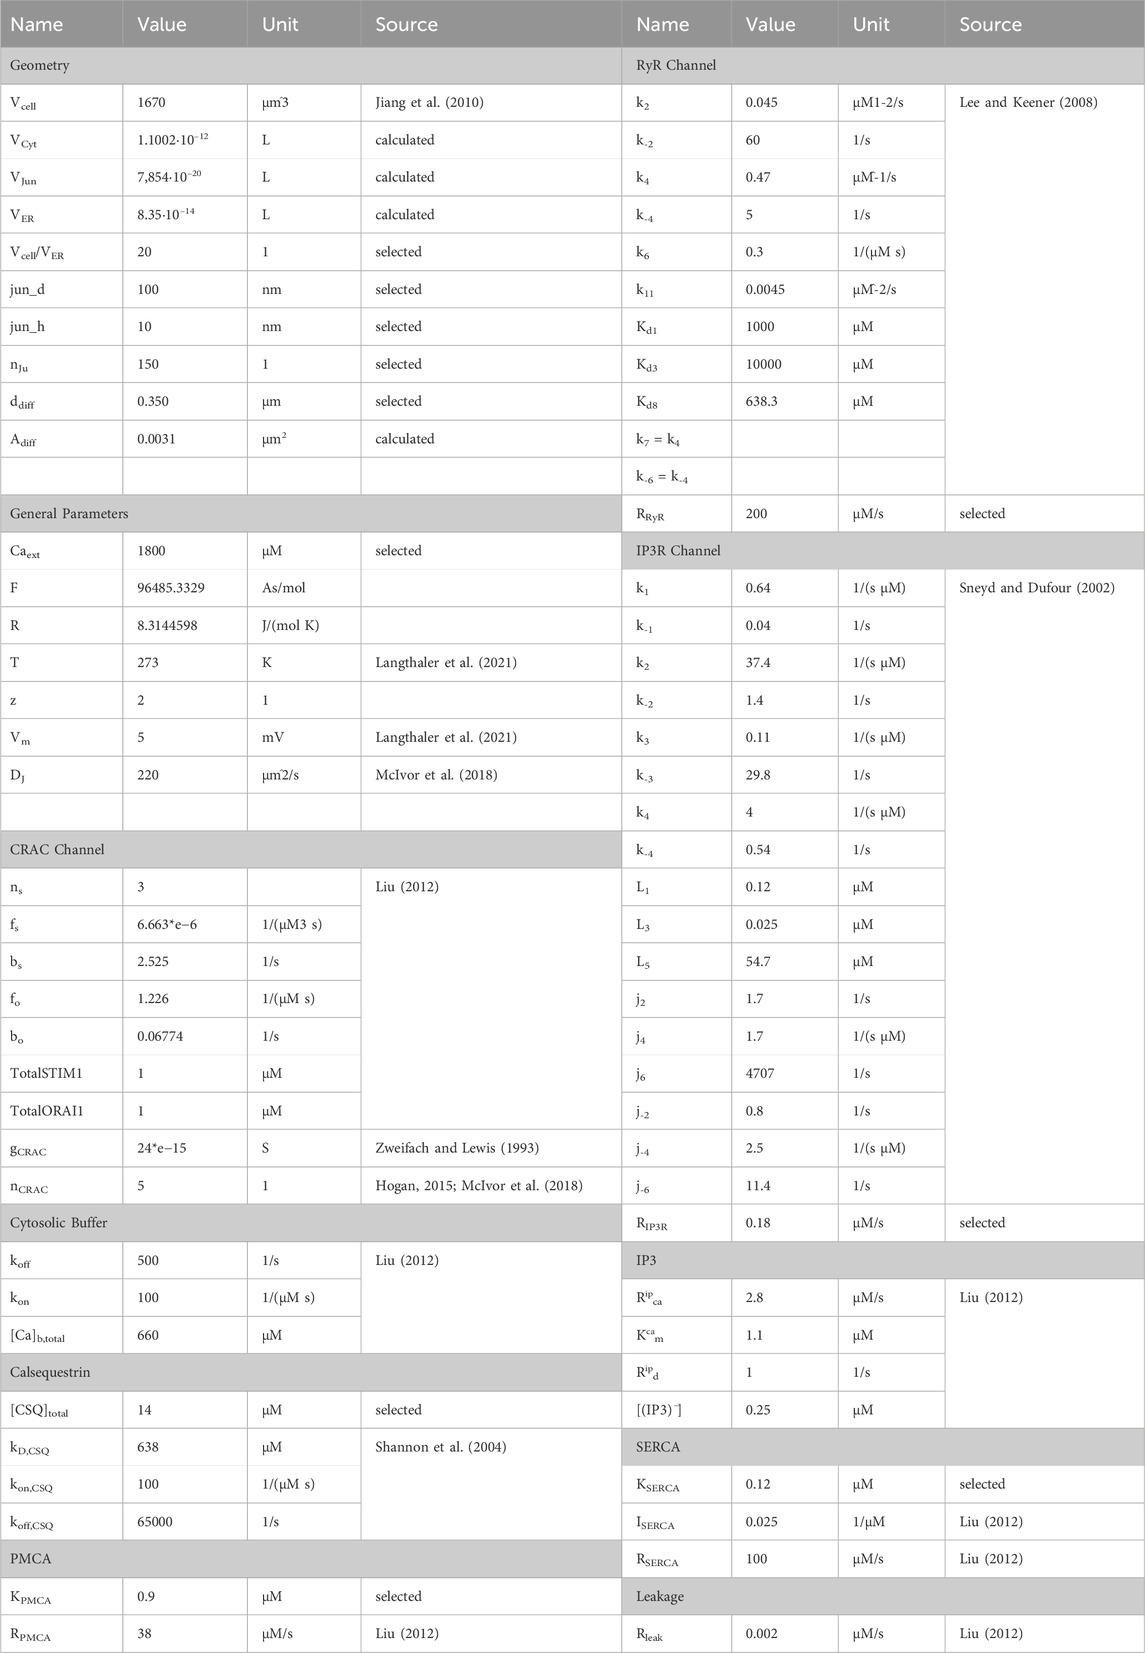
Conversion of electrical ion currents to particle flow rates requires the consideration of target volumes. A detailed report on the structure of A549 cells is provided by Jiang et al., 2010, according to which the cell diameter is 10.59–14.93 µm and the cell volume can be estimated to be 1670 μm3. The cellular volume can be divided into 28% nucleus and 72% cytoplasm, which can be roughly further subdivided into 4.6% mitochondria, 2.5% lamellar bodies, 1.39% lysosomes and the remaining cytoplasm. Since there are currently no estimates on the structure or size of the endoplasmic reticulum of the A549 cell, it is assumed that it occupies 5% of the cell volume. Typically, the junction dimensions are a height between 10 nm and 20 nm and a diameter of 100 nm–300 nm. In other cell types the micro domain is estimated to contain roughly 200 to 400 junctions, which serves as a guide value for this model, with 150 junctions selected to fit the experimental data. Assuming the junction to be a cylinder, the volume was calculated with a height of 20 nm and a diameter of 100 nm, as outlined in Table 2. The cytosolic volume is calculated by subtracting all listed sub volumes from the reported cell volume. The scaling factors were assessed based on the geometrical assumptions as described. The initial values for the differential equations were either assumed based on expected values or based on their original sources. The parameters and initial values used are summarized in Table 1 and Table 2.
Table 1. Initial values for calcium simulations.
Table 2. Summary of model parameters.
2.2 Available experimental data for verification of the SOCE modelTo verify whether the SOCE model actually describes and reproduces the calcium dynamics in A549 cancer cells, the model is compared with calcium measurements reported in the literature. Two studies were found that conducted suitable experiments on calcium channels important for this model (Hou et al., 2011; Shin et al., 2018). The experiment by Hou et al., 2011 was chosen as a reference since it directly shows the function of the CRAC channels and indirectly the function of IP3R channels, RyR channels and PMCA pumps. (see Figure 5C in Hou et al., 2011). The measurement depicts the relative fluorescence, which allows for conversion to the calcium levels (Padar et al., 2004). However, as the fluorescence parameters are not clearly defined in this work, a direct relationship and thus a quantitative comparison with the calcium levels is not possible. In detail, the measurement starts in a calcium-free environment, with a constant fluorescence intensity, indicating equilibrium of the cytosolic calcium level. Approximately 1 minute later, 2 µM Thapsigargin (TG) is added in order to block the SERCA pumps. This causes a net calcium efflux from the ER via IP3R and RyR channels as well as the ER leak, that raises the cytosolic calcium. The outflow continues until the ER is depleted within 2 minutes. At this point all STIM1 proteins should be bound to ORAI1, resulting in the opening of all available CRAC channels. In a next step, the cells are perfused with 2 mM Ca2+, which leads to a rapid and large rise of the calcium level as calcium flows into the cytosol, predominantely via CRAC channels. The steep rise is followed by a plateau phase, indicating the maximum calcium inflow in the cytosol through the fully activated CRAC channels. As the SERCA channels remain blocked, the ER is further depleted of calcium and the CRAC channels stay open. The calcium influx is then terminated by the addition of 100 µM 2-APB, a store-operated calcium channel blocker, causing the calcium levels to decline to the resting level, probably mediated by calcium extrusion pumps such as PMCA. To reproduce this experiment, the developed model was set to an arbitrary starting point with an external calcium concentration of zero. Depending on the parameter setting, the calcium concentration lasts some seconds to minutes until a steady state is reached. Addition of drugs and external calcium is assumed to occur at time points 66s for the TG, 231s for the perfusion with calcium and 429s for the CRAC channel blockage (Hou et al., 2011). The modulation of the corresponding channels depending on the effect of the drugs administered is then simulated by adjusting the model parameters accordingly.
Another suitable experiment is reported by Shin et al., 2018, where compound K was used to trigger ER Ca2+ release in A549 cells, showing the effect of the drug on cytosolic calcium levels, the results of which are depicted in Figure 4A in Shin et al., 2018. In the first experiment, compound K is added to the cell in order to trigger ER Ca2+ release, which is indicated by a quick and permanent increase in the cytosolic calcium concentration. In a second experiment the cells are incubated before addition of the channel blocker dantrolene and BAPTA-AM, an intracellular Ca2+ chelator, to block RyR and IP3R channels, which reduces the apoptotic effect and prevents increase of cytosolic Ca2+. While it is not possible to simulate the effect of compound K, it is possible to compute a forced calcium release through RyR channels by increasing the channels' flow rate in order to reproduce the measured data by model simulations (Shin et al., 2018).
2.3 Implementation of the SOCE model and the combined A549-SOCE modelImplementation of the SOCE sub-model and the combined A549-SOCE model using MATLAB/Simulink (R2019b, MathWorks Inc.) is described in the Supplementary Material Part C. As in the initial A549 model, the equations are solved using the forward Euler method (ODE1 in Simulink), with a fixed step size of 5・10−7 s. The combined model is run on a workstation (2–4 × 256 GB RAM, CPU 2.20 GHz (Intel(R) Xeon(R) Fold 5220R), 48 cores, 96 logical processors), with a runtime of approximately 3–4 h for a 10 s simulation. The final A549-SOCE model approach is shown in Figure 4.
Figure 4. Extended A549-SOCE model by combining the initial plasma membrane channels with a detailed description of intracellular calcium channels and corresponding Ca2+ buffers in the endoplasmic reticulum and cytoplasm.
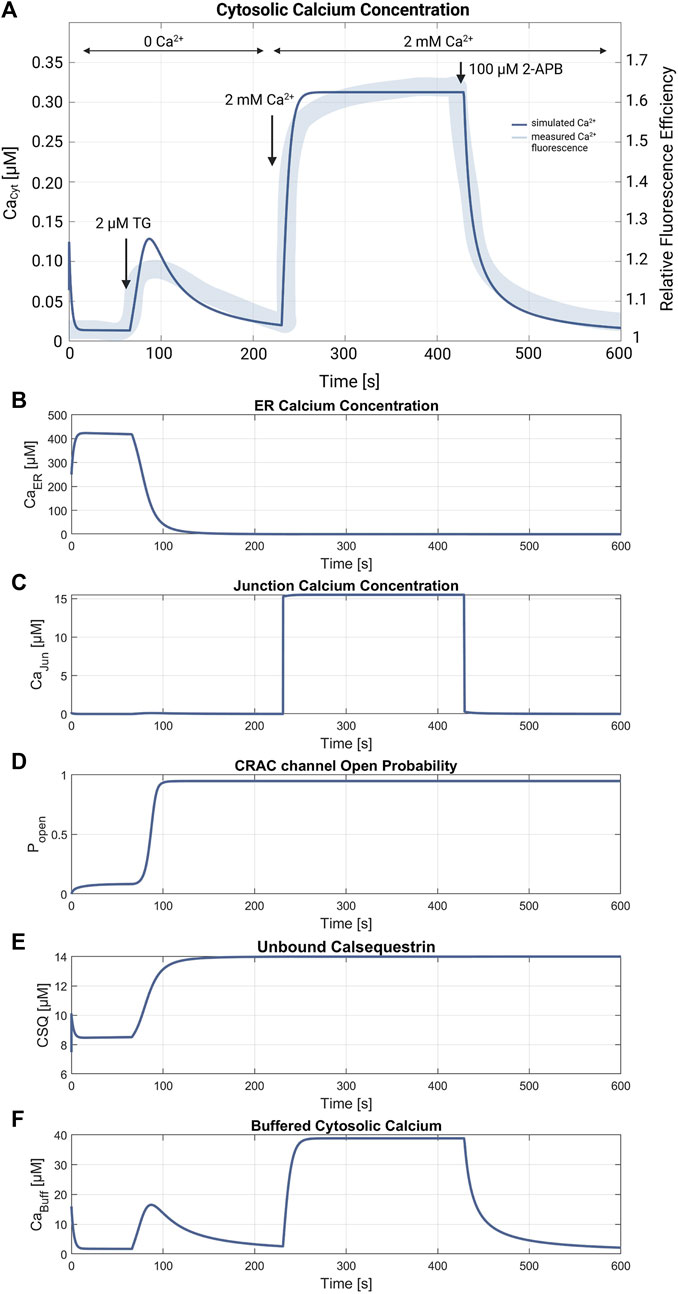
3 Results3.1 SOCE model simulation and verificationFigures 5, 6 demonstrate the simulations for the settings of the SOCE concept (described in the Material and Methods section) based on the experiment by Hou et al., 2011 (cf. Figure 5C in Hou et al., 2011). Figure 5 shows a comparison of the cytosolic calcium concentration simulation versus the measured calcium fluorescence in the experiment. Note that the simulation yields an artificial steep calcium spike in the beginning, which reveals the transient response of the SOCE model setting to the calcium-free starting condition. Importantly, we emphasize that this transient response has no further impact on subsequent simulations. Once the initial phase is concluded, the simulation stabilizes, and the system reaches a physiologically relevant state. Despite all channels being active during this phase, the SERCA pumps are the most active, leading to a decrease of [Ca2+]Cyt to a baseline of about 13 nM, while [Ca2+]ER increases. The course of the buffered calcium inside the cytosol follows [Ca2+]Cyt in shape, but with higher scaling. After 66 s, the flow rate of the SERCA pumps in the model is set to zero to simulate blockage by 2 μM TG application, resulting in a net outflow from the ER, and thus in a rapid decrease of [Ca2+]ER and increase of [Ca2+]Cyt. During the ER efflux the IP3R and RyR channels open and increase calcium release. After reaching a temporal maximum of 128 nM, [Ca2+]Cyt declines as the PMCA responds to the rising calcium levels and clears the cell of the remaining calcium. In this phase, the CRAC channels are activated by the decreasing ER calcium and reach an open probability of 95%. The addition of extracellular calcium causes an immediate transient current through the open CRAC channels, which settles at 0.87 fA after a short settling phase. The influx is followed by PMCA outflow, resulting in an almost constant calcium concentration of 334 nM. The calcium concentration of the junctions follows the course of [Ca2+]Cyt with roughly the same values up to this point. The CRAC channel influx causes [Ca2+]Jun to reach 15 µM during the plateau phase. The endoplasmic calcium and the CRAC channel open probability remain unchanged. The subsequent blocking of the CRAC channels is achieved by setting the number of CRAC channels per junction to 0.001, causing [Ca2+]Cyt and [Ca2+]Jun to decrease rapidly. Figures 5D–F summarize the simulations of the relevant SOCE parameters [Ca2+]ER, [Ca2+]Jun, CRAC channel open probability, buffered Ca2+ inside the cytosol, and Ca2+ unbound calsequestrin.
Figure 5. SOCE model verification. (A) Cytosolic calcium concentration simulation using the SOCE model (thin line in blue) superimposed with the measured calcium fluorescence from the experiment by Hou et al., 2011 (cf. Figure 5C in Hou et al., 2011) (thick line in blue). The arrows mark the addition of 2 µM Thapsigargin (TG) to block the SERCA pumps, start of perfusion of the cells with 2 mM Ca2+, and addition of 100 µM 2-APB, a store-operated calcium channel blocker. Simulation of the relevant SOCE parameters (B) [Ca2+]ER; (C) [Ca2+]Jun; (D) CRAC channel open probability; (E) Ca2+ unbound calsequestrin; and (F) buffered Ca2+ in the cytosol.
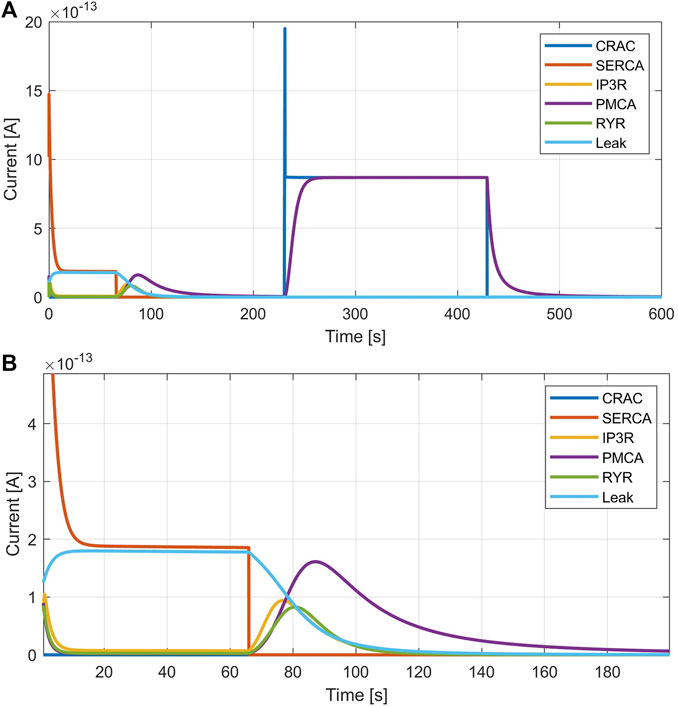
Figure 6. Calcium currents simulated with the SOCE model. (A) Currents throughout the entire simulation. (B) Zoom of SERCA pump inhibition.
Figure 6 shows the currents of the ion channels in the simulated SOCE experiment. During the initial resting phase, ER efflux provoked by IP3R and RyR currents is almost zero and calcium leaves the ER mainly through the implemented leakage current. During the SERCA inhibition after 66 s, the leakage decreases, but both, the IP3R and RyR currents, increase in a bell-shaped fashion. While these channels are active, the ER is completely emptied of calcium, as illustrated by the decrease of [Ca2+]ER and increase in unbound calsequestrin in Figures 5B,E. The calcium-free calsequestrin is capped at 14 μM, which is assumed to be the total amount of protein and means that no more calcium is buffered in the ER. The PMCA current starts at about the same time as the ER depletion, but is larger and decays much slower, similar to [Ca2+]Cyt. The addition of calcium leads to the opening of the CRAC and PMCA channels. Neglecting the spikes, i.e. the simulation artifacts caused by the direct supply of extracellular calcium, the CRAC and PMCA currents reach peak values of 0.9 pA. After CRAC blocking by 2-APB, only the PMCA current remains, which decreases rapidly. At the end of the simulation, all calcium compartments and buffers are almost empty and all calcium fluxes end.
3.2 Variation of model parametersTo evaluate how different parameter settings affect the model’s behavior, various simulations were carried out (see Supplementary Materia Part D). The simulations in Supplementary Figures SD1, A–C are shown for the cytosolic calcium concentration, as this parameter can be measured experimentally. Each sub plot in the figure yields a variation of a single parameter, while one graph (in blue) serves as the reference simulation with the basic settings used for Figure 5. These simulations support the basic functionality of the proposed model description, as the mechanism of the CRAC channels and the junction model work properly.
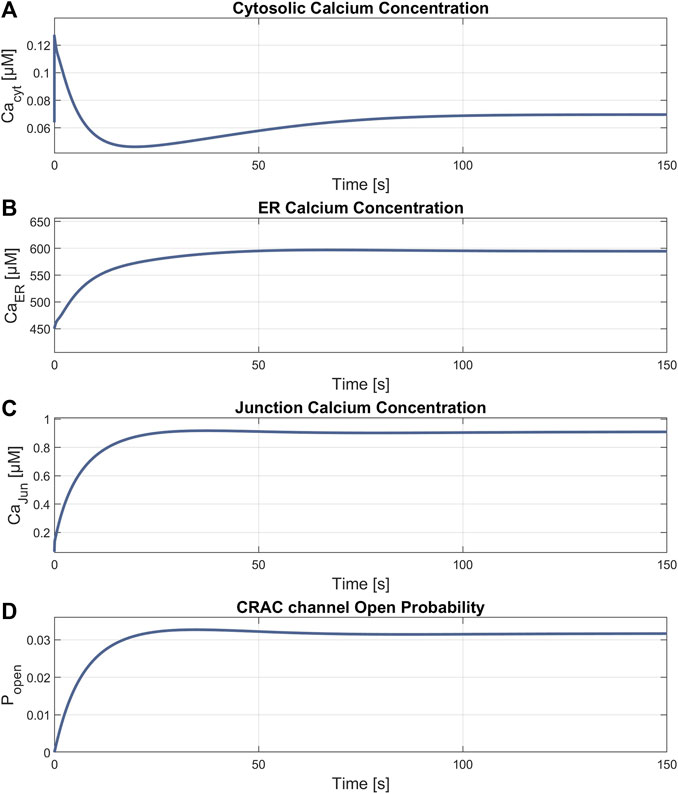
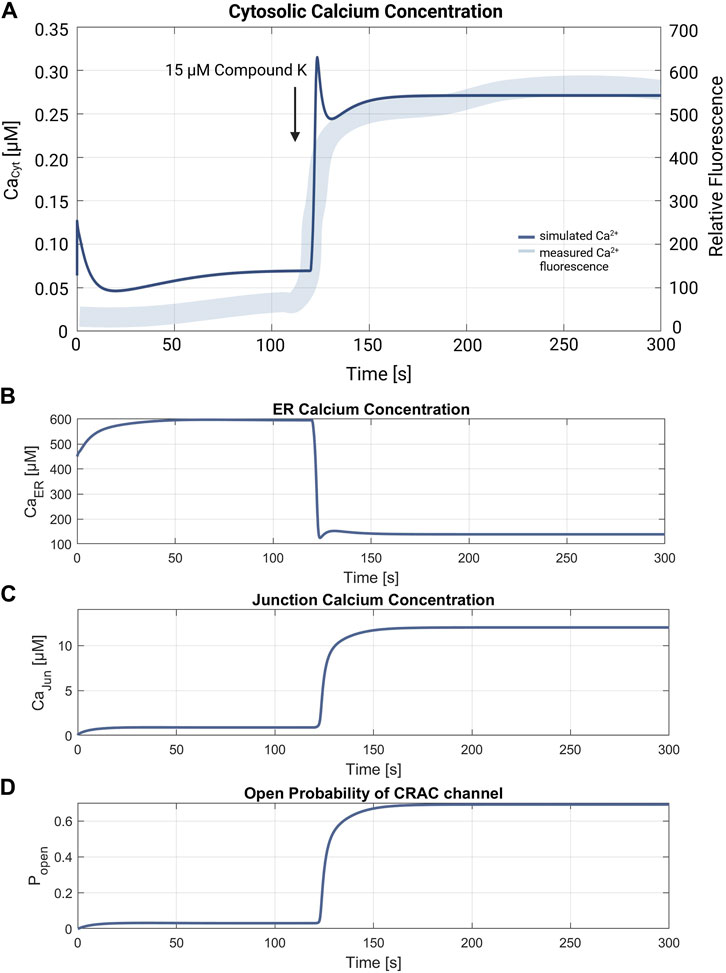
3.3 Simulation of RyR channel mediated ER calcium releaseThe simulation of the compound K experiment by Shin et al., 2018 as shown in Figure 8, starts in a steady state configuration. Hereto the SOCE model is run with an external calcium concentration of 1.8 mM for about 100 s, until steady state is reached. The resulting calcium concentrations with [Ca2+]Cyt of 69 nM, [Ca2+]ER at 660 μM, [Ca2+]Jun at 0.9 µM and an open probability of the CRAC channels of 3% are shown in Figure 7. Note that the calcium concentrations depend on the parameter settings and thus result from the selected model parameterization. After reaching the baseline, the conductance of the RyR channel is increased by a factor of 10 at s 130, resulting in a steep increase of [Ca2+]Cyt with a small overshoot that settles to a plateau after 20 s. The activation of RyR channels, rapidly depletes the ER of calcium and [Ca2+]ER drops to 139 µM, as shown in Figure 8B. This, in turn, leads to an increased open probability of CRAC channels, which rises to 69% and lifts the junction calcium concentration [Ca2+]Jun to 12 µM.
Figure 7. Results of the steady state simulation. Parameters with final values for (A) Ca2+Cyt = 69 nM; (B) Ca2+ER = 594 μM; (C) Ca2+Jun = 0.9 µM and (D) ρCRAC = 0.03.
Figure 8. Verification of the compound K experiment by Shin et al., 2018. (A) Superimposition of the simulation of the cytosolic calcium concentration (thin line in blue) with the measured compound K concentration (thick line in blue). The arrow marks the addition of 15 µM compound K, leading to the RyR channel activation. The resulting cytosolic calcium level is Ca2+Cyt = 272 nM. Simulations of (B) the ER calcium concentration, (C) the junction calcium concentration and (D) the open probability of the CRAC. Resulting calcium levels are Ca2+ER = 139 µM and Ca2+Jun = 12 µM. The final open probability of CRAC channels is ρCRAC = 0.69.
3.4 The combined A549-SOCE in silico modelTo compare simulations of the combined A549-SOCE model with the original A549 simulations, the combined model was run in steady state configuration for the cell cycle phases G0, G1, S and G2-M. Therefore, the membrane potential Vm was simulated by numerically solving Eq. 15 for Vm, starting at +5 mV until steady state was reached (t = 40 s, dt = 5.10–7):
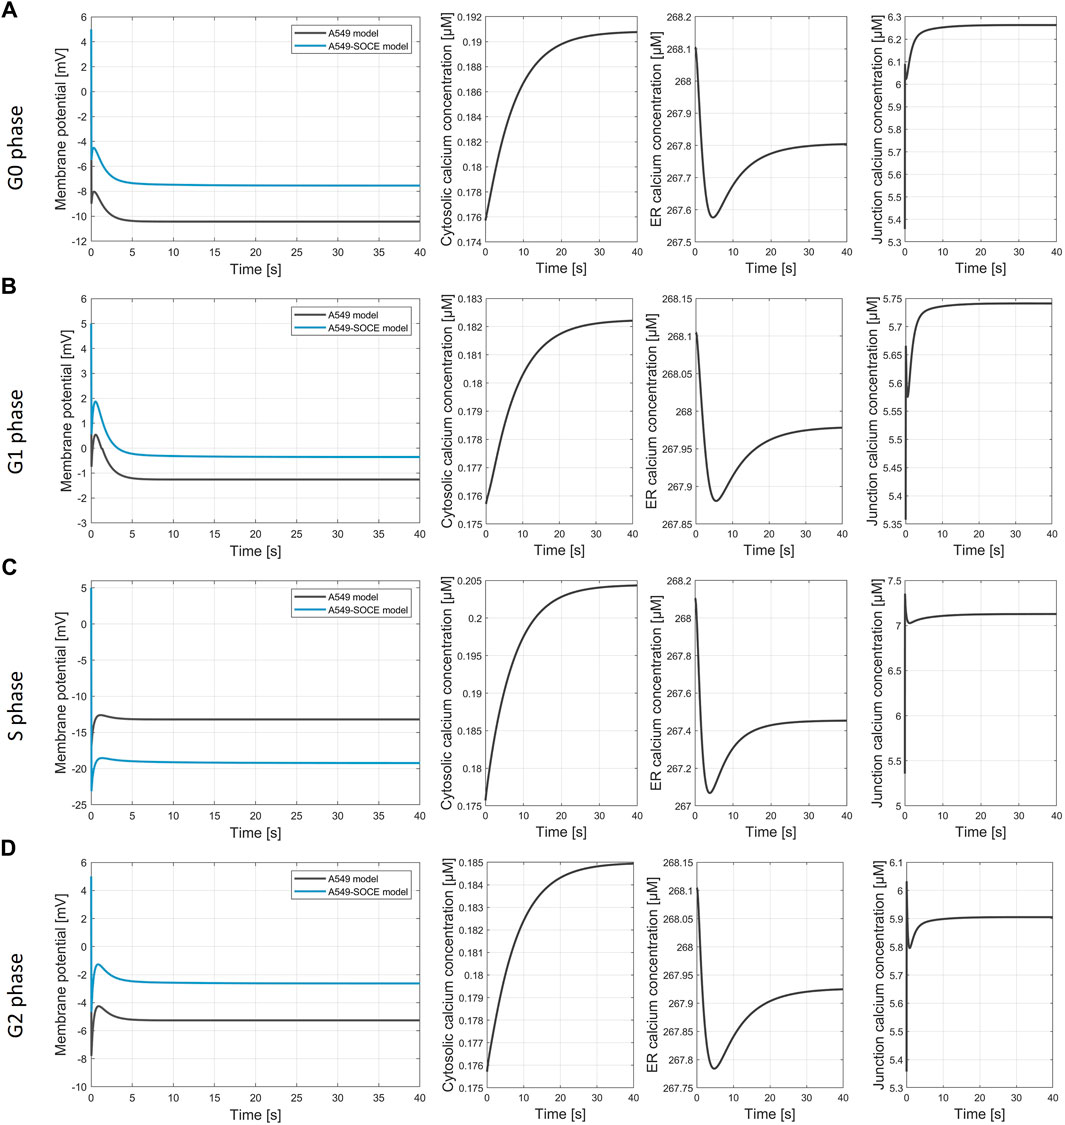
C∙dVmdt=−Iwhole_cell(15)Figures 9A–D show the calculated membrane potentials of the combined A549-SOCE model and of the original A549 in silico model for the cell cycle phases G0, G1, S and G2-M with the plasma membrane ion channel composition as denoted in the original A549 model version (Langthaler et al., 2021) for comparison, without taking into account potential alterations in ion channel expression within the ER or Ca2+ depletion from the ER during distinct phases of the cell cycle. Since the open probability of the CRAC channels is lower with the new Ca2+ formalism, the number of CRAC channels was set to 1500 instead of 200 in the original A549 model in order to achieve comparable CRAC currents. In addition, [Ca2+]Cyt and [Ca2+]Jun are also shown to examine the state of the SOCE model.
Figure 9. Simulation of the membrane potential during the cell cycle phases. (A) G0 phase, final values of the simulation Vm, A549 = −10.4 mV; Vm.A549-SOCE = −7.5 mV; [Ca2+]cyt = 0.191 µM; [Ca2+]ER = 267.8 µM; [Ca2+]jun = 6.263 µM; (B) G1 phase, final values of the simulation Vm, A549 = −1.21 mV; Vm.A549-SOCE = −0.25 mV; [Ca2+]cyt = 0.182 µM; [Ca2+]ER = 267.98 µM; [Ca2+]jun = 5.74 µM; (C) S phase, final values of the simulation Vm, A549 = −13.2 mV; Vm.A549-SOCE = −19.1 mV; [Ca2+]cyt = 0.204 µM; [Ca2+]ER = 267.45 µM; [Ca2+]jun = 7.13 µM; (D) G2 phase, final values of the simulation Vm, A549 = −2.6 mV; Vm.A549-SOCE = −5.3 mV; [Ca2+]cyt = 0.185 µM; [Ca2+]ER = 267.92 µM; [Ca2+]jun = 5.91 µM.
The membrane potentials as well as the response times of the combined model are roughly the same as those of the initial A549 model, as can be seen from the comparison of the membrane potential curves. For instance, the membrane potentials in G0 phase differ by less than 2 mV (Vm.original = −10.4 mV vs. Vm.calcium = −8.6 mV). A larger difference is seen in the S phase with VS.diff = 5.9 mV (cf. Figure 9C). The combined model thus well reflects the oscillating characteristics of the membrane potential Vm during cell cycle progression (G0 phase: hyperpolarization, G1 phase: depolarization, S phase hyperpolarization, and G2-M phase depolarization)). Figure 10 outlines the rhythmic membrane potential change during cell cycle progression simulated with the initial and combined A549-SOCE model and relative changes of the calcium levels to the resting G0 phase. During the cell cycle phases, the cytosolic calcium levels fluctuate slightly between 0.182 and 0.204 µM and [Ca2+]ER between 267.45 and 267.98 µM
留言 (0)